Lesley L. Smith – Extreme California Precip
All plots preliminary.
 |
Extreme Precipitation in California(CA DWR activity 6 subproject 2) Re. OLR-based MJO index "mjoindices" from https://github.com/cghoffmann/mjoindices: |
Former version of this page here
All nClimDiv daily precipitation data from A.Hoell; all ERA5 OLR daily data from M.Gehne.
Sample ERA-5 MJO (OMI) Plot November 2022 thru March 2023
where red star indicates a maximum California precip event: Jan 16, 2023

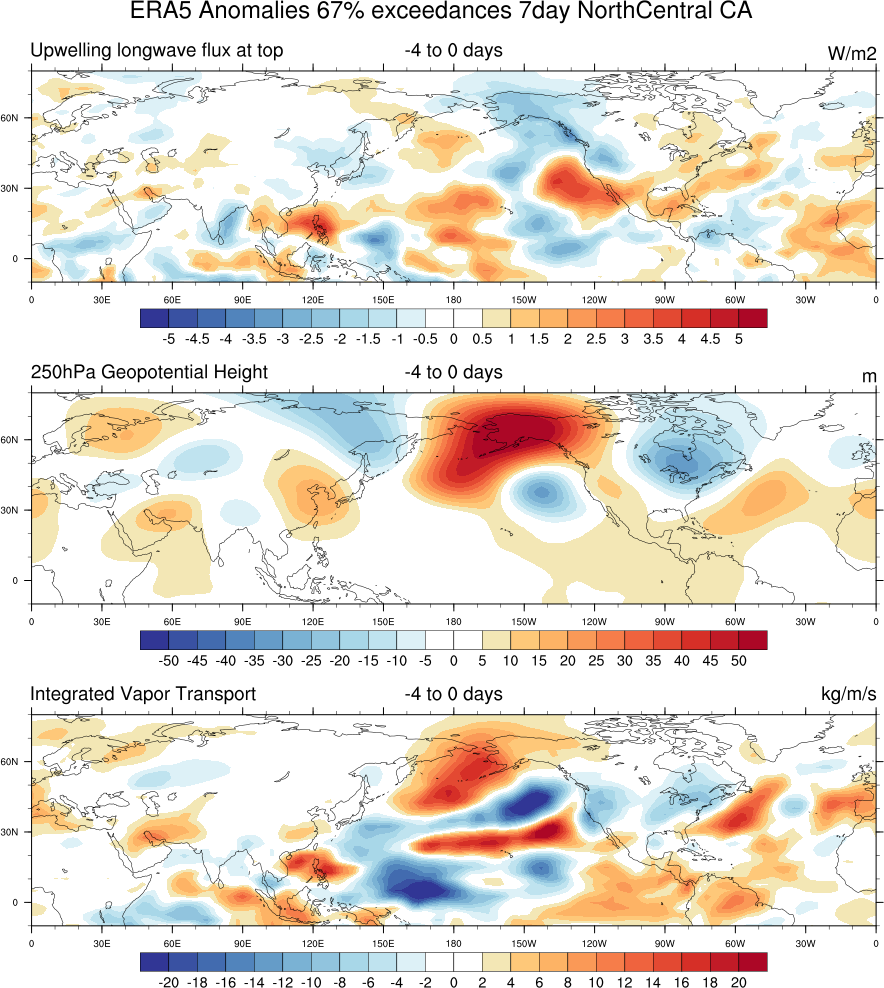
ERA5 Anomalies corresponding to nClimDiv Precip exceedances
7-day, 14-day accumulations
Northern_Central California 67 percentile samples at lags -4 to 0 days

Additional plots here:
7-day North 67%
14-day North 67%
7-day South 67%
14-day South 67%
7-day North 33%
14-day North 33%
7-day South 33%
14-day South 33%
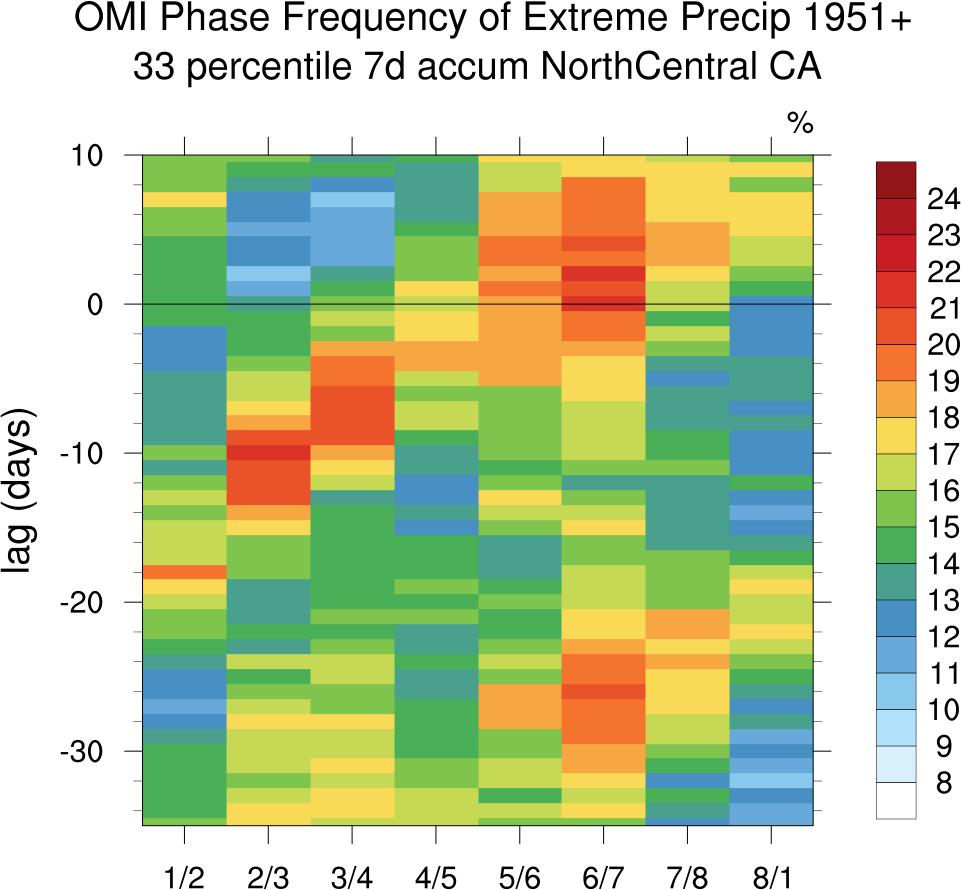
Re. OMI Phase frequency and extreme CA precip with MJO leads and precip lags:
7-day, 14-day accumulations:
Northern_Central California 33rd percentile (MJOs radius>1) Two MJO Phases at a time

Northern_Central California 67th percentile (MJOs radius>1) Two MJO Phases at a time


Southern California 33rd percentile (MJOs radius>1) Two MJO Phases at a time


Southern California 67th percentile (MJOs radius>1) Two MJO Phases at a time


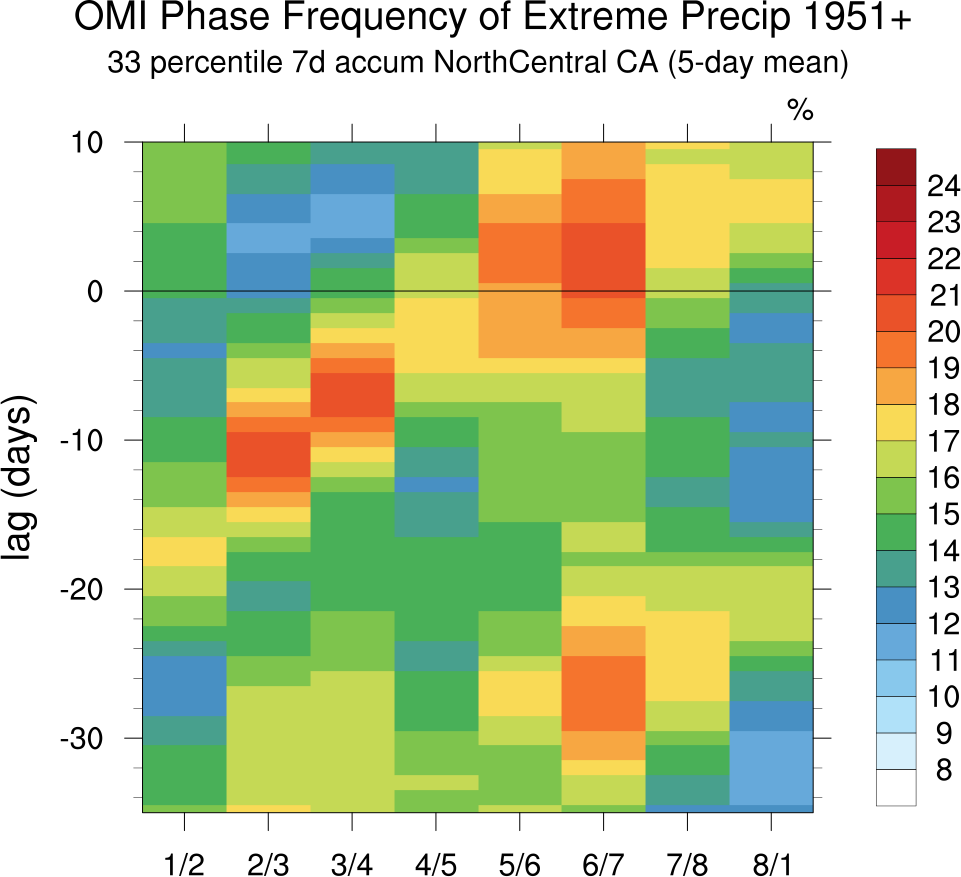
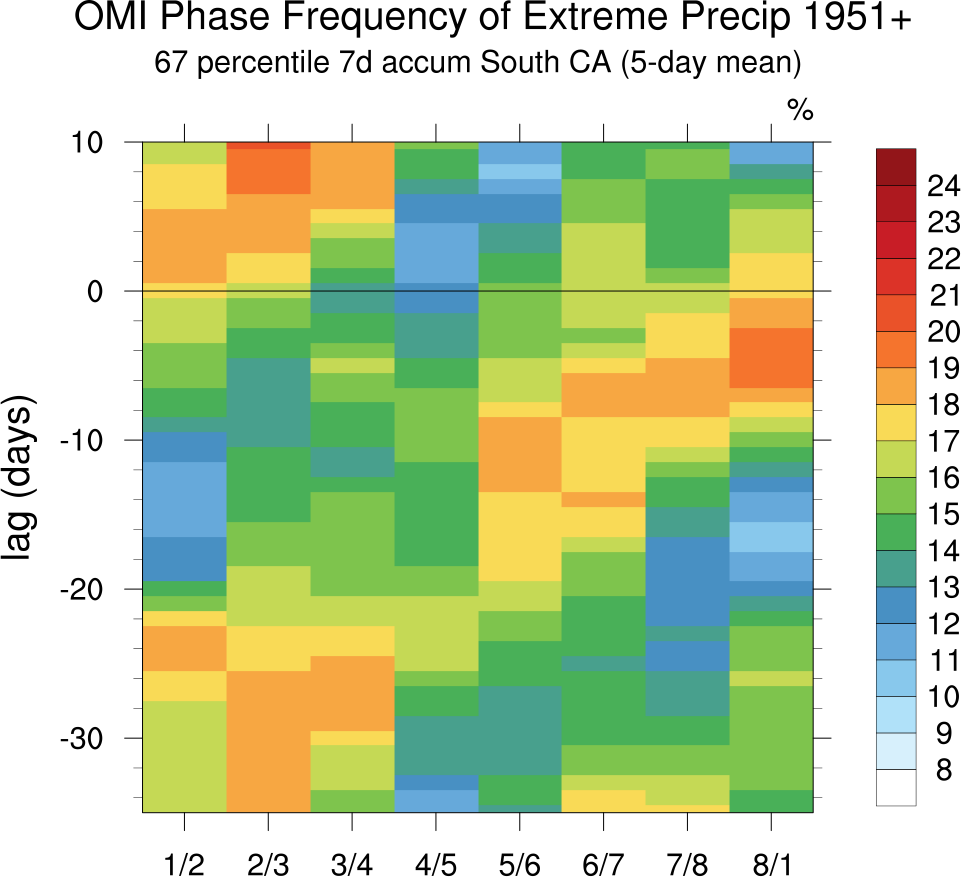
Re. OMI Phase frequency and extreme CA precip with MJO leads and precip lags:
7-day, 14-day accumulations and 5-day running mean
Northern_Central California 33rd percentile (MJOs radius>1) Two MJO Phases at a time

Northern_Central California 67th percentile (MJOs radius>1) Two MJO Phases at a time


Southern California 33rd percentile (MJOs radius>1) Two MJO Phases at a time


Southern California 67th percentile (MJOs radius>1) Two MJO Phases at a time

Re. OMI Phase frequency and extreme CA precip with MJO leads and precip lags:
7-day, 14-day accumulations:
Northern_Central California 33rd percentile (MJOs radius>1) One MJO Phase at a time


where the 7-day case included 414 nonoverlapping Nov-Mar precip-less-than-33-percentile points, 14-day case included 243 nonoverlapping Nov-Mar precip-less-than-33-percentile points;
with the Strong MJO condition reducing this to 27,39,38,22,22,37,27,40 7-day lag-0 Phase 1-8 points respectively
and 11,18,26,18,17,18,15,24 14-day lag-0 Phase 1-8 points respectively.
Northern_Central California 67th percentile (MJOs radius>1) One MJO Phase at a time
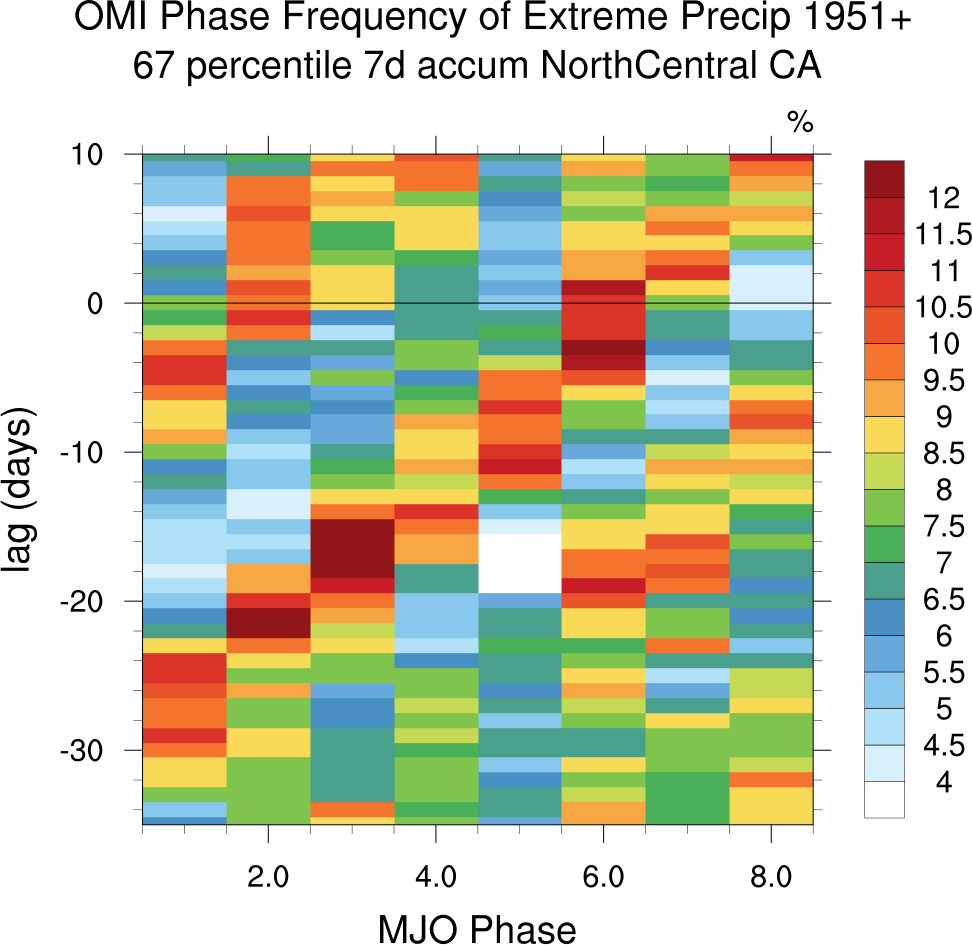
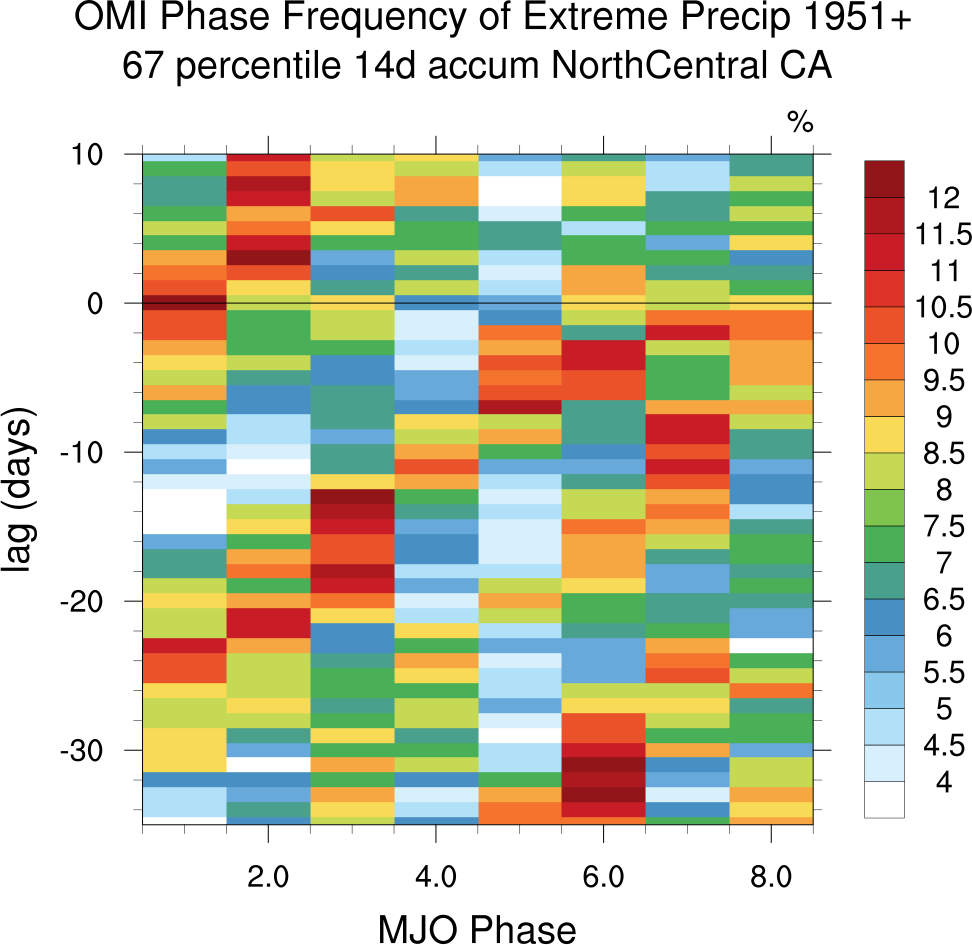
where the 7-day case included 292 nonoverlapping Nov-Mar precip exceedances, 14-day case included 166 nonoverlapping Nov-Mar precip exceedances,
with the Strong MJO condition reducing this to 12,19,31,29,12,31,19,24 7-day lag-0 Phase 1-8 points respectively
and 2,15,9,12,14,14,17,12 for 14-day lag-0 Phase 1-8 points respectively.
Southern California 33rd percentile (MJOs radius>1) One MJO Phase at a time


where the 7-day case included 418 nonoverlapping Nov-Mar precip-less-than-33-percentile points, 14-day case included 256 nonoverlapping Nov-Mar precip-less-than-33-percentile points,
with the Strong MJO condition reducing this to 28,31,38,22,21,33,34,35 7-day lag-0 Phase 1-8 points respectively
and 24,20,21,13,22,20,21,23 for 14-day lag-0 Phase 1-8 points respectively.
Southern California 67th percentile (MJOs radius>1) One MJO Phase at a time
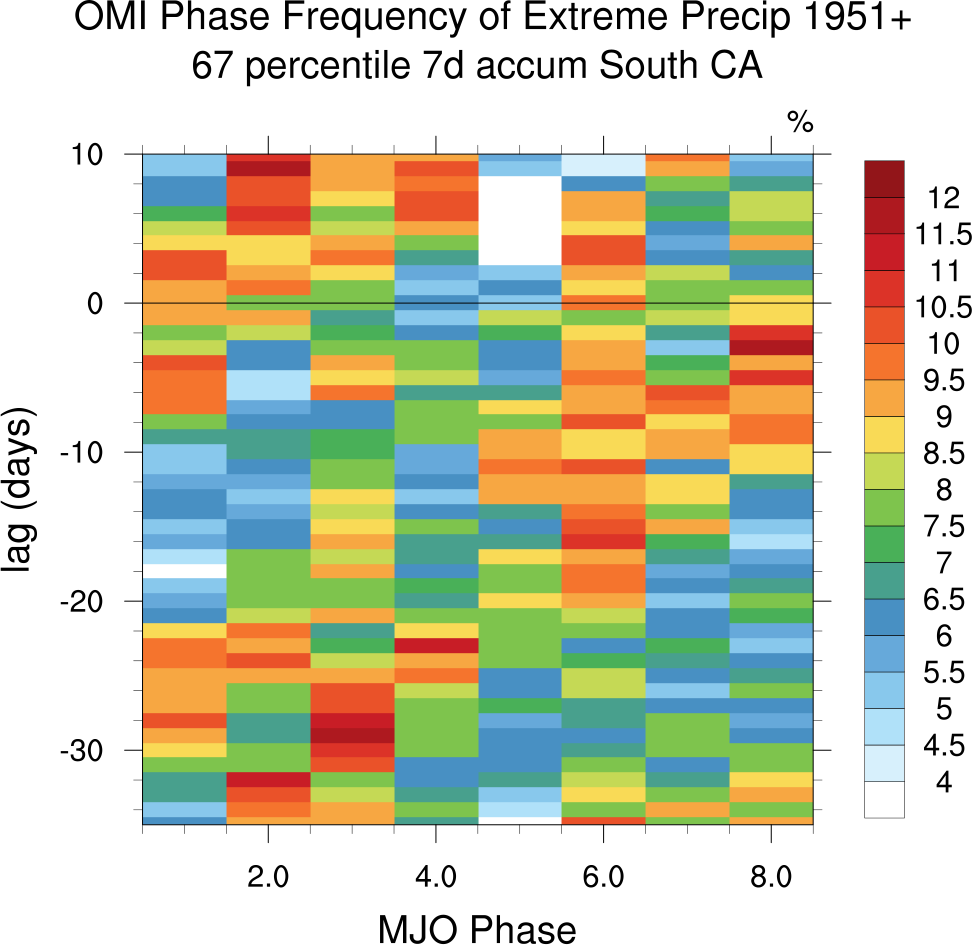

where the 7-day case included 276 nonoverlapping Nov-Mar precip exceedances, 14-day case included 153 nonoverlapping Nov-Mar precip exceedances,
with the Strong MJO condition reducing this to 13,18,24,14,21,18,30,21 7-day lag-0 Phase 1-8 points respectively
and 8,7,18,9,10,12,10,15 for 14-day lag-0 Phase 1-8 points respectively.
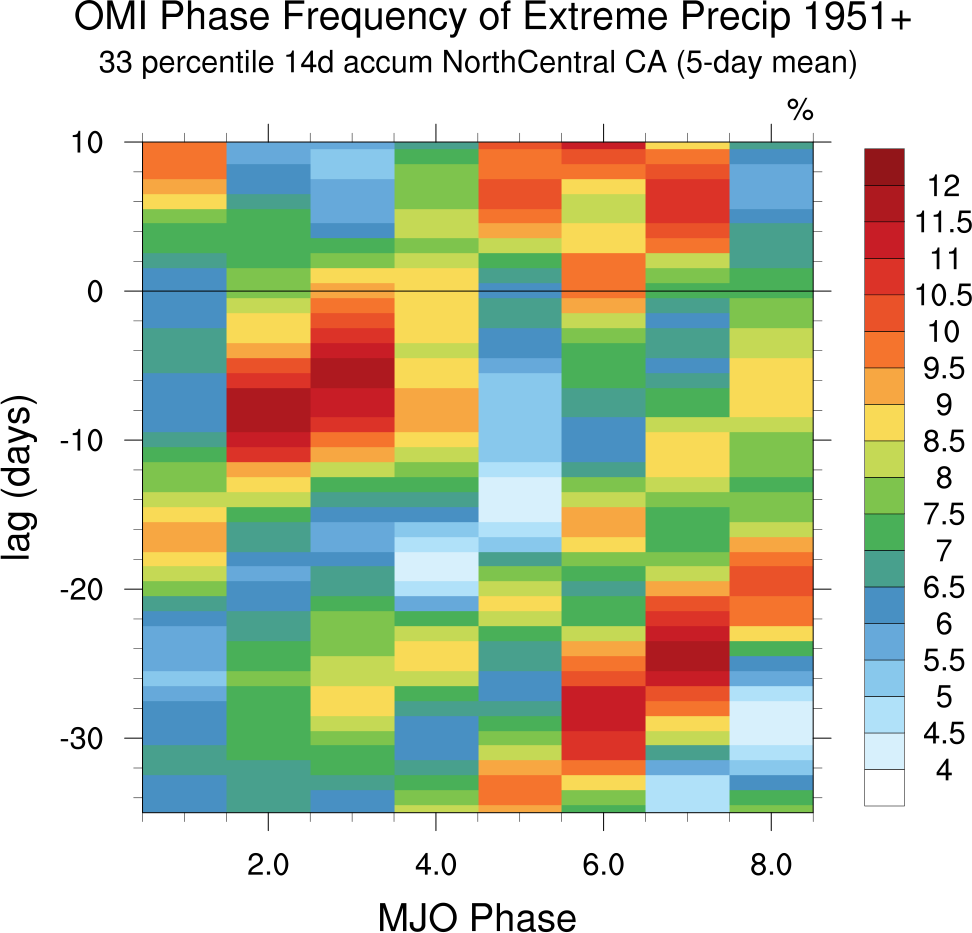
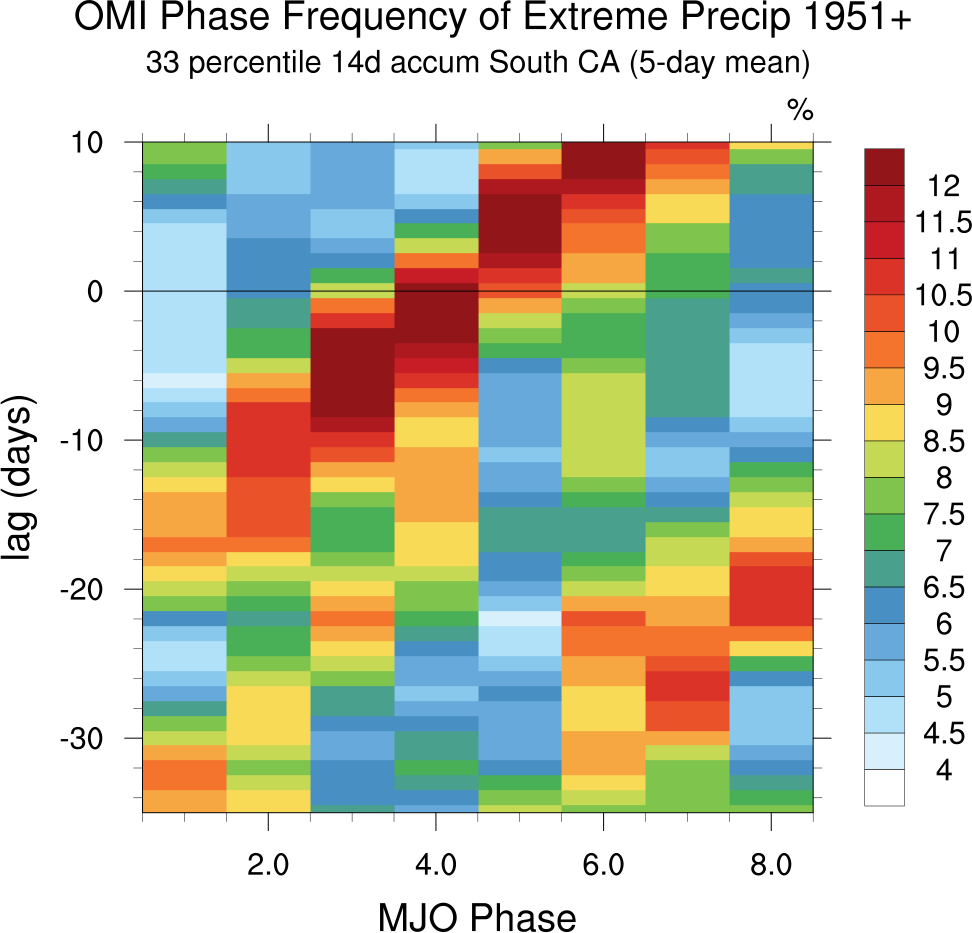
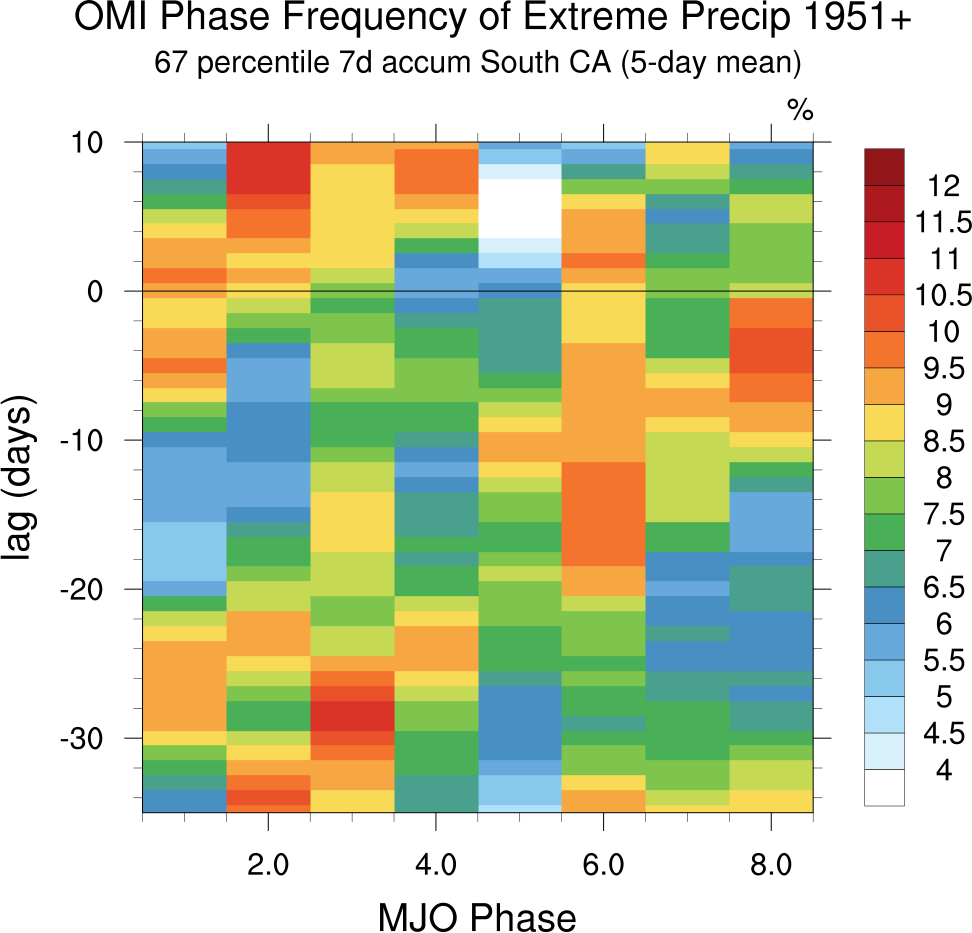
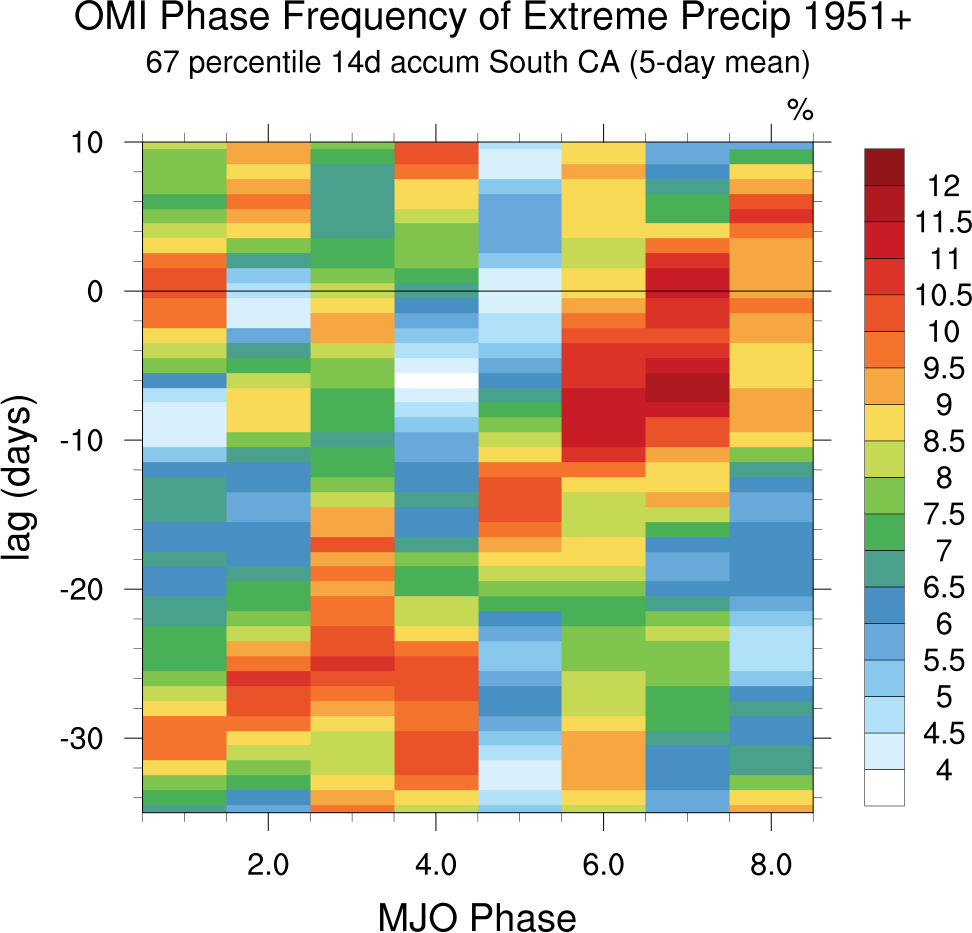
Re. OMI Phase frequency and extreme CA precip with MJO leads and precip lags:
7-day, 14-day accumulations and 5-day running mean
Northern_Central California 33rd percentile (MJOs radius>1) One MJO Phase at a time

Northern_Central California 67th percentile (MJOs radius>1) One MJO Phase at a time


Southern California 33rd percentile (MJOs radius>1) One MJO Phase at a time

Southern California 67th percentile (MJOs radius>1) One MJO Phase at a time
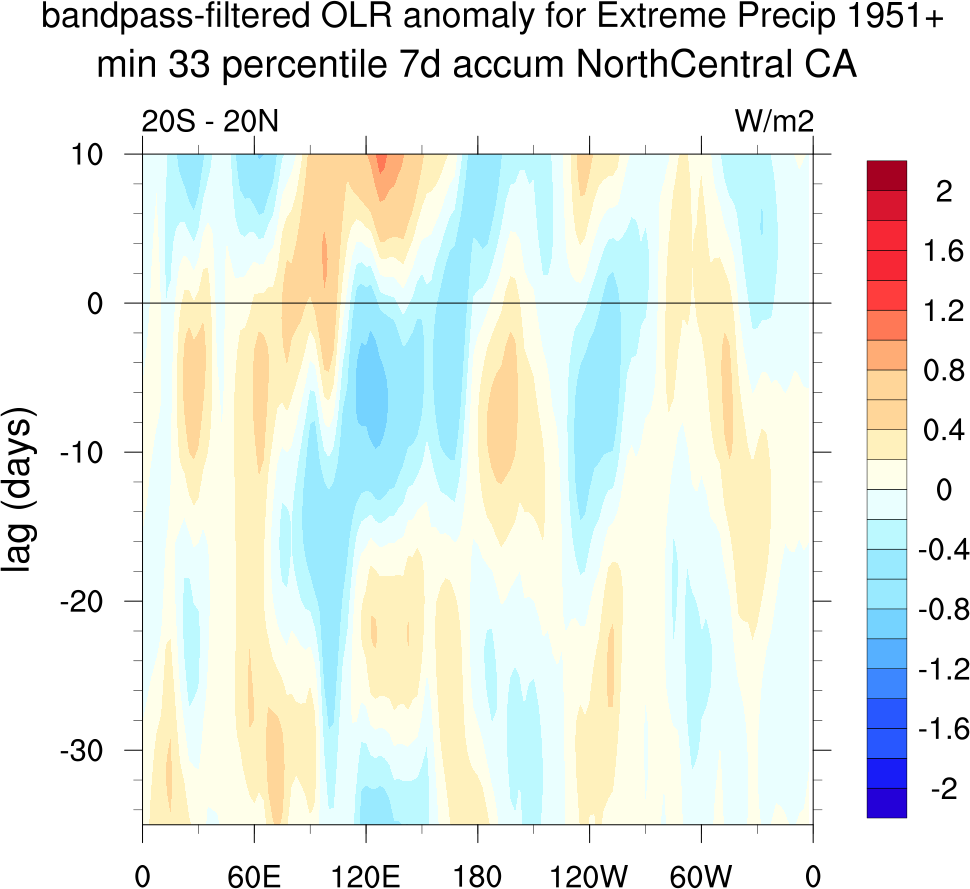
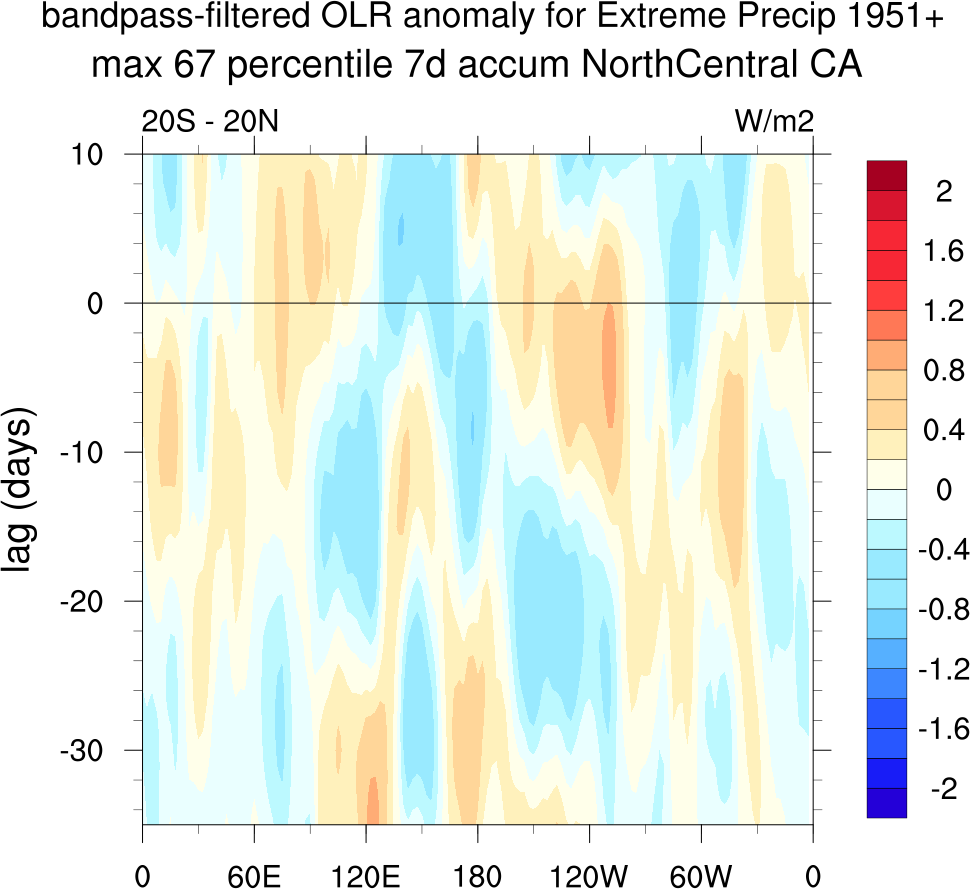
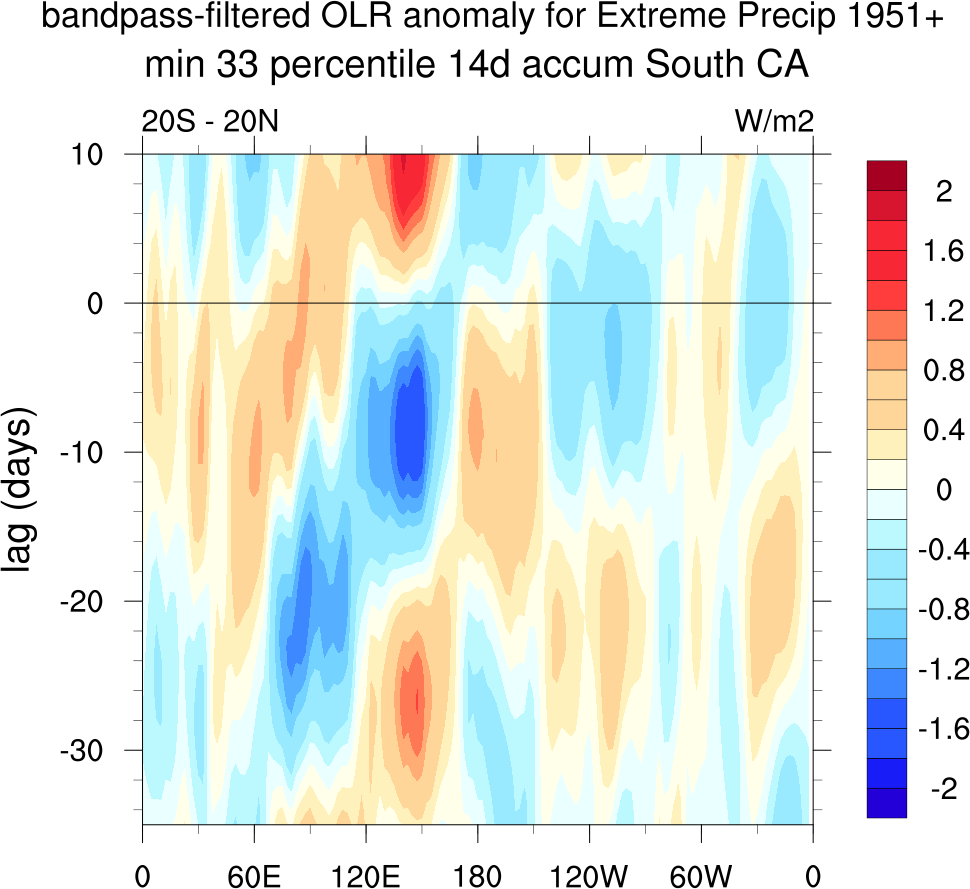
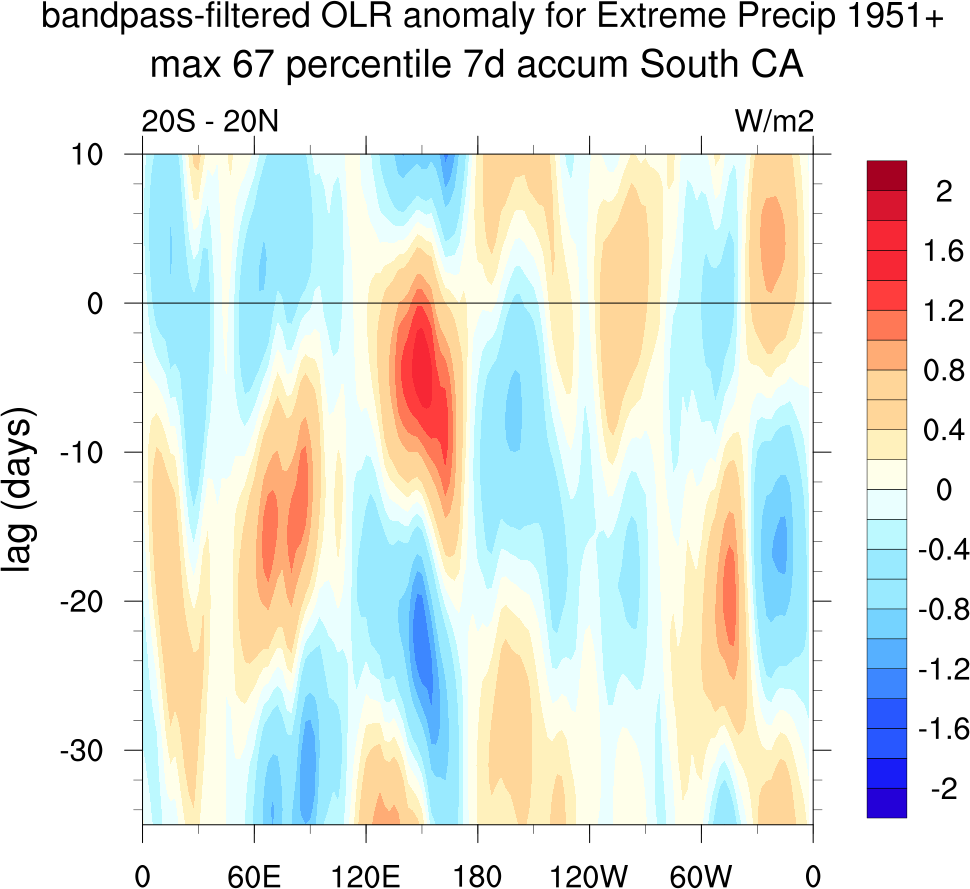
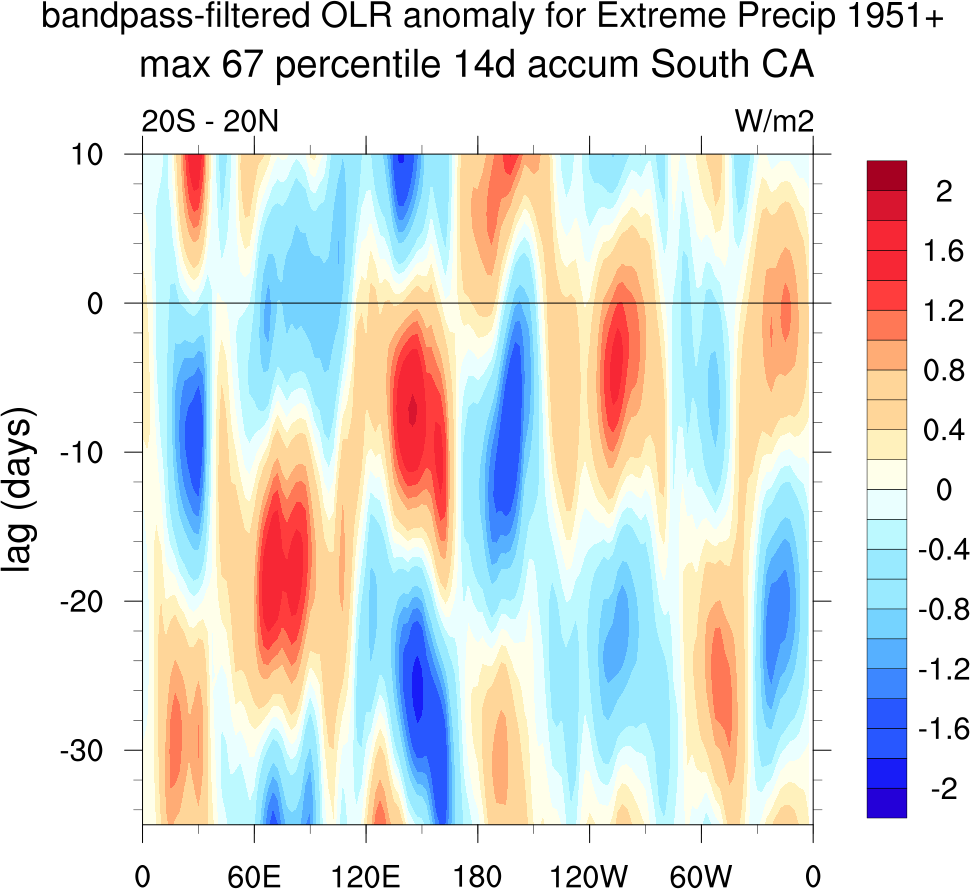
Re. bandpass-filtered OLR anomaly and extreme CA precip with OLR leads and precip lags:
7-day, 14-day accumulations:
Northern_Central California 33rd percentile

Northern_Central California 67th percentile

Southern California 33rd percentile

Southern California 67th percentile
Re. 250hPa geopotential height anomaly and extreme CA precip with geopotential_height leads and precip lags:
7-day, 14-day accumulations:
Northern_Central California 33rd percentile


Northern_Central California 67th percentile


Southern California 33rd percentile


Southern California 67th percentile


Re. OMI Phase frequency and extreme CA precip with MJO leads, El Nino and precip lags:
7-day, 14-day accumulations:
Northern_Central California 33rd percentile (MJOs radius>1)


Corresponding lag-0 dates and OMI MJO phase data: NorthCentral El Nino 7-day
NorthCentral El Nino 14-day
Northern_Central California 67th percentile
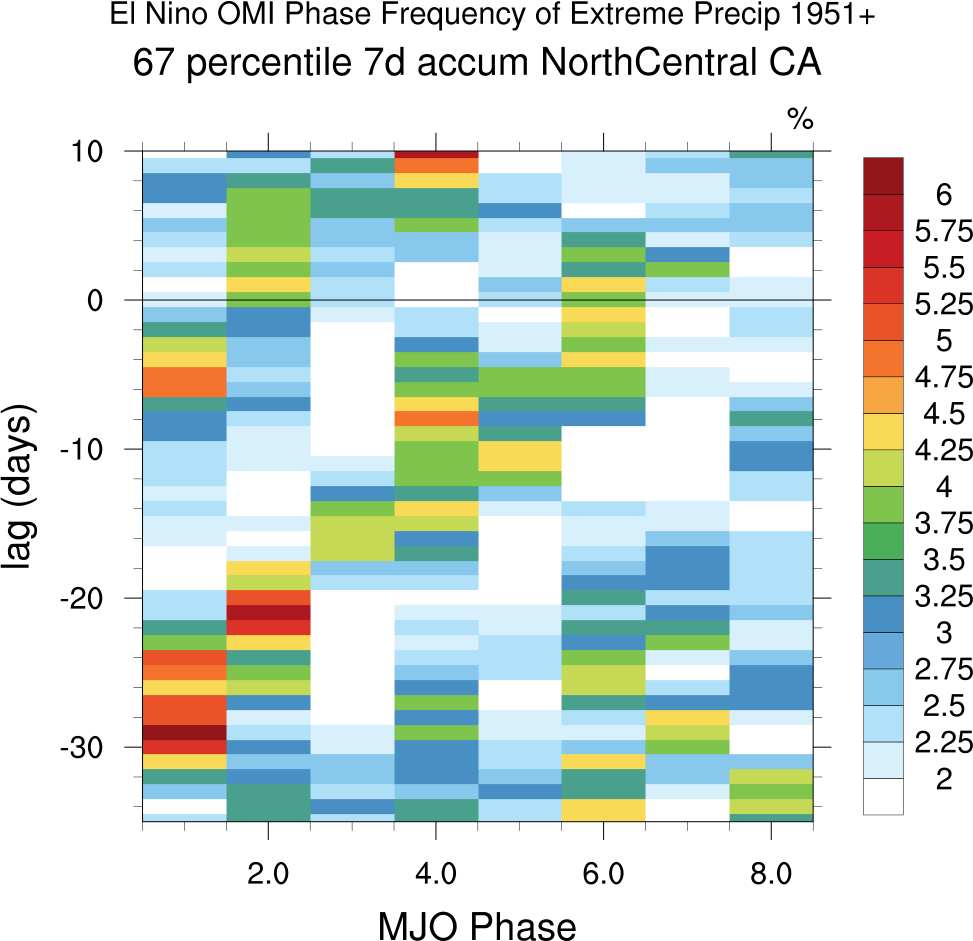

Corresponding lag-0 dates and OMI MJO phase data: NorthCentral El Nino 7-day
NorthCentral El Nino 14-day
Southern California 33rd percentile (MJOs radius>1)


Corresponding lag-0 dates and OMI MJO phase data: South El Nino 7-day
South El Nino 14-day
Southern California 67th percentile
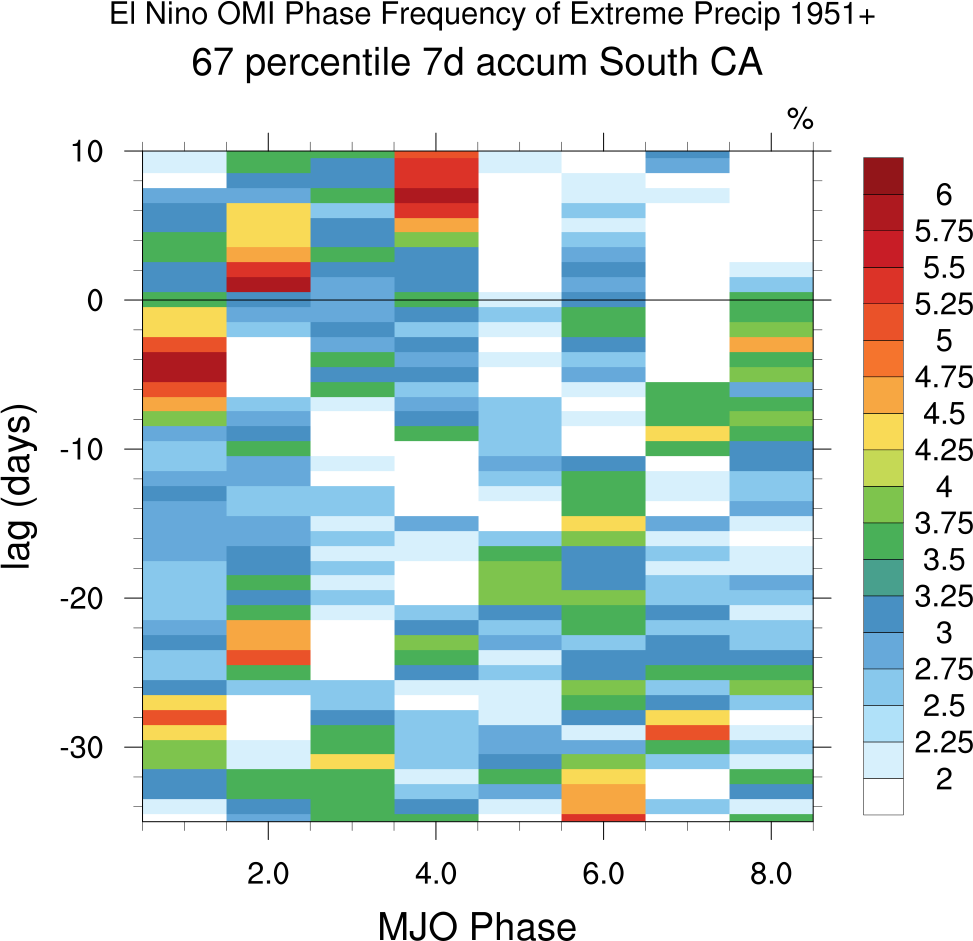

Corresponding lag-0 dates and OMI MJO phase data: South El Nino 7-day
South El Nino 14-day
Re. OMI Phase frequency and extreme CA precip with MJO leads, La Nina and precip lags:
7-day, 14-day accumulations:
Northern_Central California 33rd percentile (MJOs radius>1)


Corresponding lag-0 dates and OMI MJO phase data: NorthCentral La Nina 7-day
NorthCentral La Nina 14-day
Northern_Central California 67th percentile


Corresponding lag-0 dates and OMI MJO phase data: NorthCentral La Nina 7-day
NorthCentral La Nina 14-day
Southern California 33rd percentile (MJOs radius>1)
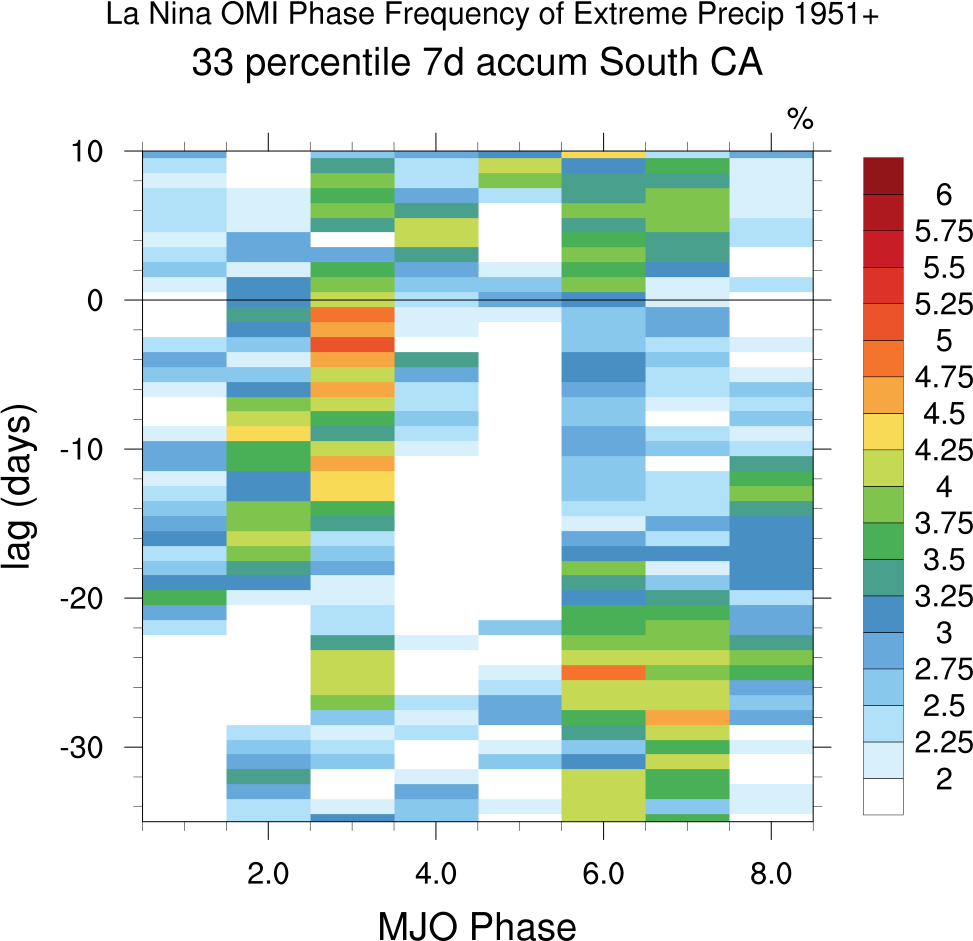

Corresponding lag-0 dates and OMI MJO phase data: South La Nina 7-day
South La Nina 14-day
Southern California 67th percentile
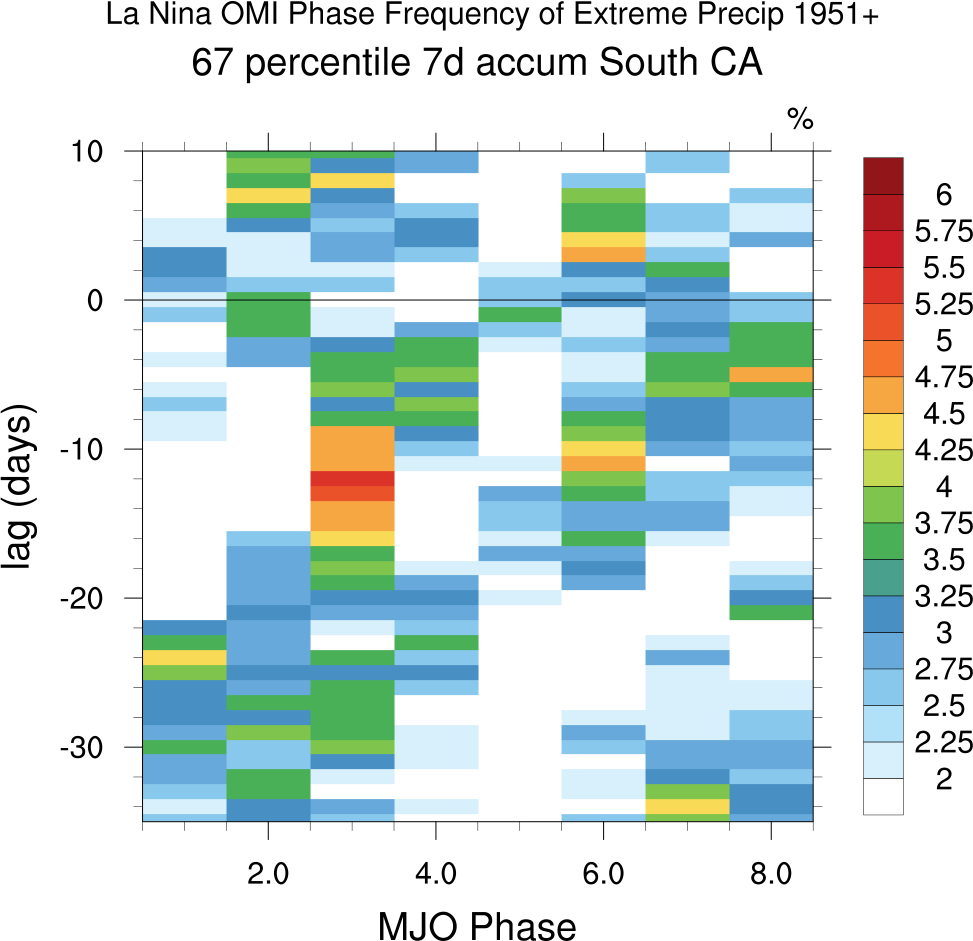

Corresponding lag-0 dates and OMI MJO phase data: South La Nina 7-day
South La Nina 14-day
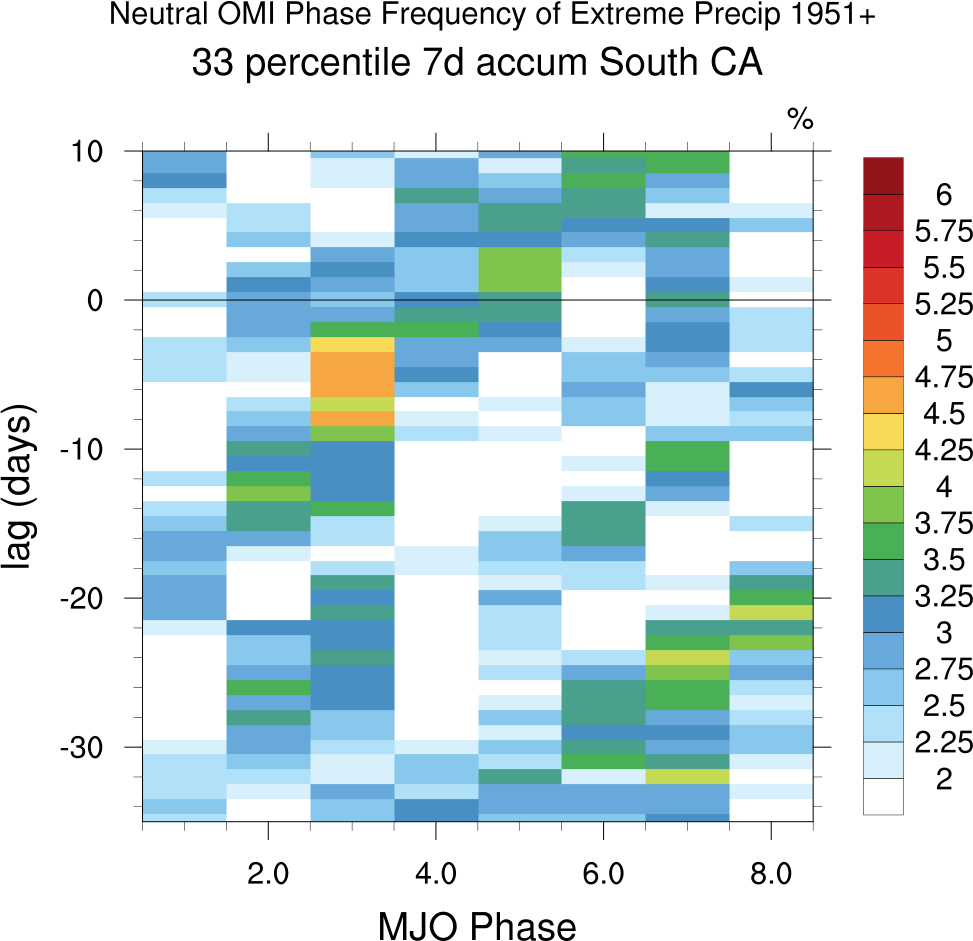
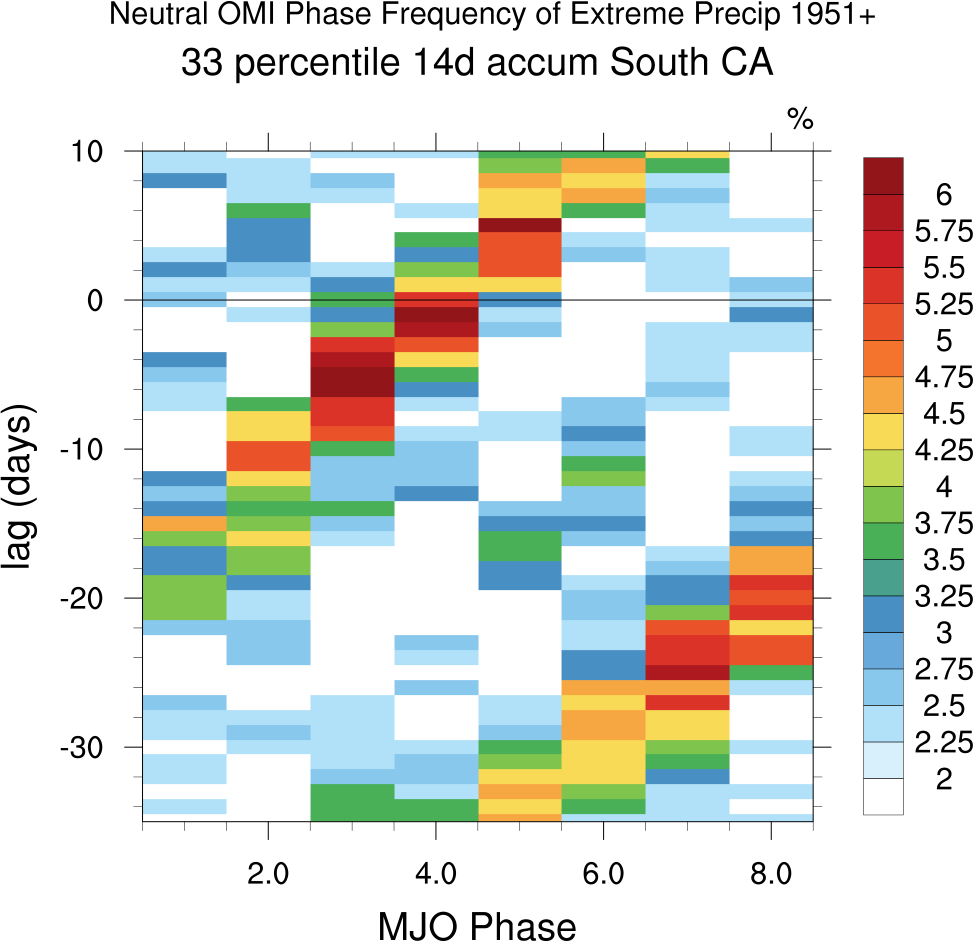
Re. OMI Phase frequency and extreme CA precip with MJO leads, ENSO Neutral and precip lags:
7-day, 14-day accumulations:
Northern_Central California 33rd percentile (MJOs radius>1)


Northern_Central California 67th percentile


Southern California 33rd percentile (MJOs radius>1)
Southern California 67th percentile

