

NEUBrew Diagnostic and Raw Data Displays
Notice: These data displays should be used for diagnostic purposes only!
Brewer Ozone Langley Regression Analysis ToolThe Langley Regression Application reads raw direct-sun ozone (O3DS) and zenith-sky ozone (O3ZS) measurements and plots MS9 (R6 ratio) values against airmass. The Langley Regression fits a straight line through the data points and extrapolates the line to zero air mass. Outlying points are removed from the fit until the Delta ETC (or Delta V0) falls below the user sepecified Target Delta ETC value. The intercept at zero air mass is the Extra-Terrestrial Coefficient or ETC for O3 (also refered to as V0 or V-naught). The ETC value can then be applied in the calculation of ozone. |

|

Brewer UV Level 201 Spike Detection and Correction, Time DependentLong-term (2-year) analysis of UV spikes with relation to time. Negative-going and positive-going spikes in the UV spectra are detected and corrected using the Level 201 processing algorithms. The percentage of spikes in UV spectra are calculated for each week of the year. Green bars show the total number of UV scans performed during a given week. Blue bars show the number of spikes detected and corrected during a given week. Red bars show the percentage (or ratio) of spikes to scans for a given week. |

Brewer UV Level 201 Spike Detection and Correction, Wavelength DependentUV Spikes referenced to wavelength counts the number of positive and negative spikes that were detected and corrected at each of 154 wavelengths (286.5 - 3630.0 nm) during a calendar month . Each plot represents spike data (positive or negative) from a single Brewer for a single calendar month. The most recent months are leftmost on the page, with previous months progressing from left to right. Each row contains 12 monthly plots covering the latest year of data. In the example plot shown, eight out of twelve months are shown (to conserve space). Two instruments are represented, the top two rows of plots are positive and negative spike corrections (respectively) for the first Brewer. The third and fourth rows of plots are positive and negative spike corrections (respectively) for the next Brewer. Mouse-Over an image to display its instrument name and spike direction. |
Brewer Event Time SeriesA graphical time series of event markers depicting the starting time of the various Brewer sub-routines that writes data and/or comments into the B-Files, UV-Files, U-Files, Y-Files, and CI-Files. Event codes are shown on the left-side column. The bottom row of markers represents the aggregate of all the events. Event counts are shown on the right-side column. |

|
Daily Average Ozone or Sulfur Dioxide Time Series ComparisonsThis tool allows comparisons of different QC Levels of Daily Averaged Total Column Ozone or Sulfur Dioxide measurements from Brewers. Ozone data from OMI/OMPS instruments can be overlayed in ozone mode. Measurement values, averages, and standard deviation can be plotted for one or more instruments with specified QC levels. Difference and ratio of two different instruments with two different QC levels can be compared. |

|
B-File CommentsA query tool that allows B-File comments to be searched for various criteria such as USER comments, error or fault phrases, or specific types of events (brewer routines). Results can be filtered by event type, Brewer instrument ID, and time. |

|
Brewer Multi-Instrument DisplaysMulti-Instrument Display shows data from all instruments on a single page. Click on a thumbnail image to view a larger image. Available Brewer data types are described below. |

|
UV/UX Daily Scan SummaryDisplays a summary view of all the UX scans for a single day. Each point of the red trace represents the sum of the photon-counts of wavelengths below 325 nm within a single UX scan. Each point of the blue trace represents the sum of all the photon-counts of wavelengths above 325 nm within a single UX scan. The green trace is the dark counts measured at each UX scan. The Y-Axis Scale can be viewed as Linear or Logarithmic scales. |

|
Umkehr Scan Daily SummaryUmkehr measurements are performed by the Brewer during sunrise and sunset elevations between 90-70 solar zenith angle. Eight specific wave lengths are scanned; 306nm, 310nm, 313nm, 317nm, 319nm, 323nm, 326nm, and 329nm. Through further processing of these Umkehr data - vertical ozone profiles can be calculated. The left and right panels are sunrise and sunset, respectively. The top panels plot individual wavelengths. The center panel plots differences of sequential scans at 317nm and 319nm. The bottom panels display differences between 329-313nm, 326-310nm, and 323-306nm. |

|
Umkehr Ozone Vertical ProfileOzone vertical profiles derived from Umkehr scans. AM/PM profiles are plotted, if they exist. The higher resolution data are interpolated from the Solution Profiles. Good AM/PM profile sub-title text is color coded GREEN. Bad AM/PM profile sub-title text is color coded RED. AM/PM profiles are considered "good" if their iterations (Iter) < 4 and Residuals (Res) <= 1.0. The latency of these data should be one day. The oldest data available dates to approximately August 2006. Current versions of the Umkehr Ozone Vertical Profile data are generated using O3BUmkehr.exe, a program developed by Martin Stanek of chmi.cz in collaboration with Irina Petropavlovskikh of NOAA/CIRES. O3BUmehr.exe is Windows based software, the latest program is version 2.5 and is available for download from http://www.o3soft.eu/o3bumkehr.html. Version 2.5 provides R6 Correction for the re-calculation of Total Column Ozone. In version 2.5, we also apply our Ozone Level 300 Langley derived ETC (Extra-Terrestrial Constant) offset to the baseline ETC. |

|
Umkehr Derived Tropospheric Ozone Time SeriesDaily Average Tropospheric Ozone is derived from the lowest altitude of the Umkehr Ozone Solution Profile. AM/PM data are plotted as separate traces. Data from only 'good' [iterations < 4 and Residuals <= 1.0] profiles are used as points in this time series. The oldest data available dates to approximately August 2006. |
")
|
PS Scan Daily Time SeriesDaily time series of PS scan data contained in the brewer Y-Files. The photon counts at 320, 340, 360, 480, 510 and 540 nm are plotted against one another. The Y-Axis Scale can be viewed as Linear or Logarithmic scales. |

|
CI Reference Scan PlotCI Reference Scan plots data contained in the brewer CI-Files against a baseline reference CI Scan. Each Brewer has its own Baseline Reference CI Scan derived from CI scans taken shortly after all the Brewers were calibrated for Ozone in August of 2006. The top panel shows the actual CI scan data (red) and CI reference scan data (blue). The bottom panel shows the ratios of CI_cps / CI_ref at each wavelength (286.5-363.0 nm). |

|
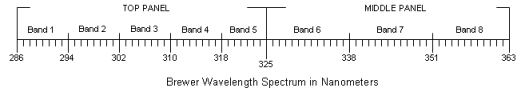
CI Banded Wavelength Ratios Time SeriesThis plot first takes the CI Scan data and calculates the ratios from the instrument's Baseline Reference CI Scan. Ratios are calculated by CI_cps/CI_ref. The CI scan ratios are then divided into wavelength segments or 'bands'. Ratios within each wavelength band are averaged to produce a single number. The ranges of the wavelength bands are defined in the figure below.
Each of the 5 traces in the top panel represent the average photon counts for bands 1-5 (286.5nm - 325nm). Each of the 3 traces in middle panel represent the average photon counts for bands 6-8 (325.5nm - 363nm). The bottom panel plots the internal temperature of the Brewer instrument at the time of the CI Scans. |

|
CI Ratio Multi-Day OverlayThis display plots the ratio of CI scan data compared to the instrument's Baseline Reference CI Scan. Ratios are calculated by CI_cps / CI_ref. Each trace on the plot represents one CI scan ratio for a single day. The intent of the plot is to evaluate how CI Scans are changing over time. The recommended time span for this plot is 7 to 30 days. |

|
Dark Count Summary Time SeriesDark Counts of the photo-multiplier tube are measured by various routines including; Direct Sun, Zenith Sky, UV/UX, CI, PS, and Umkehr. This summary plots all the dark counts against one another to identify abnormal dark count levels. |
|


|
DS/ZS/SL Raw Scan Data
The Brewer takes Direct Sun (DS), Zenith Sky (ZS), and Standard Lamp (SL) measurements in either O3 or NO2 modes. For DS measurements 5 scans are performed. For ZS and SL routines, 7 scans are performed. Raw Photon Counts, Wave Length Ratios, Filter Wheel #2 Position and Dark Count measurements are plotted.
|
|||||||||||||


DS/ZS/SL Raw Scan SummaryScan Summaries are the average of five Direct Sun (DS), seven Zenith Sky (ZS), or seven Standard Lamp (SL) raw scans. O3 and SO2 values, Single and Double Ratios, internal Brewer temperature, and Neutral Density Filter Positions are plotted.
|
|||||||||||||


HG Calibration DataIn order to maintain accurate UV and O3 reading through out the day, the Brewer must take several scans of its internal Mercury Lamp (HG) to compensate for temperature changes. |

|
Aggregate TemperaturesMany of the Brewers sub-routines measure temperatures inside the Brewer's enclosure. The aggregate temperature plot displays all these discrete temperature measurements as a unified time series. If the Brewer is equipped with an internal humidity sensor, these data are also plotted. |

|
Ozone QC Level 200 Diagnostic
This plot compares the differences between Level 100 ozone with Level 101 ozone
and Level 200 ozone. Level 100 ozone are calculated using the Brewer's internal
processing an algorithms. Level 101 Ozone uses external processing to recreate the
Brewer's algorithms. Level 101 data can be slightly different from Level 100 data due to
insufficient soundings, rounding errors, and the fact the the external processing does not having access to
the exact air mass values used by the Brewer's internal processing. |

|
R5,R6,SL Daily AveragesThis plot is a modified version of the SL Avg Plot (shown below), giving more resolution to the R5 and R6 values. The Standard Lamp (SL) intensity (photon counts) are plotted in the middle panel. The Brewer's internal Halogen lamp voltage and current values are plotted in the bottom panel. |

|
SL Daily AveragesThe Standard Lamp (SL) Average plot displays data contained in the brewer SLOAVG.nnn and SLNAVG.nnn files. The values of R5, R6, and the photon counts of the Brewer's internal Halogen Lamp are plotted in the top panel. The Brewer's internal Halogen lamp voltage and current values are plotted in the bottom panel. |

|
RS Daily AveragesRun/Stop (RS) measurements are used to determine the timing-cycle of the Brewer's Slit-Mask Motor. The Run/Stop (RS) Average plot displays data contained in the brewer RSOAVG.nnn and RSNAVG.nnn files. Enable plot auto-scaling to view the peak values. Disable auto-scaling to view a constrained view identifying the expected max/min thresholds for the Run/Stop test. |

|
DT Daily Averages
Deadtime (DT) is a measurement of the amount of time it takes the Brewer's Photo Multiplier Tube (PMT) to recover after counting a photon. The Deadtime (DT) Average plot displays data contained in the brewer DTOAVG.nnn file. |

|
AP Average DataAP Average data plot provides voltage, current, temperature and humidity measurements collected by the Brewer several times over the course of the day. These data are primarily used for diagnostic and monitoring purposes. |

|
AP Average (Voltage Only) DataAP Average data focusing on internal Brewer power supply voltages. This display provides greater resolution of supply voltage levels. These data are primarily used for diagnostic and monitoring purposes. |

|
DUV Daily Averages
Daily averaged UV value weighted by Diffey Weighting Function. |

|