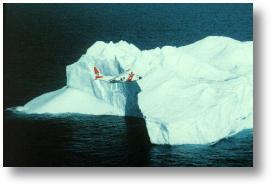
A U.S. Coast Guard C-130 on ice patrol.
|
Sea Ice and Iceberg Detection by SLAR
In cooperation with the U.S. Coast Guard, ETL installed its RADS (Radar
Acquisition and Display System) on an HC-130H aircraft as a demonstration
for
International Ice Patrol
personnel. RADS was slaved to, and operated in parallel with, the existing
data system which used dry film technology to record its images.
The radar used was the Coast Guard's AN/APS-135 X-band
Side-Looking Airborne
Radar (SLAR).
In February 2000 the system was flown off the coast of Newfoundland and
produced the real-time images presented here. These images are screen
dumps done by the operators on the plane and have not been altered or
enhanced in any way.
|
|
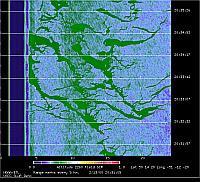
Figure 1. Light blue sea ice with open water displayed in green.
|
|
|
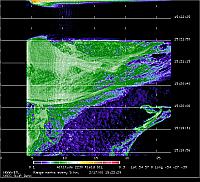
Figure 2. Black and blue areas indicate open water while sea ice
appears as green.
|
|
|
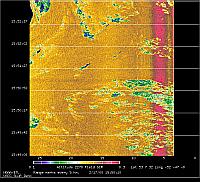
Figure 3. Icebergs moving through sea ice.
|
Reading an Image
The images are snapshots of what the operator sees on the aircraft. New data
enters the image at the top, scrolls down and eventually falls off the
bottom of the screen.
The color of the images represents the strength of the radar echo per the
color bar at the bottom, with weaker echoes being represented by blues and
greens and stronger echoes by oranges and reds. In addition very strong
echoes, those that go off the top of the red scale, are painted as black.
The fact that these particular images tend to show open water as blue or
green is only a coincidence, and cannot be relied upon in general, since
the radar return from water is highly dependant on the sea state.
The scale at the bottom is the range in kilometers, looking out one side of
the aircraft. Whether it is the left or right side can be discerned by
whether the zero range point is on the left or right side of the image.
There is a blind spot from about 0 to 3 km, and there may be artifacts in
the image here. Along one side of the image is the time in GMT, which
indicates that these images took about 3-4 minutes to acquire. Other
information included is the latitude and longitude of the aircraft at the
current time, which is the zero range point at the top of the image.
Sea Ice Images
The (mostly) blue areas in Figure 1 represent
sea ice (ice resulting
from the freezing of sea water), with the green areas representing open water.
In Figure 2, the black and dark blue areas are open water,
and the green area is sea ice. The wavy lines parallel to the aircraft's
motion are an artifact and caused by small variations in the plane's
attitude. The image ends abruptly at the 15:21:50 time mark when the
aircraft banked to make a turn.
Iceberg Image
In Figure 3, the sea is mostly covered in sea ice (yellow, orange and red)
but icebergs, driven more by undersea currents than the wind, have opened up
leads (channels) in the ice field. Here the open water is mostly blue or
green. If you look between the 15:51:27 and 15:52:02 time marks, you will
see leads with black dots in the middle, or at the upper right, which
represent the icebergs (some icebergs show as deep red). There is also an
iceberg in the middle of the image right on the 15:52:37 time mark.
Technical Details
The AN/APS-135 radar operates at 9250 MHz and has a pulse width of 200 ns,
which gives a 30-meter resolution. This is a simple non-Doppler radar.
RADS is normally used on Doppler radars with polarization diversity. The
images were produced from 768 range gates spaced at 200 ns.
|