2023 News & Events
CalFiDE: Observing Large-Scale Fires from the Air and the Road
22 August 2023
adapted from American Meteorological Society (AMS)
A Research Spotlight from the AMS 14th Annual Fire and Forest Meteorology Symposium, 2–4 May 2023
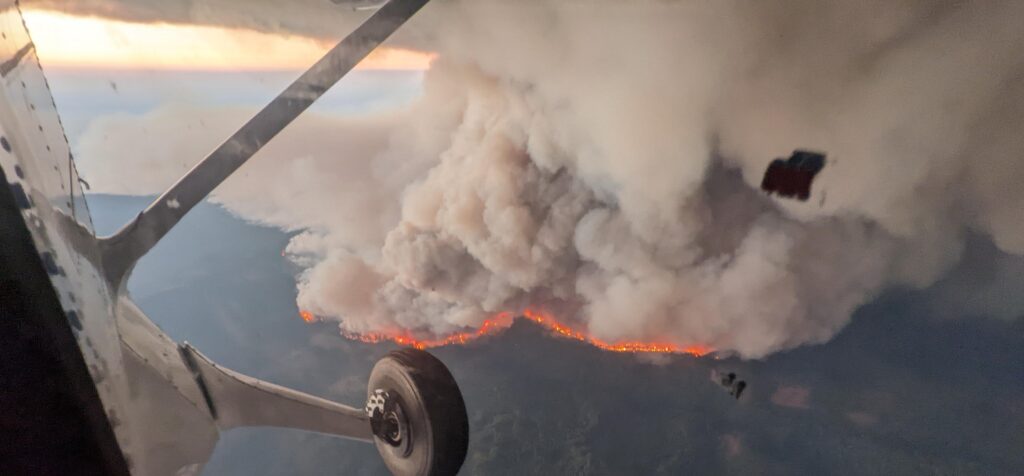
Through the smoke of record-setting Canadian wildfires – which continue to burn millions of acres in the north – the importance of understanding huge, landscape-scale fires has never been clearer. In a 4 May presentation in the ninth session of the 14th Fire and Forest Meteorology Symposium, Brian Carroll discussed recent efforts to gather scientific observations on these types of landscape-scale wildfires in California and Oregon through CalFiDE, the California Fire Dynamics Experiment. His team looked at the behaviors of these fires and the winds they create and interact with, as well as the impacts of smoke plumes on air quality.
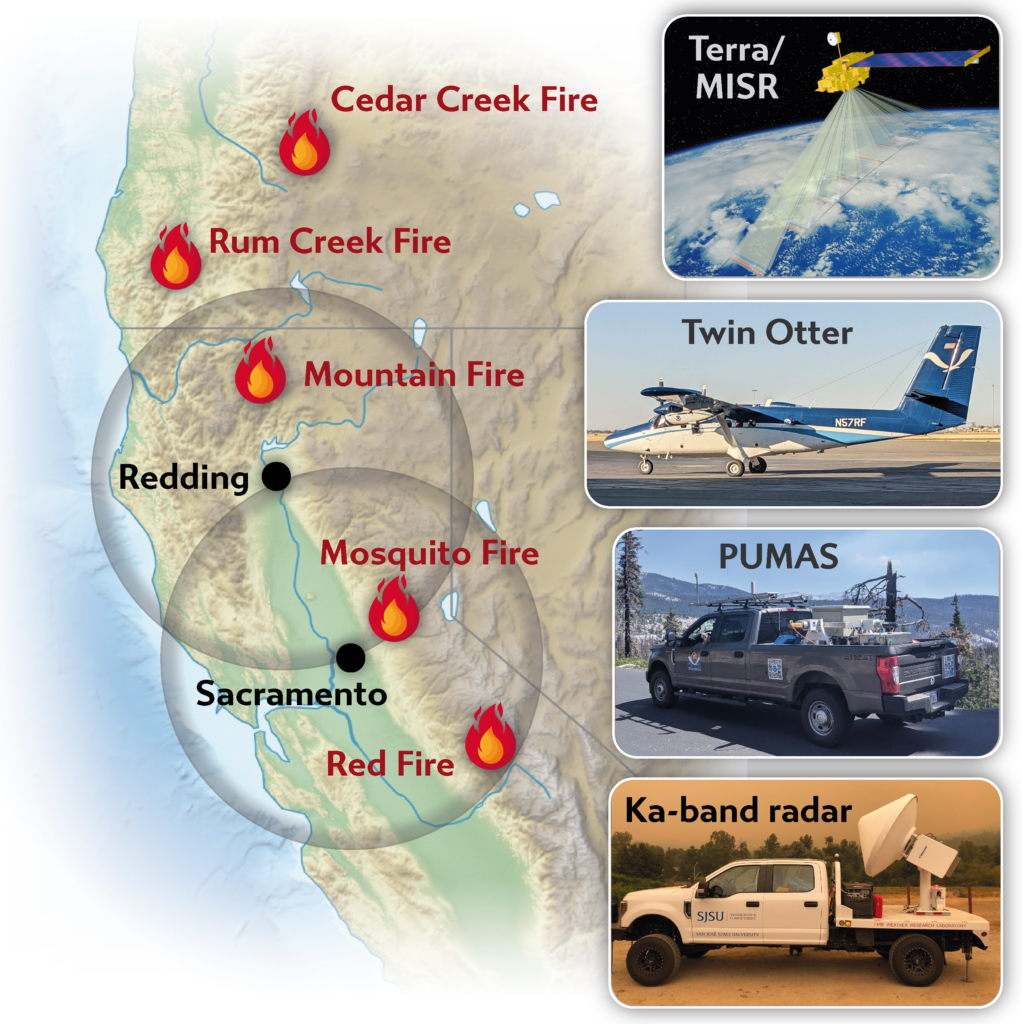
Field observations of wildfires this large are very rare. The CalFiDE team (including scientists from NOAA, CIRES, San Jose State University, the University of Nevada Reno, and NASA) used airborne and ground-based vehicles and a satellite to take measurements of five fires in August–September 2022. That included the Mosquito Fire, the largest in California that year, which burned more than 76,000 acres and prompted evacuation orders for 11,000 people.
Carroll described the difficult and potentially dangerous process of conducting continuous observations of huge fires, without getting in the way of firefighters and emergency managers.
"There's an aircraft exclusion zone that's dedicated for the firefighters," he notes. "The pilots have that information and avoid those areas but the pilots' own decisions to keep our aircraft safe against the strong fire-generated winds and smoke are also a big driver. Even at a safe distance from the strong updraft produced by the fire, the wind convergence into the smoke column had to be compensated for by angling the plane away."
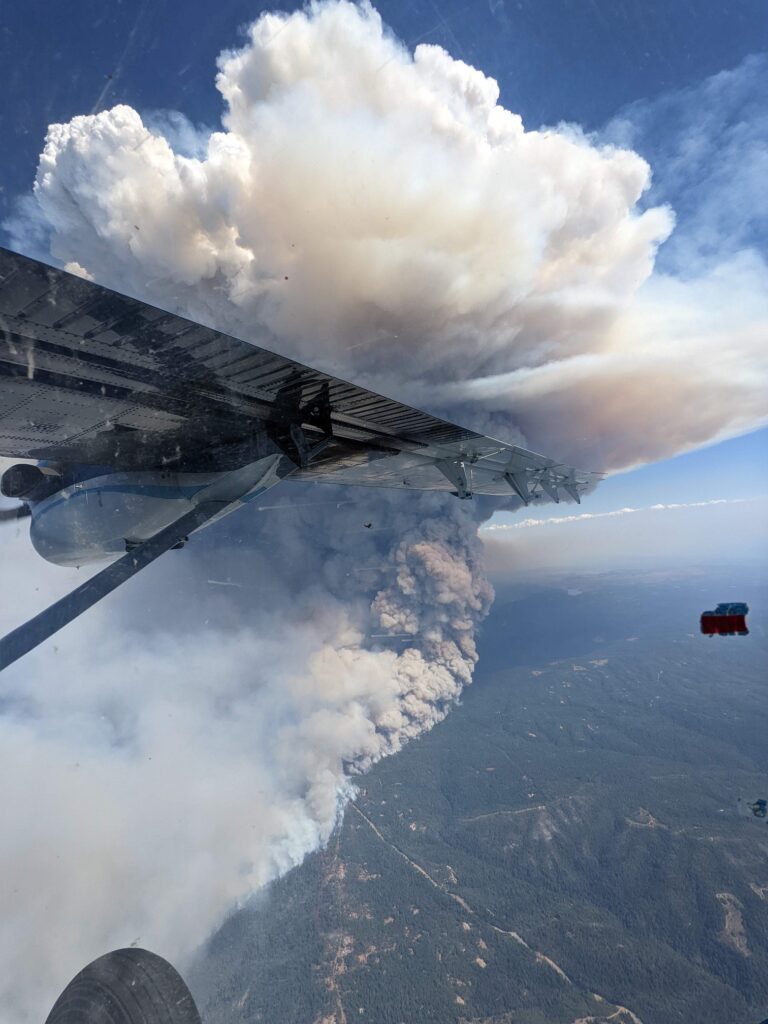
They were aided by state-of-the-art mobile Doppler lidar systems that allowed them to map air and fire behaviors over large distances in complicated terrain. "There are few lidars in the world capable of making these wind measurements while moving, and that mobility is important when dealing with wildfires that are constantly evolving," Carroll says. "The lidars also provide real-time information on the winds and location of smoke layers, and we use that information to optimize sampling patterns and target layers for sampling trace gases."
The CalFiDE team conducted surveys with a NOAA Twin Otter airplane, using Doppler lidar, infrared imaging, and trace gas measurements. They also drove an instrumented pickup truck (known as PUMAS, the Pick-Up-based Mobile Atmospheric Sounder) on the outskirts of the fire with additional Doppler lidar and temperature measurements, getting a 3-D picture of the winds above the truck as they drove. Meanwhile, the Multi-angle Imaging SpectroRadiometer (MISR) instrument aboard NASA's Terra satellite provided a broad swath of smoke distribution information from space.
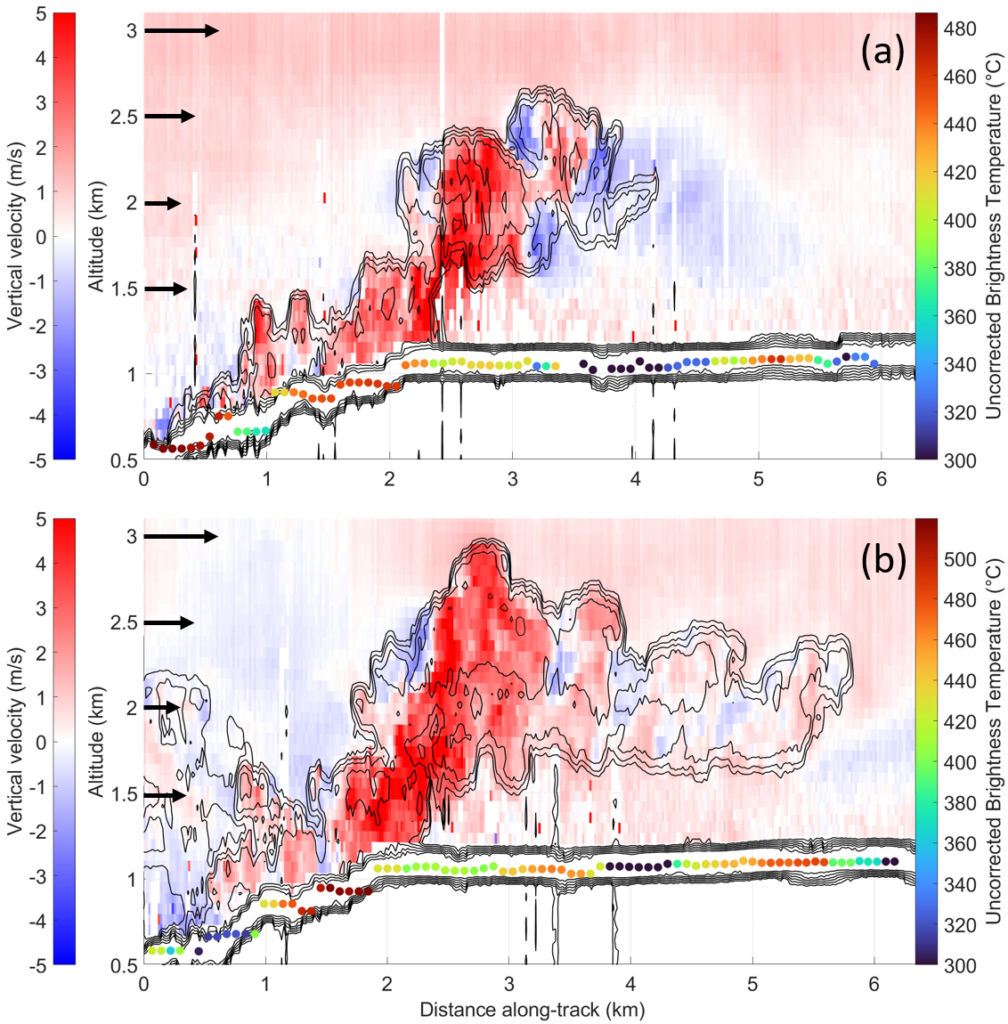
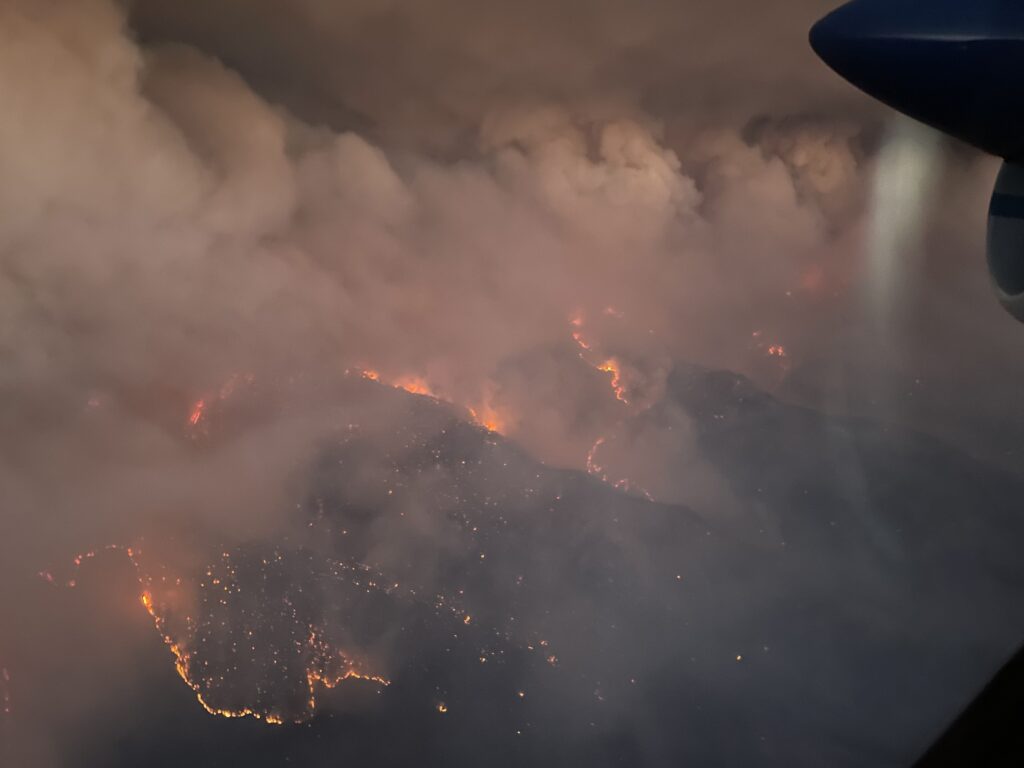
The airborne lidar provided cross-sections of fire updraft cores (areas of hot, rising air) and smoke plume motions, complemented by the infrared imagery capturing the fire's shape and evolving intensity. These are some of the first measurements of their kind, and will provide important ground-truth comparisons for fire and air quality modeling.
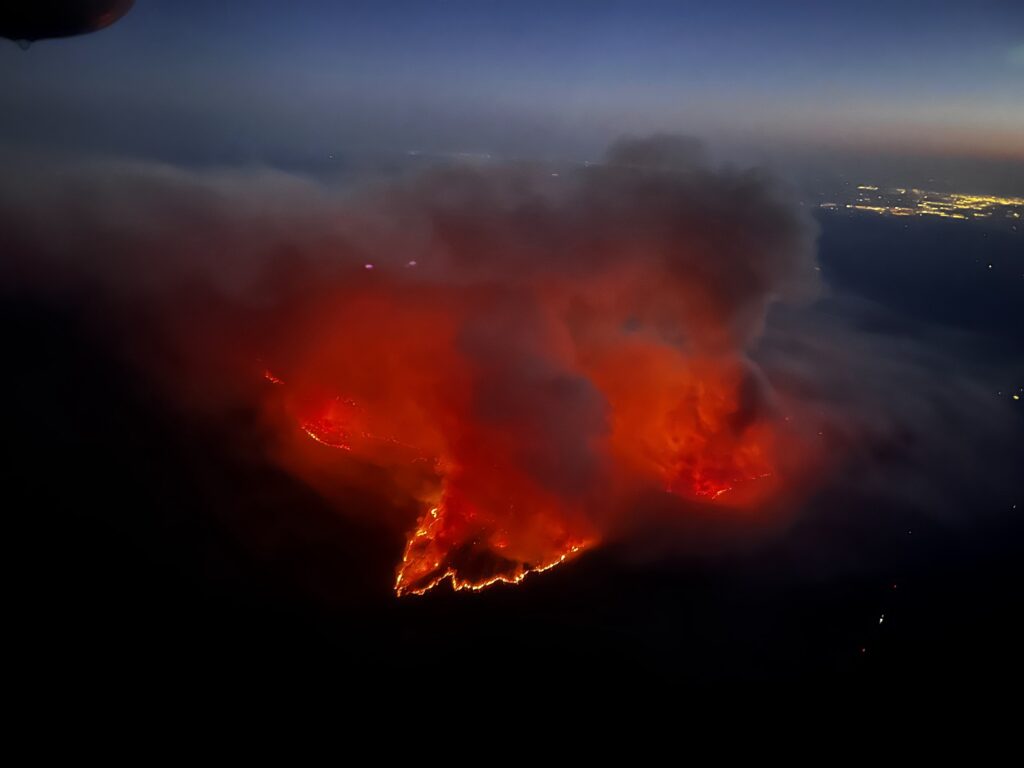
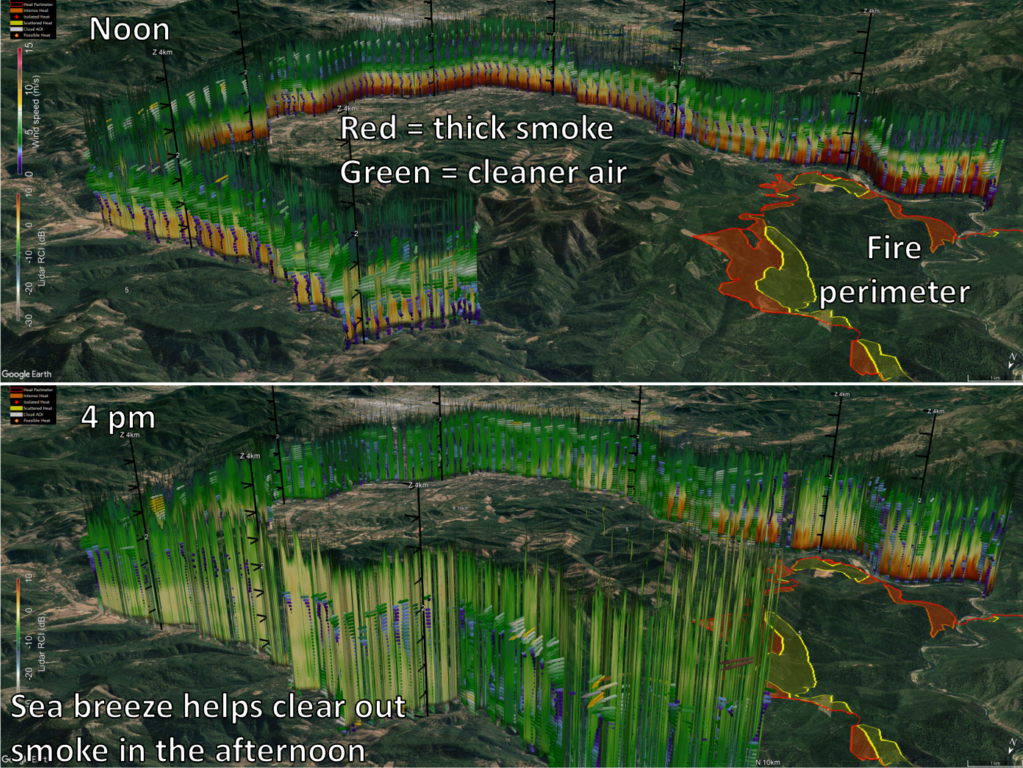
PUMAS observations also allowed the team to generate a high-resolution picture of smoke behavior in nearby areas—for example, the ways smoke lingered in valleys during calm conditions, and how rapidly air quality improved when sea breezes disrupted the smoke layer.
"Driving around these local valleys, in a few kilometers you could have a huge change in how much smoke there was, and a large change in temperature. And there's a major change in boundary layer dynamics as you move in and out of those regions." said Brian Carroll, a Cooperative Institute for Research in Environmental Sciences (CIRES) scientist working in the NOAA Chemical Sciences Laboratory (CSL) Atmospheric Remote Sensing research program.
"The West Coast of the United States has experienced terrible fire seasons recently, with smoke impacting the lives of millions and fires themselves displacing many others. People across the U.S. and Canada have gained additional insight this year into what that's like. We need more comprehensive information about how these fires grow, how the smoke moves, and the atmospheric conditions that interact with the fires, as we face a future that will likely see even more extreme fire seasons. The CalFiDE team's efforts will help meet those needs," Carroll says.
This project was partially funded by FY22 Disaster Relief Supplemental Appropriations (DRSA). An article providing an overview of CalFiDE was published in the Bulletin of the American Meteorological Society.
Carroll, B.J., W.A. Brewer, E. Strobach, N. Lareau, S.S. Brown, M.M. Valero, A. Kochanski, C.B. Clements, R. Kahn, K.T. Junghenn Noyes, A. Makowiecki, M.W. Holloway, M. Zucker, K. Clough, J. Drucker, K. Zuraski, J. Peischl, B. McCarty, R. Marchbanks, S. Sandberg, S. Baidar, Y.L. Pichugina, R.M. Banta, A. Klofas, B. Winters, and T. Salas, Measuring coupled fire-atmosphere dynamics: The California Fire Dynamics Experiment (CalFiDE), Bulletin of the American Meteorological Society, submitted, 2023.
Abstract
The social, economic, and ecological impacts of wildfires are increasing over much of the U.S. and globally partially due to changing climate and build-up of fuels from past forest management practices. This creates a need to improve coupled fire-atmosphere forecast models. However, model performance is difficult to evaluate due to scarcity of observations for many key fire-atmosphere interactions, including updrafts and plume injection height, plume entrainment processes, fire intensity and rate-of-spread, and plume chemistry. Intensive observations of such fire-atmosphere interactions during active wildfires are rare due to the logistical challenges and scales involved. The California Fire Dynamics Experiment (CalFiDE) was designed to address these observational needs, using Doppler lidars, high-resolution multispectral imaging, in-situ air quality instruments, Doppler radar, and other instrumentation on a NOAA Twin Otter research aircraft and multiple gr ound-based mobile platforms. Five wildfires were studied across northern California and southern Oregon over 16 flight days from 28 August to 25 September 2022, including a breadth of fire stages from large blow-up days to smoldering air quality observations. Missions were designed to optimize the observation of the spatial structure and temporal evolution of each fire from early afternoon until sunset during multiple consecutive days. The coordination of the mobile platforms enabled four-dimensional sampling strategies during CalFiDE that will improve understanding of fire-atmosphere dynamics, aiding in model development and prediction capability. Satellite observations contributed aerosol measurements and regional context. This article summarizes the scientific objectives, platforms and instruments deployed, coordinated sampling strategies, and presents first results.