
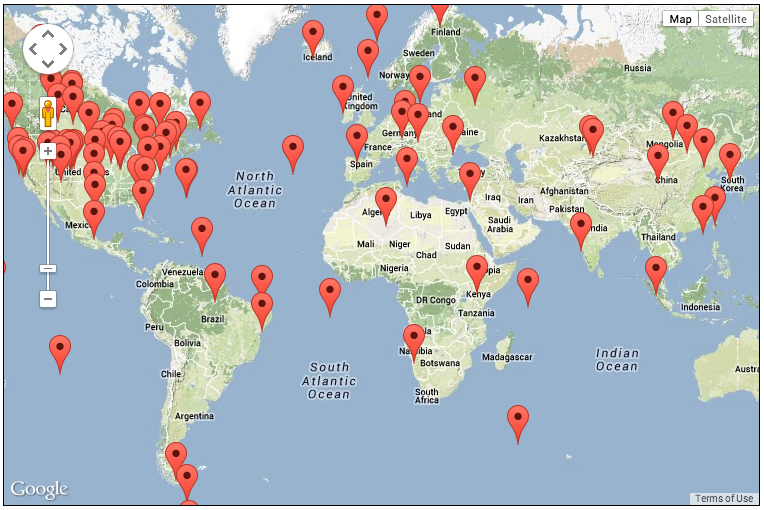
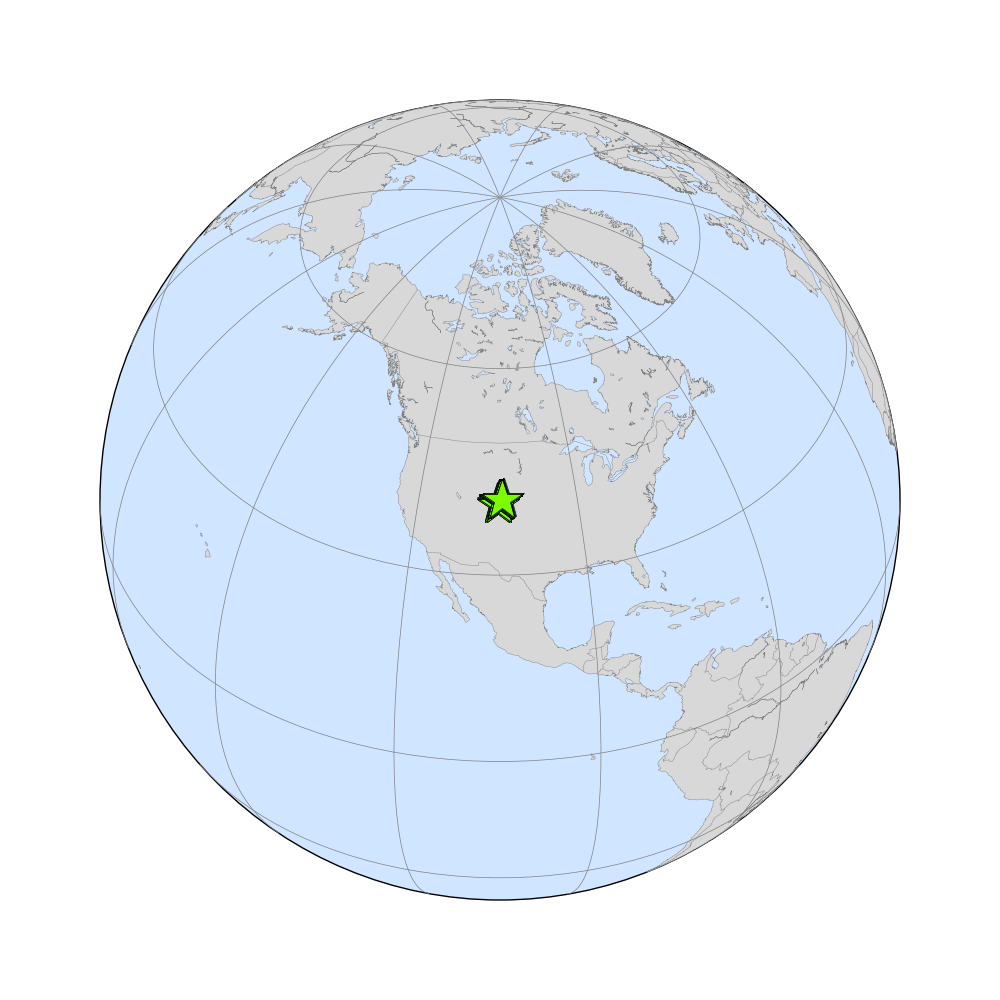
| Site Latitude | |||
| Site Longitude | |||
| Site Elevation | |||
| Site code | |||
| Dataset | co2_car_aircraft-pfp_1_allvalid_3000-4000masl (GLOBALVIEW identifier ) | ||
| Assimilated | Yes, but showing unassimilated subset Switch to assimilated subset | ||
| Selection scheme | |||
| Data provider | |||
| Laboratory | |||
| Download these data via ObsPack. | |||
(b) The time series of model residuals--the difference between the simulated and measured mole fractions--shown with dark green filled circles. These residuals should be uncorrelated in time, unbiased (i.e., have a mean of zero), and distributed normally. (c) Summary statistics for model residuals from to . Residuals are defined as simluated values minus observed values. "Bias" is the mean of the residuals; "std. dev." is the standard deviation, and RMSE is root-mean-square error. All quantities are in ppm of CO2. The time period over which these quantities are computed is set by the graphs (a) and (b).