RADIATIVE AND UV-B EFFECTS OF OZONE CHANGES
Greenhouse effect
Both ozone and halocarbons are "greenhouse gases". Much like carbon dioxide (CO2), they intercept and re- radiate the Earth's outgoing infrared radiation, thereby helping to warm the lower atmosphere. However, neither ozone nor its changes are uniformly distributed, thus its radiative forcing (see box) is more complicated than those of the other principal greenhouse gases which have a long life span permitting even mixing. In general, adding ozone in the troposphere especially near the tropopause causes warming; reducing ozone in the stratosphere causes cooling. Some small temperature decline (0.6°- 0.8°) in the 12-20 km layer during the past two decades seems to be consistent with expected radiative impacts of stratospheric ozone decrease.
An accurate assessment of the radiative effect of ozone changes is limited by the lack of detailed information on the variation in vertical distribution of ozone with latitude and longitude. However, recent calculations support earlier conclusions that lower stratospheric ozone depletion in recent decades has resulted in a negative radiative forcing (i.e. a cooling effect on the climate) and has offset, by about 15-20%, the positive greenhouse forcing due to increases in other gases. The increase of tropospheric ozone since pre- industrial times may have enhanced the total greenhouse forcing by as much as 20%. Such changes could have an impact on the radiative balance of the earth- atmosphere system and the thermal structure of the atmosphere and thus cause as yet unpredictable changes to atmospheric circulation patterns.
|
OZONE AND RADIATIVE FORCING |
 |
|
To characterize a potential for climatic effects, "radiative forcing" (in units of Wm-2) is frequently used. Its estimations are based on net solar and thermal infrared radiance at the tropopause, and are not greatly dependent on uncertainties, such as the combined interactive role of clouds, aerosols or oceans. in predicting surface climate change. A positive value signifies increased energy retention, producing warming; a negative value implies greater energy loss, ie. cooling.
The net global mean radiative forcing arising from ozone changes is likely to have been positive since pre-industrial time, contributing about 20% of all the greenhouse- gas - caused increase of radiative forcing in that period.
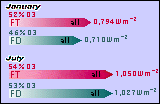
An example of the major contribution of ozone change to the total radiative forcing by all major greenhouse gases (CO2, CH4, N2O CFCs, O3) from 1971-1980 to 1981-1990 over the northern mid- latitudes, using ozone soundings at Hohenpeissenberg, is shown above. Calculations for two different modelling assumptions, fixed temperature (FT) and fixed dynamical heating (FD), show that ozone changes were responsible for nearly half of the radiative forcing under the given modelling treatment. (Wang el al., GRL 1993) |
|
Ultra-violet radiation
The life-protecting role of atmospheric ozone stems from its ability to absorb dangerous ultraviolet radiation with wavelengths shorter than 320 nm. The small amount of UV-B that does manage to penetrate through the ozone shield could cause considerable harm to human health, including eye cataracts, an increase of non- melanoma skin cancers, damage to genetic DNA, and suppression of the efficiency of the immune system.
Under cloudless conditions, each 1% reduction in ozone results in an increase of about 1.3% in the UV- B which affects skin tissue reaching the surface of the earth. The total ozone decline so far has resulted in a small increase in UV-B (280 to 320 nm) reaching the ground except over the tropical belt. Further ozone decline could have considerable harmful consequences, not only to humans but to other life forms and tropospheric chemistry. Crops and the aquatic ecosystem, including ocean plankton, could be damaged with yet unforeseen consequences. Some effects are largely a function of overall dose, while others depend upon reaching a given cumulative threshold. The Impact Assessment Panel is estimating that a sustained 1% decrease in total ozone will result in an increase in nonmelanoma skin cancers of approximately 2%.
In addition, marine phytoplankton are a major sink for CO2 and any UV-B effect on them could have a role in future CO2 trends and consequently on climate. The UV-B increase will result in higher photodissociation rates of key trace gases that control the chemical processes in the troposphere.
Given that long-term, precise UV-B measurements are insufficient, and that the intensity of the radiation measured at the ground depends on the cloud cover, albedo, aerosol and the presence of SO2, the inverse correlation between UV-B intensity and the total ozone amount is well established.
Over those parts of the globe where the ozone changes are most severe, i.e. under the ozone hole, the increase of the UV-B is well documented. The maximum UV-B levels at the South Pole are reached in October - well before the summer solstice, and DNA-damaging radiation at Palmer station (64°S) during October can exceed the maximum summer values measured at San Diego (32°N). At mid- latitudes the UV-B increase is smaller but well evident during low ozone periods. For example, the ozone decline of about 15% observed at the most southern tip of South America during October of the past 15 years has caused an average increase of UV-B reaching the ground of 85% at around 300 nm and 35% at around 305 nm wavelengths. During the ozone hole expansion over Ushuaia in mid-October 1994 the intensity of the short UV-B wavelengths, around 300 nm, increased five times and the 305nm twice compared to "normal" ozone conditions (Figure 18). It was, to a great extent, the prospects of continuous increase of UV-B which prompted the international community to take regulatory action in the 1980s as described in the next chapter.
|
|

|
