The Twentieth Century Reanalysis Project
About
Using a state-of-the-art data assimilation system and surface pressure observations, the NOAA-CIRES-DOE Twentieth Century Reanalysis (20CR) project has generated a four-dimensional global atmospheric dataset of weather spanning 1836 to 2015 to place current atmospheric circulation patterns into a historical perspective.
20th Century Reanalysis and PSL
Four-dimensional historic weather reconstructions, or reanalyses, provide a crucial instrument-based link between long paleoclimate reconstructions and climate model forecasts. But until recently, the earliest reanalyses began with the year 1948, leaving out many important 20th century climate events, such as the 1930’s Dust Bowl.
To expand the coverage of global gridded reanalyses, the 20th Century Reanalysis Project is an effort led by NOAA's Physical Sciences Laboratory (PSL) and CIRES at the University of Colorado, supported by the Department of Energy, to produce reanalysis datasets spanning the entire 20th century and much of the 19th century. These reanalyses assimilate only surface observations of synoptic pressure into NOAA’s Global Forecast System and prescribe sea surface temperature and sea ice distribution in order to estimate e.g., temperature, pressure, winds, moisture, solar radiation and clouds, from the surface to the top of the atmosphere throughout the 19th and 20th centuries.
20CR uses an ensemble filter data assimilation method which directly estimates the most likely state of the global atmosphere for each three-hour period, and also estimates uncertainty in that analysis. The most recent version of this reanalysis, V3, provides 8-times daily estimates of global tropospheric variability across 75 km grids, spanning 1836 to 2015 (with an experimental extension from 1806 to 1835.) There are three previous versions of the reanalysis: V1, V2, and V2c.
The project has greatly benefited from international cooperation under the Atmospheric Circulation Reconstructions over the Earth (ACRE) initiative, which undertakes and facilitates the recovery of historical instrumental surface terrestrial and marine global weather observations to underpin 4D weather reconstructions spanning the last 200 to 250 years. Additional support has been provided by the Global Climate Observing System and the World Climate Research Programme.
- Version 3 covers 1836-2015 Available from PSL
- Version V2c covers 1851-2012 (experimental 2013-2014 extension) Available from PSL
- Version V2 covers 1871-2012 Available from PSL
- Version V1 covers 1908-1958 Available from NCAR
Recreating the Great California Flood of 1862 — A Case Study
Background
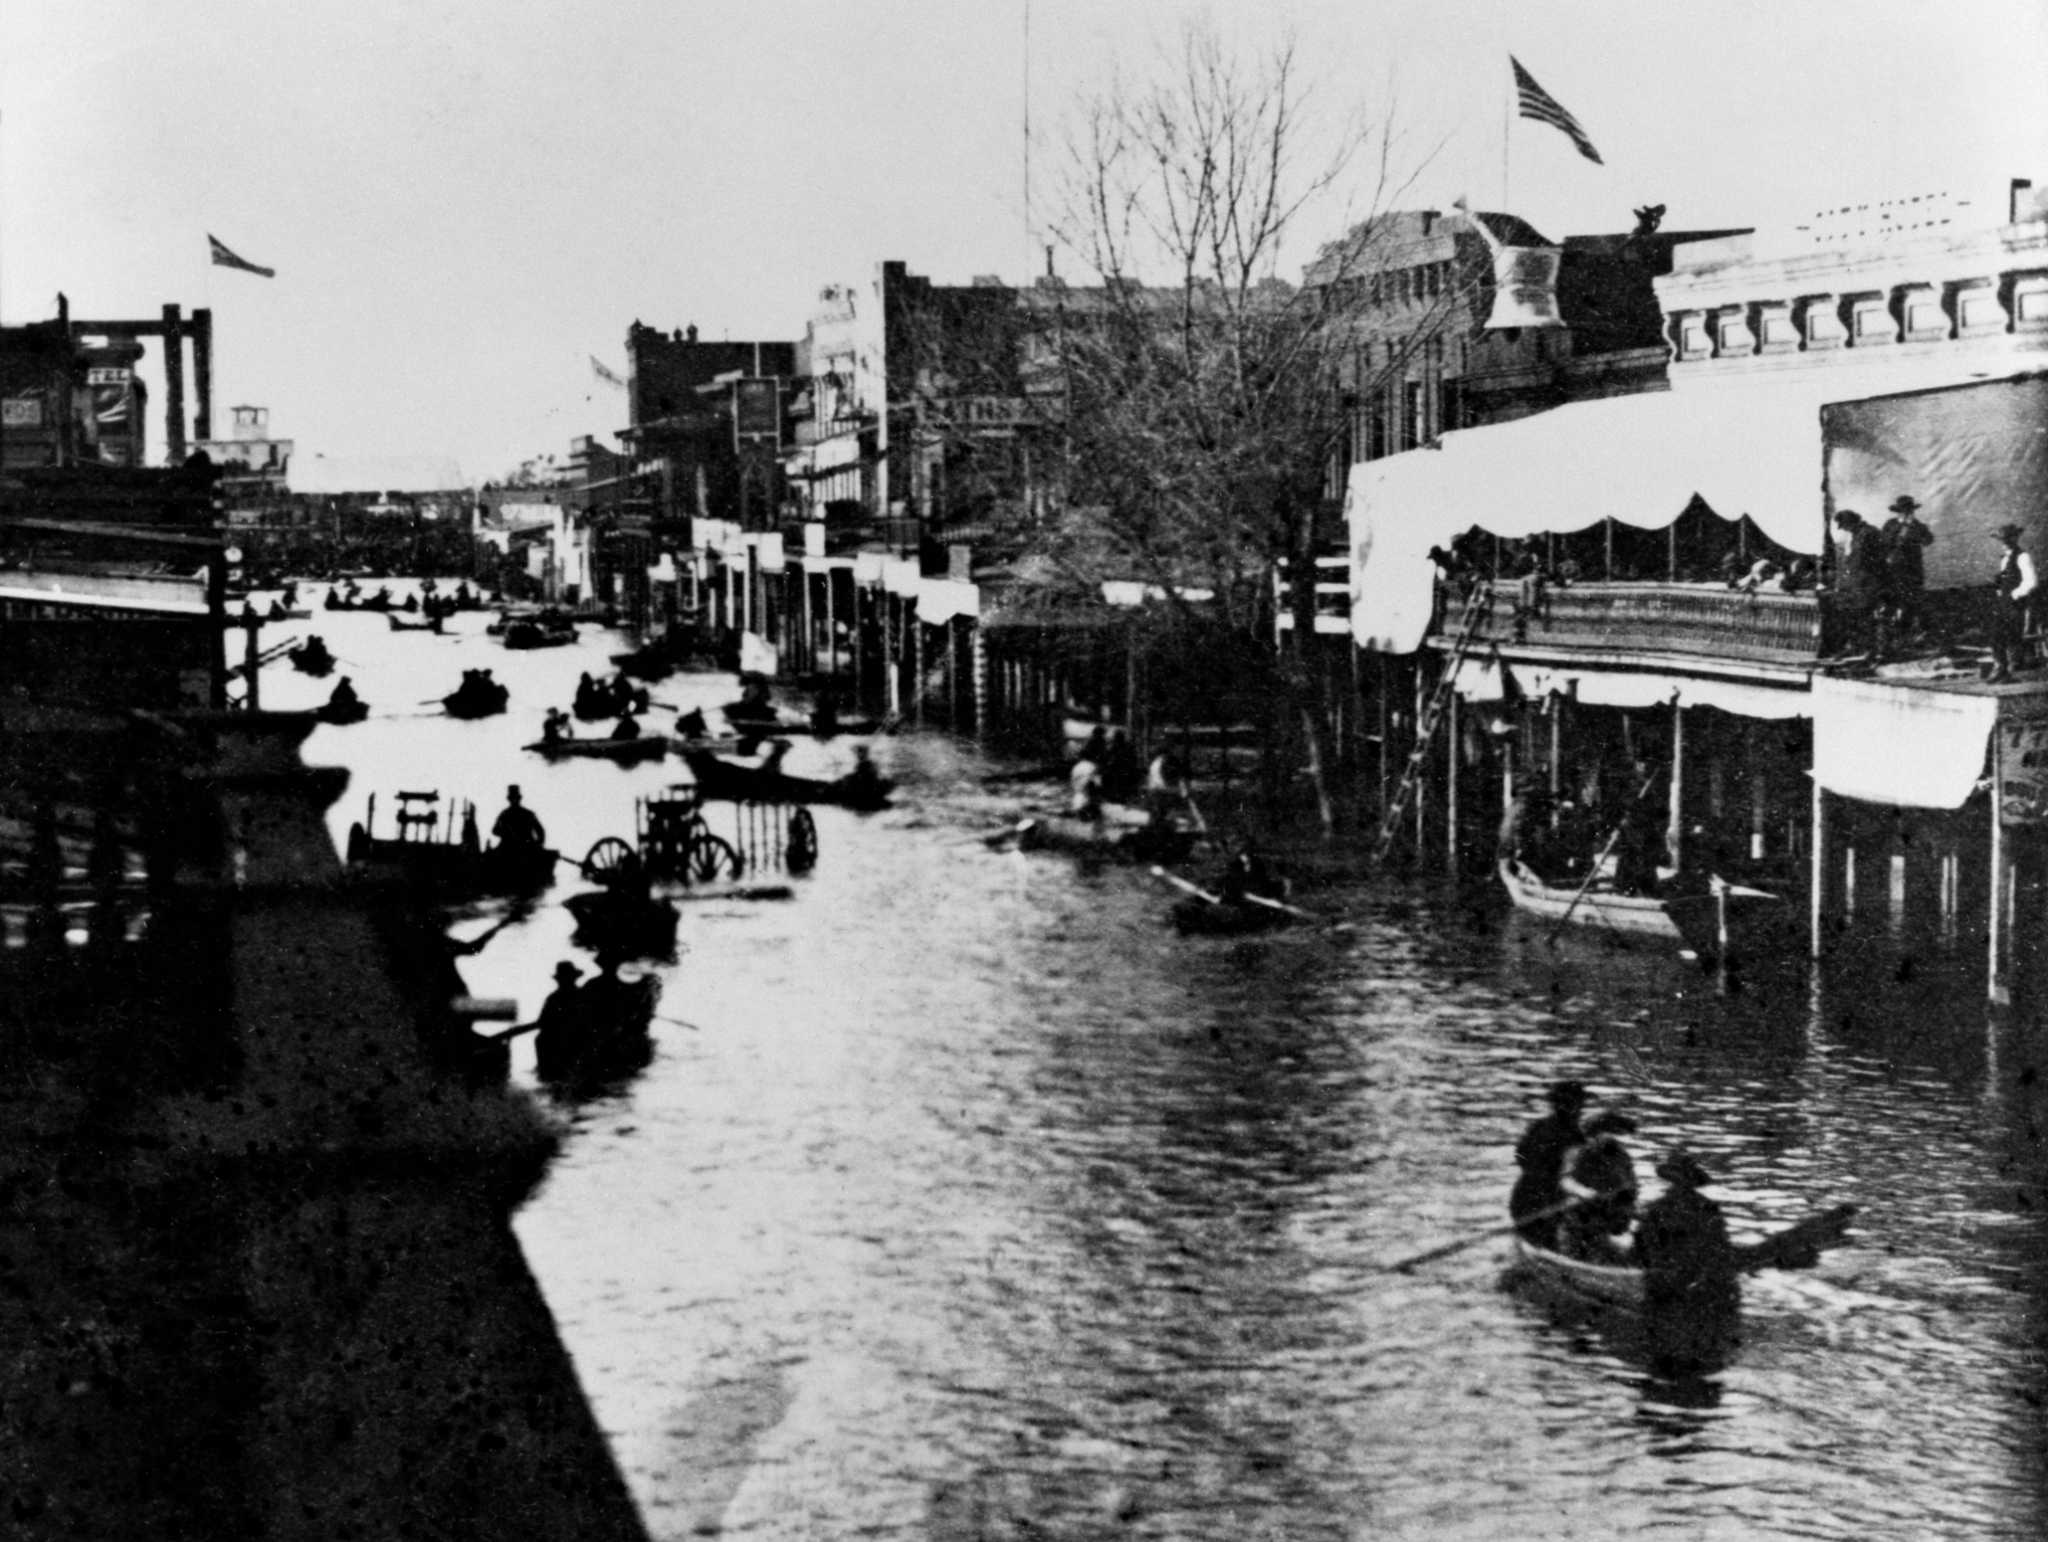
9 December 1861 – 20 January 1962 — The Great Flood of 1862 dropped a record-setting amount of rain along the U.S. West Coast from December 1861 through January 1862. While the flooding affected Washington and Oregon, California was hit especially hard. San Francisco and Sacramento, CA recorded 34 and 37 inches of rain respectively over the course of two months. The flooding was exacerbated by warm rainfall in the mountains, causing significant snow melt to flow into communities. Sacramento's streets and sidewalks were under water, and farms within the Central Valley were completely flooded. This prompted Sacramento to improve their levee system and begin a significant effort to raise the city above flood level. Ultimately, the floods were estimated to have cost at least 4,000 lives and $50-100 million (approximately $3 billion today). Recently, scientists have hypothesized that these floods were not due to an El Niño event, but rather the result of several atmospheric rivers repeatedly aiming at California.(References: Wikipedia and "California Washed Away: The Great Flood of 1862")
Reconstruction of Conditions
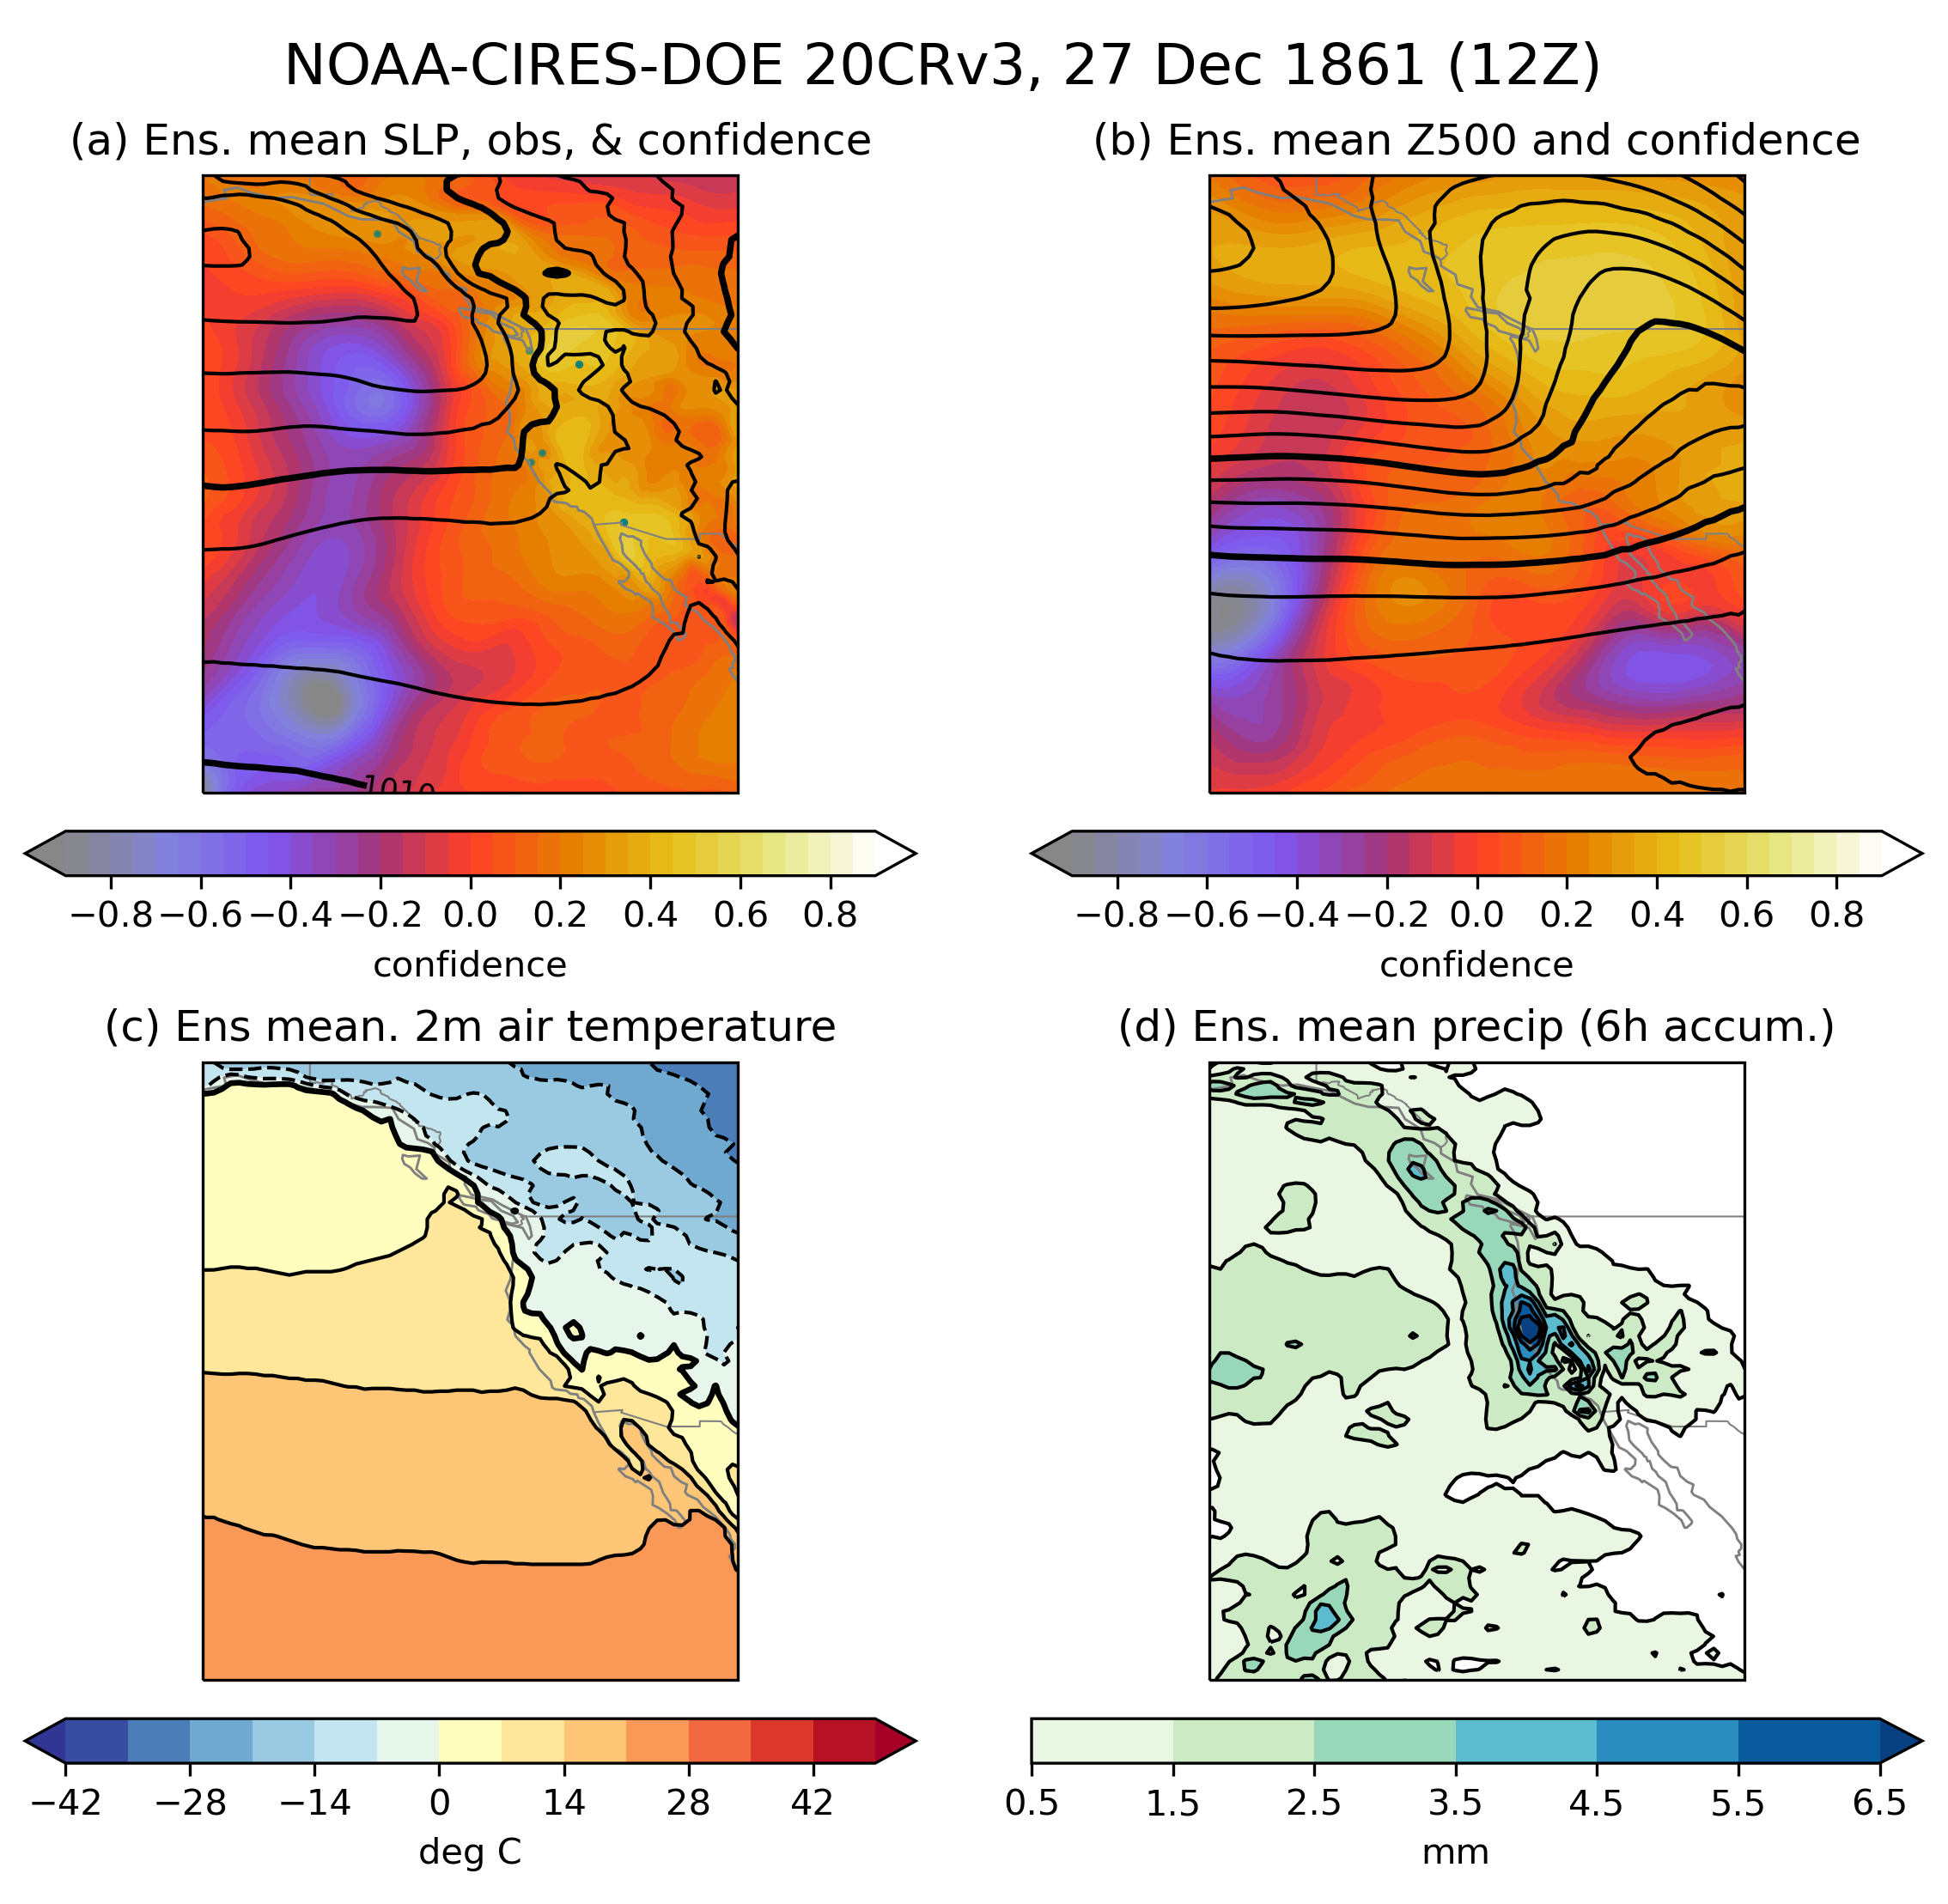
This four-panel plot shows weather conditions during the Great Flood of 1862, as reconstructed by the NOAA-CIRES-DOE 20th Century Reanalysis Version 3. Panel (a) includes the best estimate of sea level pressure (contours), observation locations (filled circles), and sea level pressure confidence (shading); Panel (b) includes the best estimate for geopotential heights at 500 hPa (a variable commonly used by forecasters to understand large-scale weather patterns) and its confidence field; Panel (c) shows the best estimate for 2m air temperatures; and Panel (d) shows the best estimate for precipitation accumulated over 6 hours prior to 12Z (4am PST) on 27 December 1861. “Confidence” measures uncertainty in the best estimate: smaller values refer to less confidence (more uncertainty) and higher values refer to more confidence (less uncertainty). (See doi:10.1002/qj.3598 for more details.)
Click plot to enlarge
PSL Animations from 20CRV3 Dataset 9 Dec 1861 to 21 Jan 1862
Precipitable Water Accumulated PrecipitationRelated Links
- The weather of 1861 and 1862 in 20CR version 3 (Credit: Philip Brohan, UK Met Office)
Check Out Another Case Study
The Great Blizzard of 1888Plotting and Analysis Tools
Use the tools below to plot 20th Century Reanalysis Data. Additional tools will be forthcoming.
Maps and Cross-Sections
Time-series Plots and Analysis
Other Products
Access Data and Animations
From PSL
- FTP: Data is available via anonymous ftp. For specific details, see the V3 data documentation. Go to "pressure, single level, isentropic, or height above surface" links and there is a list of variables for each type. Or, go to "search and plot" and search for dataset NOAA/CIRES/DOE 20th Century Reanalysis Version 3 and the variable(s) you would like. Additional ftp help is also available.
- Links to data documentation for V2c and V2 are also available.
- OPeNDAP: Data can be read directly via OPEnDAP. See the data documentation: File naming, OPeNDAP name from the data documentation webpage. We also have help on OPeNDAP and the applications that use it (GrADS, NCL...).
- Climate Indices: A selection of precalculated atmospheric climate indices such as the PNA and the SOI are available for 20CRV3. The main climate index web page links to the data in several formats, a short description, illustrative patterns, and the code that created the different indices.
- Dataset Creation Details: Information about the input pressure level data, what was used to prescribe the boundary conditions, the model run, and similar details can be found on the dataset doc pages for 20CRV2, 20CRV2c, and 20CRv3.
External
- Every member of 20CR selected variables are available from the NERSC Science Gateway for version V3 (netCDF-4), V2c (netCDF-4 and GRIB), and V2 (netCDF-4 and GRIB1).
- Ensemble mean and ensemble standard deviations for 20CR variables are available from NCAR Research Data Archive for versions V3 (netCDF-4), V2c (GRIB1), and V2 (GRIB1).
How to Cite Use of 20CR Data
Acknowledgment (V3)
Acknowledgment (V2c)
The NOAA-CIRES Twentieth Century Reanalysis Project version 2c used resources of the National Energy Research Scientific Computing Center managed by Lawrence Berkeley National Laboratory which is supported by the Office of Science of the U.S. Department of Energy under Contract No. DE-AC02-05CH11231.
Papers using the NOAA-CIRES Twentieth Century Reanalysis Project version 2c dataset are requested to include the following text in their acknowledgments: "Support for the Twentieth Century Reanalysis Project version 2c dataset is provided by the U.S. Department of Energy, Office of Science Biological and Environmental Research (BER), and by the National Oceanic and Atmospheric Administration Climate Program Office
Acknowledgment (V2)
The Twentieth Century Reanalysis Project used resources of the National Energy Research Scientific Computing Center managed by Lawrence Berkeley National Laboratory and of the Oak Ridge Leadership Computing Facilityat Oak Ridge National Laboratory, which are supported by the Office of Science of the U.S. Department of Energy under Contract No. DE-AC02-05CH11231 and Contract No. DE-AC05-00OR22725, respectively.
Papers using the Twentieth Century Reanalysis Project dataset are requested to include the following text in their acknowledgments: "Support for the Twentieth Century Reanalysis Project dataset is provided by the U.S. Department of Energy, Office of Science Innovative and Novel Computational Impact on Theory and Experiment (DOE INCITE) program, and Office of Biological and Environmental Research (BER), by the National Oceanic and Atmospheric Administration Climate Program Office, and by the National Oceanic and Atmospheric Administration Climate Program Office, and by the NOAA Physical Sciences Laboratory."
References
Key References- Slivinski, L. C., Compo, G. P., Sardeshmukh, P. D., Whitaker, J. S., McColl, C., Allan, R. J., Brohan, P., Yin, X., Smith, C. A., Spencer, L. J., Vose, R. S., Rohrer, M., Conroy, R. P., Schuster, D. C., Kennedy, J. J., Ashcroft, L., Brönnimann, S., Brunet, M., Camuffo, D., Cornes, R., Cram, T. A., Domínguez-Castro, F., Freeman, J. E., Gergis, J., Hawkins, E., Jones, P. D., Kubota, H., Lee, T. C., Lorrey, A. M., Luterbacher, J., Mock, C. J., Przybylak, R. K., Pudmenzky, C., Slonosky, V. C., Tinz, B., Trewin, B., Wang, X. L., Wilkinson, C., Wood, K., & Wyszyński, P. (2021). An Evaluation of the Performance of the Twentieth Century Reanalysis Version 3, Journal of Climate, 34(4), 1417-1438. Retrieved Apr 30, 2021, from https://journals.ametsoc.org/view/journals/clim/34/4/JCLI-D-20-0505.1.xml and open access NOAA IR.
- Slivinski, L. C., Compo, G. P., Whitaker, J. S., Sardeshmukh, P. D., Giese, B. S., McColl, C., Allan, R., Yin, X., Vose, R., Titchner, H., Kennedy, J., Spencer, L. J., Ashcroft, L., Brönnimann, S., Brunet, M., Camuffo, D., Cornes, R., Cram, T. A., Crouthamel, R., Domínguez‐Castro, F., Freeman, J. E., Gergis, J., Hawkins, E., Jones, P. D., Jourdain, S., Kaplan, A., Kubota, H., Le Blancq, F., Lee, T., Lorrey, A., Luterbacher, J., Maugeri, M., Mock, C. J., Moore, G. K., Przybylak, R., Pudmenzky, C., Reason, C., Slonosky, V. C., Smith, C., Tinz, B., Trewin, B., Valente, M. A., Wang, X. L., Wilkinson, C., Wood, K. and Wyszyński, P. (2019), Towards a more reliable historical reanalysis: Improvements for version 3 of the Twentieth Century Reanalysis system. Q J R Meteorol Soc. ; 145; 2876– 2908. doi:10.1002/qj.3598.and open access NOAA IR.
- Giese, B.S., H.F. Seidel, G.P. Compo, and P.D. Sardeshmukh, 2016: An ensemble of ocean reanalyses for 1815-2013 with sparse observational input. J. Geophys. Res. Oceans, 121, 6891-6910, doi:10.1002/2016JC012079.
- Compo, G.P., J.S. Whitaker, P.D. Sardeshmukh, N. Matsui, R.J. Allan, X. Yin, B.E. Gleason, R.S. Vose, G. Rutledge, P. Bessemoulin, S. Brönnimann, M. Brunet, R.I. Crouthamel, A.N. Grant, P.Y. Groisman, P.D. Jones, M. Kruk, A.C. Kruger, G.J. Marshall, M. Maugeri, H.Y. Mok, Ø. Nordli, T.F. Ross, R.M. Trigo, X.L. Wang, S.D. Woodruff, and S.J. Worley, 2011: The Twentieth Century Reanalysis Project. Quarterly J. Roy. Meteorol. Soc., 137, 1-28. http://dx.doi.org/10.1002/qj.776
- Cionni, I., Eyring, V., Lamarque, J. F., Randel, W. J., Stevenson, D. S., Wu, F., Bodeker, G. E., Shepherd, T. G., Shindell, D. T. and Waugh, D. W. (2011) Ozone database in support of CMIP5 simulations: results and corresponding radiative forcing. Atmospheric Chemistry and Physics, 11, 11267–11292. URL: https://www.atmos-chem-phys.net/11/11267/2011/.
- Coddington, O., Lean, J. L., Pilewskie, P., Snow, M. and Lindholm, D. (2016) A solar irradiance climate data record. Bulletin of the American Meteorological Society, 97, 1265–1282. URL: https://doi.org/10.1175/BAMS-D-14-00265.1.
- Compo, G.P., J.S. Whitaker, and P.D. Sardeshmukh, 2006: Feasibility of a 100 year reanalysis using only surface pressure data. Bull. Amer. Met. Soc., 87, 175-190, http://dx.doi.org/10.1175/BAMS-87-2-175.
- Crowley, T. J. and Unterman, M. B. (2013) Technical details concerning development of a 1200 yr proxy index for global volcanism. Earth System Science Data, 5, 187–197. URL: https://www.earth-syst-sci-data.net/5/187/2013/.
- Fujiwara, M., Wright, J. S., Manney, G. L., Gray, L. J., Anstey, J., Birner, T., Davis, S., Gerber, E. P., Harvey, V. L., Hegglin, M. I., Homeyer, C. R., Knox, J. A., Krüger, K., Lambert, A., Long, C. S., Martineau, P., Molod, A., Monge-Sanz, B. M., Santee, M. L., Tegtmeier, S., Chabrillat, S., Tan, D. G. H., Jackson, D. R., Polavarapu, S., Compo, G. P., Dragani, R., Ebisuzaki, W., Harada, Y., Kobayashi, C., McCarty, W., Onogi, K., Pawson, S., Simmons, A., Wargan, K., Whitaker, J. S. and Zou, C.-Z. (2017) Introduction to the SPARC Reanalysis Intercomparison Project (S-RIP) and overview of the reanalysis systems. Atmospheric Chemistry and Physics, 17, 1417–1452. URL: https://www.atmos-chem-phys.net/17/1417/2017/.
- Han, J., Witek, M. L., Teixeira, J., Sun, R., Pan, H.-L., Fletcher, J. K. and Bretherton, C. S. (2016) Implementation in the NCEP GFS of a hybrid eddy-diffusivity mass-flux (EDMF) boundary layer parameterization with dissipative heating and modified stable boundary layer mixing. Weather and Forecasting, 31, 341–352. https://doi.org/10.1175/WAF-D-15-0053.1.
- Lei, L. and Whitaker, J. S. (2016) A four-dimensional incremental analysis update for the ensemble Kalman filter. Monthly Weather Review, 144, 2605–2621.https://doi.org/10.1175/MWR-D-15-0246.1
- McCormack, J., Eckermann, S., Siskind, D. and McGee, T. (2006) CHEM2D-OPP: A new linearized gas-phased ozone photo- chemistry parameterization for high-altitude NWP and climate models. Tech. rep., NAVAL RESEARCH LAB WASHINGTON DC.
- Palmer, T., Buizza, R., Doblas-Reyes, F., Jung, T., Leutbecher, M., Shutts, G., Steinheimer, M. and Weisheimer, A. (2009) Stochastic parametrization and model uncertainty. ECMWF Tech. Memo, 598, 1–42.
- Saha, S., Moorthi, S., Pan, H.-L., Wu, X., Wang, J., Nadiga, S., Tripp, P., Kistler, R., Woollen, J., Behringer, D. et al. (2010) The NCEP climate forecast system reanalysis. Bulletin of the American Meteorological Society, 91, 1015–1058.https://doi.org/10.1175/2010BAMS3001.1
- Shutts, G., Leutbecher, M., Weisheimer, A., Stockdale, T., Isaksen, L. and Bonavita, M. (2011) Representing model uncertainty: stochastic parameterizations at ECMWF. ECMWF Newsletter, 129, 19–24.
- Titchner, H. A. and Rayner, N. A. (2014) The Met Office Hadley Centre sea ice and sea surface temperature data set, version 2: 1. Sea ice concentrations. Journal of Geophysical Research: Atmospheres, 119, 2864–2889. URL: https://agupubs.onlinelibrary.wiley.com/doi/abs/10.1002/2013JD020316.
- Tompkins, A. and Berner, J. (2008) A stochastic convective approach to account for model uncertainty due to unresolved humidity variability. Journal of Geophysical Research: Atmospheres, 113. https://doi.org/10.1029/2007JD009284
- Trenberth, K. E. and Smith, L. (2005) The mass of the atmosphere: A constraint on global analyses. Journal of Climate, 18, 864–875.https://doi.org/10.1175/JCLI-3299.1
- Walsh, J. E., Chapman, W. L. and Fetterer, F. (2015, updated 2016) Gridded monthly sea ice extent and concentration, 1850 onward, version 1. Boulder, Colorado USA. NSIDC: National Snow and Ice Data Center.
- Wang, J.A., P.D. Sardeshmukh, G.P. Compo, J.S. Whitaker, L.C. Slivinski, C.M. McColl, and P.J. Pegion, 2019: Sensitivities of the NCEP Global Forecast System. Mon. Wea. Rev., 147, 1237–1256, https://doi.org/10.1175/MWR-D-18-0239.1
- Whitaker, J.S., G.P. Compo, X. Wei, and T.M. Hamill 2004: Reanalysis without radiosondes using ensemble data assimilation. Mon. Wea. Rev., 132, 1190-1200, http://dx.doi.org/10.1175/1520-0493(2004)132<1190:RWRUED>2.0.CO;2
Citations
- Altmann, M., and Coauthors, 2023: Quantitative Long-Term Monitoring (1890-2020) of Morphodynamic and Land-Cover Changes of a LIA Lateral Moraine Section. Geosciences, 13, doi:10.3390/geosciences13040095.
- Andree, E., J. Su, M. A. D. Larsen, M. Drews, M. Stendel, and K. S. Madsen, 2023: The role of preconditioning for extreme storm surges in the western Baltic Sea. Natural Hazards and Earth System Sciences, 23, 1817-1834, doi:10.5194/nhess-23-1817-2023.
- Arora, V. K., C. Seiler, L. B. Wang, and S. Kou-Giesbrecht, 2023: Towards an ensemble-based evaluation of land surface models in light ofuncertain forcings and observations. Biogeosciences, 20, 1313-1355, doi:10.5194/bg-20-1313-2023.
- Årthun, M., 2023: Surface-Forced Variability in the Nordic Seas Overturning Circulation and Overflows. Geophysical Research Letters, 50, doi:10.1029/2023gl104158.
- Avanzi, F., and Coauthors, 2023: IT-SNOW: a snow reanalysis for Italy blending modeling, in situ data, and satellite observations (2010-2021). Earth System Science Data, 15, 639-660, doi:10.5194/essd-15-639-2023.
- Badescu, V., N. Rotar, A. Dumitrescu, C. Oprea, and M. Paulescu, 2023: Solar global irradiance from actinometric degree data for Montsouris (Paris) 1873-1877. Theoretical and Applied Climatology, 153, 539-559, doi:10.1007/s00704-023-04485-2.
- Bai, H., C. Strong, and B. Zuckerberg, 2023: Drivers of an Ecologically Relevant Summer North American Dipole. J. Clim., 36, 2386-2398, doi:10.1175/jcli-d-22-0542.1.
- Bokuchava, D. D., and V. A. Semenov, 2023: The Role of Natural Fluctuations and Factors of External Forcing in Early 20th Century Warming in the Northern Hemisphere. Izvestiya Atmospheric and Oceanic Physics, 59, S81-S96, doi:10.1134/s0001433823130030.
- Borhara, K., B. Fosu, and S. Y. S. Wang, 2023: The role of the western North Pacific (WNP) as an El Nino-Southern Oscillation (ENSO) precursor in a warmer future climate. Climate Dynamics, doi:10.1007/s00382-023-06773-z.
- Borkotoky, S. S., A. P. Williams, and S. Steinschneider, 2023: Six Hundred Years of Reconstructed Atmospheric River Activity Along the US West Coast. Journal of Geophysical Research-Atmospheres, 128, doi:10.1029/2022jd038321.
- Brierley, C., K. Thirumalai, E. Grindrod, and J. Barnsley, 2023: Indian Ocean variability changes in the Paleoclimate Modelling Intercomparison Project. Climate of the Past, 19, 681-701, doi:10.5194/cp-19-681-2023.
- Cai, L., and Coauthors, 2023: Improvement of human-induced wildfire occurrence modeling from a spatial variation of anthropogenic ignition factor in the CLM5. Environmental Research Letters, 18, doi:10.1088/1748-9326/acf1b6.
- Cai, W. J., and Coauthors, 2023: Anthropogenic impacts on twentieth-century ENSO variability changes. Nature Reviews Earth & Environment, 4, 407-418, doi:10.1038/s43017-023-00427-8.
- Chaudhary, L., S. Sharma, and M. Sajwan, 2023: Systematic Literature Review of Various Neural Network Techniques for Sea Surface Temperature Prediction Using Remote Sensing Data. Archives of Computational Methods in Engineering, 30, 5071-5103, doi:10.1007/s11831-023-09970-5.
- Chen, W., 2023: Role of the Aleutian Low in Modulating the Connection between the Moderate El Nino and the Following Spring North Tropical Atlantic SST Anomalies. J. Clim., 36, 3681-3695, doi:10.1175/jcli-d-22-0656.1.
- Chen, Y., and Coauthors, 2023: Weakened western Pacific teleconnection pattern caused a decrease in spring persistent rainfall in north of 26 °N over Southeast China. International Journal of Climatology, 43, 4337-4346, doi:10.1002/joc.8090.
- Chinta, V., Y. Du, Y. Hong, Z. S. Chen, and J. S. Chowdary, 2023: Impact of the Interdecadal Pacific Oscillation on tropical Indian Ocean sea surface height: An assessment from CMIP6 models. International Journal of Climatology, 43, 4631-4647, doi:10.1002/joc.8107.
- Christidis, N., D. Mitchell, and P. A. Stott, 2023: Rapidly increasing likelihood of exceeding 50 °C in parts of the Mediterranean and the Middle East due to human influence. Npj Climate and Atmospheric Science, 6, doi:10.1038/s41612-023-00377-4.
- Crossett, C. C., L. A. L. Dupigny-Giroux, K. E. Kunkel, A. K. Betts, and A. Bomblies, 2023: Synoptic Typing of Multiduration, Heavy Precipitation Records in the Northeastern United States: 1895-2017. Journal of Applied Meteorology and Climatology, 62, 721-736, doi:10.1175/jamc-d-22-0091.1.
- Dangendorf, S., and Coauthors, 2023: Acceleration of US Southeast and Gulf coast sea-level rise amplified by internal climate variability. Nature Communications, 14, doi:10.1038/s41467-023-37649-9.
- Dao, T. L., C. L. Vincent, and T. P. Lane, 2023: Multiscale Influences on Rainfall in Northeast Australia. J. Clim., 36, 5989-6006, doi:10.1175/jcli-d-22-0835.1.
- Deser, C., and A. S. Phillips, 2023: A range of outcomes: the combined effects of internal variability andanthropogenic forcing on regional climate trends over Europe. Nonlinear Proc Geoph, 30, 63-84, doi:10.5194/npg-30-63-2023.
- Ding, R. Q., and Coauthors, 2023: North Atlantic oscillation controls multidecadal changes in the North Tropical Atlantic-Pacific connection. Nature Communications, 14, doi:10.1038/s41467-023-36564-3.
- Ding, Y. H., X. T. Sun, Q. Q. Li, and Y. F. Song, 2023: Interdecadal Variation in Rossby Wave Source over the Tibetan Plateau and Its Impact on the East Asia Circulation Pattern during Boreal Summer. Atmosphere, 14, doi:10.3390/atmos14030541.
- Duan, J., Y. L. Li, L. J. Cheng, P. F. Lin, and F. Wang, 2023: Heat Storage in the Upper Indian Ocean: The Role of Wind-Driven Redistribution. J. Clim., 36, 2221-2242, doi:10.1175/jcli-d-22-0534.1.
- Dutta, A., R. Sivankutty, and J. M. Neena, 2023: Investigating the Atlantic-Indian monsoon teleconnection pathways in PMIP3 last millennium simulations. Climate Dynamics, doi:10.1007/s00382-023-06994-2.
- Fan, Y. F., W. Liu, P. F. Zhang, R. Chen, and L. F. Li, 2023: North Atlantic Oscillation contributes to the subpolar North Atlantic cooling in the past century. Climate Dynamics, doi:10.1007/s00382-023-06847-y.
- Faranda, D., S. Pascale, and B. Bulut, 2023: Persistent anticyclonic conditions and climate change exacerbated the exceptional 2022 European-Mediterranean drought. Environmental Research Letters, 18, doi:10.1088/1748-9326/acbc37.
- Gao, X., Y. L. Li, P. F. Lin, L. Zhang, Q. P. Ren, Y. Lu, and F. Wang, 2023: Origins of Multidecadal SST Variations in the Southern Atlantic and Indian Oceans Since the 1960s. Geophysical Research Letters, 50, doi:10.1029/2022gl101735.
- Gavahi, K., E. Foroumandi, and H. Moradkhani, 2023: A deep learning-based framework for multi-source precipitation fusion. Remote Sens Environ, 295, doi:10.1016/j.rse.2023.113723.
- Gavrilov, A., S. Kravtsov, M. Buyanova, D. Mukhin, E. Loskutov, and A. Feigin, 2023: Forced response and internal variability in ensembles of climate simulations: identification and analysis using linear dynamical mode decomposition. Climate Dynamics, doi:10.1007/s00382-023-06995-1.
- Ge, Y. C., J. P. Miao, X. M. Lang, D. Si, and D. B. Jiang, 2023: Combined Impacts of the Pacific Decadal Oscillation and Atlantic Multidecadal Oscillation on Summer Precipitation in Eastern China During the Medieval Climate Anomaly and Little Ice Age. Journal of Geophysical Research-Atmospheres, 128, doi:10.1029/2023jd038920.
- Gelfan, A., A. Kalugin, and I. Krylenko, 2023: Detection, attribution, and specifying mechanisms of hydrological changes in geographically different river basins. Climatic Change, 176, doi:10.1007/s10584-023-03557-6.
- Gorokhovsky, E., and J. L. Anderson, 2023: Extending ensemble Kalman filter algorithms to assimilate observations with an unknown time offset. Nonlinear Proc Geoph, 30, 37-47, doi:10.5194/npg-30-37-2023.
- Grooms, I., 2023: Two Methods for Data Assimilation of Wind Direction. Tellus Series a-Dynamic Meteorology and Oceanography, 75, 145-158, doi:10.16993/tellusa.2005.
- Guan, C. Y., X. Wang, and H. J. Yang, 2023: Understanding the Development of the 2018/19 Central Pacific El Nino. Advances in Atmospheric Sciences, 40, 177-185, doi:10.1007/s00376-022-1410-1.
- Gui, S., R. W. Yang, F. Zeng, and J. X. Cheng, 2023: Interdecadal Variability in the Interface Between the Indian Summer Monsoon and the East Asian Summer Monsoon. Journal of Geophysical Research-Atmospheres, 128, doi:10.1029/2022jd038399.
- Gui, S., R. W. Yang, F. Zeng, and J. X. Cheng, 2023: Interdecadal Variability in the Interface Between the Indian Summer Monsoon and the East Asian Summer Monsoon. Journal of Geophysical Research-Atmospheres, 128, doi:10.1029/2022jd038399.
- Guo, Y. R., Y. L. Li, and F. Wang, 2023: Destinations and Pathways of the Indonesian Throughflow Water in the Indian Ocean. J. Clim., 36, 3717-3735, doi:10.1175/jcli-d-22-0631.1.
- Harvey, B., E. Hawkins, and R. Sutton, 2023: Storylines for future changes of the North Atlantic jet and associated impacts on the UK. International Journal of Climatology, 43, 4424-4441, doi:10.1002/joc.8095.
- Hawkins, E., and Coauthors, 2023: Rescuing historical weather observations improves quantification of severewindstorm risks. Natural Hazards and Earth System Sciences, 23, 1465-1482, doi:10.5194/nhess-23-1465-2023.
- Hiraga, Y., Y. Iseri, M. D. Warner, C. D. Frans, A. M. Duren, J. F. England, and M. L. Kavvas, 2023: Comparison of Model-Based Precipitation Maximization Methods: Moisture Optimization Method, Storm Transposition Method, and Their Combination. J Hydrol Eng, 28, doi:10.1061/(asce)he.1943-5584.0002234.
- Hong, X., L. Hu, and A. Kareem, 2023: A tropical cyclone intensity prediction model using conditional generative adversarial network. Journal of Wind Engineering and Industrial Aerodynamics, 240, doi:10.1016/j.jweia.2023.105515.
- Hörhold, M., and Coauthors, 2023: Modern temperatures in central-north Greenland warmest in past millennium. Nature, 613, 503-+, doi:10.1038/s41586-022-05517-z.
- Huo, W. J., Z. N. Xiao, and L. Zhao, 2023: Phase-Locked Impact of the 11-Year Solar Cycle on Tropical Pacific Decadal Variability. J. Clim., 36, 421-439, doi:10.1175/jcli-d-21-0595.1.
- Jahfer, S., K. J. Ha, C. L. E. Franzke, S. S. Lee, K. B. Rodgers, and D. E. Lee, 2023: Decoupling of Arctic variability from the North Pacific in a warmer climate. Npj Climate and Atmospheric Science, 6, doi:10.1038/s41612-023-00480-6.
- Ji, X. L., J. Feng, J. P. Li, and X. R. Chen, 2023: Relationship between the hadley circulation and tropical SST meridional structures under different thermal conditions in the indo-pacific warm pool. Frontiers in Marine Science, 9, doi:10.3389/fmars.2022.1088276.
- Jiang, L. S., T. Li, and Y. G. Ham, 2023: Asymmetric Impacts of El Nino and La Nina on Equatorial Atlantic Warming. J. Clim., 36, 193-212, doi:10.1175/jcli-d-22-0158.1.
- Jiang, Y. Y., J. Li, B. Wang, Y. M. Yang, and Z. W. Zhu, 2023: Weakening of decadal variation of Northern Hemisphere land monsoon rainfall under global warming. Npj Climate and Atmospheric Science, 6, doi:10.1038/s41612-023-00441-z.
- Jimenez, L. C. M., R. V. Andreoli, M. T. Kayano, R. A. F. de Souza, and W. L. Ceron, 2023: Multiyear versus single-year El Nino events: Contrasting their impacts on South American seasonal precipitation. International Journal of Climatology, doi:10.1002/joc.8186.
- Jung, C. S. P., and D. Schindler, 2023: Comprehensive validation of 68 wind speed models highlights the benefits of ensemble approaches. Energy Conversion and Management, 286, doi:10.1016/j.enconman.2023.117012.
- King, J., K. J. Anchukaitis, K. Allen, T. Vance, and A. Hessl, 2023: Trends and variability in the Southern Annular Mode over the Common Era. Nature Communications, 14, doi:10.1038/s41467-023-37643-1.
- King, M. P., N. Keenlyside, and C. Li, 2023: ENSO teleconnections in terms of non-NAO and NAO atmospheric variability. Climate Dynamics, 61, 2717-2733, doi:10.1007/s00382-023-06697-8.
- Lang, Q., W. Zhao, W. P. Yu, M. G. Ma, Y. Xiao, Y. J. Huang, and L. C. Wang, 2023: An Iterative Method Initialized by ERA5 Reanalysis Data for All-Sky Downward Surface Shortwave Radiation Estimation Over Complex Terrain With MODIS Observations. Ieee T Geosci Remote, 61, doi:10.1109/tgrs.2023.3323033.
- Lee, R., L. Chen, and G. Ren, 2023: A comparison of East-Asia landfall tropical cyclone in recent reanalysis datasets--before and after satellite era. Frontiers in Earth Science, 10, doi:10.3389/feart.2022.1026945.
- Lei, T., and S. L. Li, 2023: The Role of Underlying Boundary Forcing in Shaping the Recent Decadal Change of Persistent Anomalous Activity over the Ural Mountains. Advances in Atmospheric Sciences, doi:10.1007/s00376-023-2365-6.
- Li, M. F., and Coauthors, 2023: Strength of the winter North Atlantic jet stream has deviated from its natural trend under anthropogenic warming. Geology, doi:10.1130/g51329.1.
- Li, Y. D., X. C. Li, J. Feng, Y. Zhou, W. Z. Wang, and Y. R. Hou, 2023: Uncertainties of ENSO-related Regional Hadley Circulation Anomalies within Eight Reanalysis Datasets. Advances in Atmospheric Sciences, doi:10.1007/s00376-023-3047-0.
- Liu, G., S. S. Peng, C. Huntingford, and Y. Xi, 2023: A new precipitation emulator (PREMU v1.0) for lower-complexity models. Geoscientific Model Development, 16, 1277-1296, doi:10.5194/gmd-16-1277-2023.
- Liu, L. B., and Coauthors, 2023: Increasingly negative tropical water-interannual CO2 growth rate coupling. Nature, 618, 755-+, doi:10.1038/s41586-023-06056-x.
- Liu, Y. L., X. G. Sun, and X. Q. Yang, 2023: Stage-dependent influence of PDO on interdecadal summer precipitation anomalies in eastern China. Climate Dynamics, 61, 2071-2084, doi:10.1007/s00382-023-06667-0.
- Lu, C. X., and Coauthors, 2023: TropNet: a deep spatiotemporal neural network for tropospheric delay modeling and forecasting. Journal of Geodesy, 97, doi:10.1007/s00190-023-01722-4.
- Luo, F. Y., J. Ying, T. Y. Liu, and D. K. Chen, 2023: Origins of Southern Ocean warm sea surface temperature bias in CMIP6 models. Npj Climate and Atmospheric Science, 6, doi:10.1038/s41612-023-00456-6.
- Ma, X. G., and Coauthors, 2023: Large Uncertainties in Precipitation Exert Considerable Impact on Land Surface Temperature Modeling Over the Tibetan Plateau. Journal of Geophysical Research-Atmospheres, 128, doi:10.1029/2022jd037615.
- Minola, L., and Coauthors, 2023: The contribution of large-scale atmospheric circulation to variations of observed near-surface wind speed across Sweden since 1926. Climatic Change, 176, doi:10.1007/s10584-023-03525-0.
- O'Reilly, C. H., M. Patterson, J. Robson, P. A. Monerie, D. Hodson, and Y. Ruprich-Robert, 2023: Challenges with interpreting the impact of Atlantic Multidecadal Variability using SST-restoring experiments. Npj Climate and Atmospheric Science, 6, doi:10.1038/s41612-023-00335-0.
- Ojelabi, O., J. Hounkpè, K. O. Oluwasemire, and A. E. Lawin, 2023: Hydroclimatic trends, breakpoints and future projection analysis of the Ogun River Basin in West Africa. Water Practice and Technology, 18, 2023-2044, doi:10.2166/wpt.2023.137.
- Paik, S., and Coauthors, 2023: Impact of volcanic eruptions on extratropical atmospheric circulations: review, revisit and future directions. Environmental Research Letters, 18, doi:10.1088/1748-9326/acd5e6.
- Penserini, B. D., and Coauthors, 2023: Magnitude and timing of transient incision resulting from large-scale drainage capture, Sutlej River, Northwest Himalaya. Earth Surface Processes and Landforms, doi:10.1002/esp.5705.
- Piskala, V., and R. Huth, 2023: Identifying Shifts in Modes of Low-Frequency Circulation Variability Using the 20CR Renalysis Ensemble. J. Clim., 36, 7771-7783, doi:10.1175/jcli-d-22-0620.1.
- Rateb, S. A. A., A. Srivastava, and B. Zerouali, 2023: On the role of land-surface hydrology schemes in simulating the daily maximum and minimum air temperatures of Australia using a regional climate model (RegCM4). Journal of Water and Climate Change, 14, 989-1011, doi:10.2166/wcc.2023.512.
- Renard, B., 2023: Use of a national flood mark database to estimate flood hazard in the distant past. Hydrological Sciences Journal, 68, 1078-1094, doi:10.1080/02626667.2023.2212165.
- Renard, B., D. McInerney, S. Westra, M. Leonard, D. Kavetski, M. Thyer, and J. P. Vidal, 2023: Floods and Heavy Precipitation at the Global Scale: 100-Year Analysis and 180-Year Reconstruction. Journal of Geophysical Research-Atmospheres, 128, doi:10.1029/2022jd037908.
- Reynolds, C. A., and Coauthors, 2023: Impacts of Northeastern Pacific Buoy Surface Pressure Observations. Monthly Weather Review, 151, 211-226, doi:10.1175/mwr-d-22-0124.1.
- Rutllant, J. A., F. Matus, V. Rudloff, and R. Rondanelli, 2023: The role of atmospheric rivers in rainfall-induced landslides: A study from the Elqui valley. Journal of Arid Environments, 216, doi:10.1016/j.jaridenv.2023.105016.
- Salinger, M. J., and Coauthors, 2023: Coupled ocean-atmosphere summer heatwaves in the New Zealand region: an update. Weather and Climate, 42, 18-41, doi:Schneider, A., C. Zender, N. Loeb, and S. Price, 2023: Use of Shallow Ice Core Measurements to Evaluate and Constrain 1980-1990 Global Reanalyses of Ice Sheet Precipitation Rates. Geophysical Research Letters, 50, doi:10.1029/2023gl103943.
- Schurer, A. P., and Coauthors, 2023: Quantifying the contribution of forcing and three prominent modes of variability to historical climate. Climate of the Past, 19, 943-957, doi:10.5194/cp-19-943-2023.
- Scussolini, P., and Coauthors, 2023: Modeled storm surge changes in a warmer world: the Last Interglacial. Climate of the Past, 19, 141-157, doi:10.5194/cp-19-141-2023.
- Si, D., and L. W. Yu, 2023: Impact of the Atlantic multidecadal variability on East Asian summer climate in idealized simulations. Atmospheric and Oceanic Science Letters, 16, doi:10.1016/j.aosl.2023.100399.
- Souza, I. P., R. V. Andreoli, M. T. Kayano, W. L. Ceron, R. A. F. Souza, and I. Roy, 2023: Interdecadal Pacific Oscillation modulation of ENSO teleconnections in its decaying stages: Relations with Indian Ocean basin-wide mode and South American precipitation. International Journal of Climatology, 43, 3264-3283, doi:10.1002/joc.8028.
- Stübner, K., G. Balco, and N. Schmeisser, 2023: RIVERSAND: A NEW TOOL FOR EFFICIENT COMPUTATION OF CATCHMENTWIDE EROSION RATES. Radiocarbon, doi:10.1017/rdc.2023.74.
- Su, Y. B., J. A. Smith, and G. Villarini, 2023: Extreme Convective Rainfall and Flooding from Winter Season Extratropical Cyclones in the Mid-Atlantic Region of the United States. Journal of Hydrometeorology, 24, 497-520, doi:10.1175/jhm-d-22-0069.1.
- Su, Y. B., J. A. Smith, and G. Villarini, 2023: The Hydrometeorology of Extreme Floods in the Lower Mississippi River. Journal of Hydrometeorology, 24, 203-219, doi:10.1175/jhm-d-22-0024.1.
- Szuwalski, C. S., and Coauthors, 2023: Unintended consequences of climate-adaptive fisheries management targets. Fish and Fisheries, 24, 439-453, doi:10.1111/faf.12737.
- Teleti, P., E. Hawkins, and K. R. Wood, 2023: Digitizing weather observations from World War II US naval ship logbooks. Geoscience Data Journal, doi:10.1002/gdj3.222.
- Topál, D., and Q. H. Ding, 2023: Atmospheric circulation-constrained model sensitivity recalibrates Arctic climate projections. Nature Climate Change, 13, 710-+, doi:10.1038/s41558-023-01698-1.
- Tu'uholoaki, M., A. Espejo, K. K. Sharma, A. Singh, M. Wandres, H. Damlamian, and S. Chand, 2023: Influence of the Madden-Julian Oscillation (MJO) on Tropical Cyclones Affecting Tonga in the Southwest Pacific. Atmosphere, 14, doi:10.3390/atmos14071189.
- Vasil'ev, D. Y., V. A. Semenov, and A. A. Chibilev, 2023: Climatic Changes of the Temperature Regime on the Territory of Russia in the 20th and Early 21st Centuries. Geography and Natural Resources, 44, 99-106, doi:10.1134/s1875372823020130.
- Vellalassery, A., G. Baumgarten, M. Grygalashvyly, and F. J. Lübken, 2023: Greenhouse gas effects on the solar cycle response of water vapour andnoctilucent clouds. Annales Geophysicae, 41, 289-300, doi:10.5194/angeo-41-289-2023.
- Viorica, N., R. Catalin-Constantin, M. Andrei, S. Marian-Ionut, P. Ionel, and I. Monica, 2023: The first tree-ring reconstrruction of streamflow variability over the last-250 years in the Lower Danube. Journal of Hydrology, 617, doi:10.1016/j.jhydrol.2023.129150.
- Wang, B., and Coauthors, 2023: Understanding the recent increase in multiyear La Niñas. Nature Climate Change, doi:10.1038/s41558-023-01801-6.
- Wang, Y. C., W. L. Tseng, Y. L. Chen, S. Y. Lee, H. H. Hsu, and H. C. Liang, 2023: ENSO statistics, teleconnections, and atmosphere-ocean coupling in theTaiwan Earth System Model version 1. Geoscientific Model Development, 16, 4599-4616, doi:10.5194/gmd-16-4599-2023.
- Weickmann, K., E. Berry, V. Gensini, D. Gold, and T. Petroski, 2023: Changes in the Global Climate: Atmospheric Angular Momentum and Pacific Ocean Temperatures. J. Clim., 36, 6597-6611, doi:10.1175/jcli-d-22-0322.1.
- Xu, C. Q., C. Liu, Y. B. Yao, Q. Wang, and X. Q. Wang, 2023: Tibetan zenith wet delay model with refined vertical correction. Journal of Geodesy, 97, doi:10.1007/s00190-023-01719-z.
- Xue, M. R., and T. Li, 2023: To what extent does ENSO rectify the tropical Pacific mean state? Climate Dynamics, doi:10.1007/s00382-023-06750-6.
- Yang, Y., Q. L. You, Z. Y. Zuo, Y. Q. Zhang, Z. Liu, S. C. Kang, and P. M. Zhai, 2023: Elevation dependency of temperature trend over the Qinghai-Tibetan Plateau during 1901-2015. Atmospheric Research, 290, doi:10.1016/j.atmosres.2023.106791.
- Yeasmin, A., S. Chand, and N. Sultanova, 2023: Tropical cyclones and depressions over the South Pacific Ocean since the late 19th century: Assessing synergistic relationship between the El Nino Southern Oscillation and Interdecadal Pacific Oscillation. International Journal of Climatology, 43, 5422-5443, doi:10.1002/joc.8154.
- Yeasmin, A., S. Chand, and N. Sultanova, 2023: Reconstruction of tropical cyclone and depression proxies for the South Pacific since the 1850s. Weather and Climate Extremes, 39, doi:10.1016/j.wace.2022.100543.
- Yilmaz, F., M. Tsamados, and D. Osborn, 2023: Digitizing Ottoman daily weather observations of Halkali Agricultural School in Istanbul, Turkiye (1896-1917). Geoscience Data Journal, doi:10.1002/gdj3.205.
- Yu, J. H., T. M. Li, and L. S. Jiang, 2023: Why Does a Stronger El Nino Favor Developing towards the Eastern Pacific while a Stronger La Nina Favors Developing towards the Central Pacific? Atmosphere, 14, doi:10.3390/atmos14071185.
- Yu, L. W., and Coauthors, 2023: Tibetan Plateau Booster Effect on the Influence of Atlantic Multidecadal Variability on the East Asian Summer Rainfall. J. Clim., 36, 3437-3452, doi:10.1175/jcli-d-22-0472.1.
- Yule, E. L., G. Hegerl, A. Schurer, and E. Hawkins, 2023: Using early extremes to place the 2022 UK heat waves into historical context. Atmospheric Science Letters, 24, doi:10.1002/asl.1159.
- Zhang, S. Q., and Coauthors, 2023: Changes in the mean and extreme temperature in the Yangtze River Basin over the past 120 years. Weather and Climate Extremes, 40, doi:10.1016/j.wace.2023.100557.
- Zhang, W. Y., J. Zeng, Y. T. Wang, Y. Z. Wang, and B. J. Huai, 2023: Capability of multi-reanalyses to represent precipitation over the Greenland Ice Sheet. Atmospheric Research, 284, doi:10.1016/j.atmosres.2022.106598.
- Altmann, M., and Coauthors, 2023: Quantitative Long-Term Monitoring (1890-2020) of Morphodynamic and Land-Cover Changes of a LIA Lateral Moraine Section. Geosciences, 13, doi:10.3390/geosciences13040095.
- Anderson, T. G., K. A. McKinnon, D. Pons, and K. J. Anchukaitis, 2023: How Exceptional Was the 2015-2019 Central American Drought? Geophysical Research Letters, 50, doi:10.1029/2023gl105391.
- Andree, E., J. Su, M. A. D. Larsen, M. Drews, M. Stendel, and K. S. Madsen, 2023: The role of preconditioning for extreme storm surges in the western Baltic Sea. Natural Hazards and Earth System Sciences, 23, 1817-1834, doi:10.5194/nhess-23-1817-2023.
- Badescu, V., N. Rotar, A. Dumitrescu, C. Oprea, and M. Paulescu, 2023: Solar global irradiance from actinometric degree data for Montsouris (Paris) 1873-1877. Theoretical and Applied Climatology, 153, 539-559, doi:10.1007/s00704-023-04485-2.
- Berezowski, T., and M. Wassen, 2023: Using water sources extent during inundation as a reliable predictor for vegetation zonation in a natural wetland floodplain. Ecological Indicators, 154, doi:10.1016/j.ecolind.2023.110854.
- Brierley, C., K. Thirumalai, E. Grindrod, and J. Barnsley, 2023: Indian Ocean variability changes in the Paleoclimate Modelling Intercomparison Project. Climate of the Past, 19, 681-701, doi:10.5194/cp-19-681-2023.
- Brönnimann, S., 2023: Evolution of total column ozone prior to the era of ozone depletion. Frontiers in Earth Science, 11, doi:10.3389/feart.2023.1079510.
- Brönnimann, S., and Y. Brugnara, 2023: The weather diaries of the Kirch family: Leipzig, Guben, and Berlin (1677-1774). Climate of the Past, 19, 1435-1445, doi:10.5194/cp-19-1435-2023.
- Brugnara, Y., S. Brönnimann, S. Grab, J. Steinkopf, A. M. Burgdorf, C. Wilkinson, and R. Allan, 2023: South African extreme weather during the 1877-1878 El Niño. Weather, 78, 286-293, doi:10.1002/wea.4468.
- Bui, T. Q., D. Lafarga, T. M. Smith, Y. T. Song, and S. S. P. Shen, 2023: Calculation, visualization, and interpretation of three-dimensional atmosphere-ocean coupled empirical orthogonal functions using the reanalyses data. Theoretical and Applied Climatology, 154, 59-73, doi:10.1007/s00704-023-04513-1.
- Cai, Z. Y., and Coauthors, 2023: Interdecadal variability of the warm Arctic-cold Eurasia pattern linked to the Barents oscillation. Atmospheric Research, 287, doi:10.1016/j.atmosres.2023.106712.
- Chang, M. H., C. H. Ho, J. H. Ho, and E. J. Cha, 2023: Centennial analysis in tropical cyclone-induced precipitation in Korea. Weather and Climate Extremes, 39, doi:10.1016/j.wace.2023.100549.
- Chemke, R., and J. Yuval, 2023: Human-induced weakening of the Northern Hemisphere tropical circulation. Nature, 617, 529-+, doi:10.1038/s41586-023-05903-1.
- Chen, Q. M., and Coauthors, 2023: Weakening of the Summer Monsoon Over the Past 150 Years Shown by a Tree-Ring Record From Shandong, Eastern China, and the Potential Role of North Atlantic Climate. Paleoceanography and Paleoclimatology, 38, doi:10.1029/2022pa004495.
- Chen, W. H., and Coauthors, 2023: Increased tropical South Pacific western boundary current transport over the past century. Nature Geoscience, 16, 590-+, doi:10.1038/s41561-023-01212-4.
- Chen, Y., and Coauthors, 2023: Weakened western Pacific teleconnection pattern caused a decrease in spring persistent rainfall in north of 26 °N over Southeast China. International Journal of Climatology, 43, 4337-4346, doi:10.1002/joc.8090.
- Christidis, N., D. Mitchell, and P. A. Stott, 2023: Rapidly increasing likelihood of exceeding 50 °C in parts of the Mediterranean and the Middle East due to human influence. Npj Climate and Atmospheric Science, 6, doi:10.1038/s41612-023-00377-4.
- Churakova, O. V., and Coauthors, 2023: Climate impacts on tree-ring stable isotopes across the Northern Hemispheric boreal zone. Science of the Total Environment, 870, doi:10.1016/j.scitotenv.2023.161644.
- Cornes, R. C., P. D. Jones, T. Brandsma, D. Cendrier, and S. Jourdain, 2023: The London, Paris and De Bilt sub-daily pressure series. Geoscience Data Journal, doi:10.1002/gdj3.226.
- Dalelane, C., K. Winderlich, and A. Walter, 2023: Evaluation of global teleconnections in CMIP6 climate projections using complex networks. Earth System Dynamics, 14, 17-37, doi:10.5194/esd-14-17-2023.
- Dangendorf, S., and Coauthors, 2023: Acceleration of US Southeast and Gulf coast sea-level rise amplified by internal climate variability. Nature Communications, 14, doi:10.1038/s41467-023-37649-9.
- Dong, J. J., L. Y. Sun, J. A. Carton, and S. G. Penny, 2023: Improvements of Lagrangian Data Assimilation Tested in the Gulf of Mexico. Monthly Weather Review, 151, 1927-1936, doi:10.1175/mwr-d-22-0202.1.
- Dooley, K., and Coauthors, 2023: Reassessing long-standing meteorological records: an example using thenational hottest day in Ireland. Climate of the Past, 19, 1-22, doi:10.5194/cp-19-1-2023.
- Fallah, B., E. Russo, C. Menz, P. Hoffmann, I. Didovets, and F. F. Hattermann, 2023: Anthropogenic influence on extreme temperature and precipitation in Central Asia. Scientific Reports, 13, doi:10.1038/s41598-023-33921-6.
- Faranda, D., S. Pascale, and B. Bulut, 2023: Persistent anticyclonic conditions and climate change exacerbated the exceptional 2022 European-Mediterranean drought. Environmental Research Letters, 18, doi:10.1088/1748-9326/acbc37.
- Fu, D., P. Chang, and X. Liu, 2023: Using Convolutional Neural Network to Emulate Seasonal Tropical Cyclone Activity. Journal of Advances in Modeling Earth Systems, 15, doi:10.1029/2022ms003596.
- Gbode, I. E., T. E. Babalola, G. T. Diro, and J. D. Intsiful, 2023: Assessment of ERA5 and ERA-Interim in Reproducing Mean and Extreme Climates over West Africa. Advances in Atmospheric Sciences, 40, 570-586, doi:10.1007/s00376-022-2161-8.
- Godoy, M. R. V., and Y. Markonis, 2023: pRecipe: A global precipitation climatology toolbox and database. Environmental Modelling & Software, 165, doi:10.1016/j.envsoft.2023.105711.
- Godoy, M. R. V., and Y. Markonis, 2023: Water cycle changes in reanalyses: a complementary framework. Scientific Reports, 13, doi:10.1038/s41598-023-31873-5.
- Gore, M. J., C. M. Zarzycki, and M. M. Gervais, 2023: Connecting Large-Scale Meteorological Patterns to Extratropical Cyclones in CMIP6 Climate Models Using Self-Organizing Maps. Earths Future, 11, doi:10.1029/2022ef003211.
- Gorokhovsky, E., and J. L. Anderson, 2023: Extending ensemble Kalman filter algorithms to assimilate observations with an unknown time offset. Nonlinear Proc Geoph, 30, 37-47, doi:10.5194/npg-30-37-2023.
- Grooms, I., 2023: Two Methods for Data Assimilation of Wind Direction. Tellus Series a-Dynamic Meteorology and Oceanography, 75, 145-158, doi:10.16993/tellusa.2005.
- Hao, X., H. J. Wang, B. T. Zhou, J. D. Li, J. F. Wei, and T. T. Han, 2023: Ocean Surface Warming Pattern Inhibits El Nin?o-Induced Atmospheric Teleconnections. J. Clim., 36, 1521-1539, doi:10.1175/jcli-d-22-0275.1.
- Hawkins, E., and Coauthors, 2023: Rescuing historical weather observations improves quantification of severewindstorm risks. Natural Hazards and Earth System Sciences, 23, 1465-1482, doi:10.5194/nhess-23-1465-2023.
- He, C. F., A. C. Clement, S. M. Kramer, M. A. Cane, J. M. Klavans, T. M. Fenske, and L. N. Murphy, 2023: Tropical Atlantic multidecadal variability is dominated by external forcing. Nature, doi:10.1038/s41586-023-06489-4.
- He, Y. J., and Coauthors, 2023: Constraint of Air-Sea Interaction Significant to Skillful Predictions of North Pacific Climate Variations. J. Clim., 36, 5941-5962, doi:10.1175/jcli-d-22-0635.1.
- He, Y. J., B. Wang, L. J. Li, J. J. Liu, Y. Wang, and F. F. Li, 2023: Role of Ocean Initialization in Skillful Prediction of Sahel Rainfall on the Decadal Time Scale. J. Clim., 36, 2109-2129, doi:10.1175/jcli-d-21-0729.1.
- Heidemann, H., T. Cowan, B. J. Henley, J. Ribbe, M. Freund, and S. Power, 2023: Variability and long-term change in Australian monsoon rainfall: A review. Wiley Interdisciplinary Reviews-Climate Change, doi:10.1002/wcc.823.
- Herceg-Bulic, I., S. Ivasic, and M. Popovic, 2023: Impact of tropical SSTs on the late-winter signal over the North Atlantic-European region and contribution of midlatitude Atlantic. Npj Climate and Atmospheric Science, 6, doi:10.1038/s41612-023-00493-1.
- Hoell, A., T. Magadzire, A. McNally, and J. Eischeid, 2023: Multiyear dry periods in Southern Africa. International Journal of Climatology, 43, 3225-3246, doi:10.1002/joc.8026.
- Hörhold, M., and Coauthors, 2023: Modern temperatures in central-north Greenland warmest in past millennium. Nature, 613, 503-+, doi:10.1038/s41586-022-05517-z.
- Imfeld, N., L. Pfister, Y. Brugnara, and S. Broennimann, 2023: A 258-year-long data set of temperature and precipitation fields for Switzerland since 1763. Climate of the Past, 19, 703-729, doi:10.5194/cp-19-703-2023.
- Jebri, B., and M. Khodri, 2023: Large Ensemble Particle Filter for Spatial Climate Reconstructions Using a Linear Inverse Model. Journal of Advances in Modeling Earth Systems, 15, doi:10.1029/2022ms003094.
- Jiang, K., Y. Wang, Y. Sun, and J. Lan, 2023: The seasonal variation of shallow meridional overturning circulation in the South China Sea and the related dynamics. Ocean Modelling, 186, doi:10.1016/j.ocemod.2023.102242.
- Josey, S. A., J. P. Grist, J. V. Mecking, B. I. Moat, and E. Schulz, 2023: A clearer view of Southern Ocean air-sea interaction using surface heat flux asymmetry. Philosophical Transactions of the Royal Society a-Mathematical Physical and Engineering Sciences, 381, doi:10.1098/rsta.2022.0067.
- Josey, S. A., and K. Schroeder, 2023: Declining winter heat loss threatens continuing ocean convection at a Mediterranean dense water formation site. Environmental Research Letters, 18, doi:10.1088/1748-9326/aca9e4.
- Keizer, I., D. Le Bars, C. de Valk, A. Jüling, R. van de Wal, and S. Drijfhout, 2023: The acceleration of sea-level rise along the coast of the Netherlands started in the 1960s. Ocean Science, 19, 991-1007, doi:10.5194/os-19-991-2023.
- Kendon, M., M. McCarthy, S. Jevrejeva, A. Matthews, J. Williams, T. Sparks, and F. West, 2023: State of the UK Climate 2022. International Journal of Climatology, 43, 1-82, doi:10.1002/joc.8167.
- King, J., K. J. Anchukaitis, K. Allen, T. Vance, and A. Hessl, 2023: Trends and variability in the Southern Annular Mode over the Common Era. Nature Communications, 14, doi:10.1038/s41467-023-37643-1.
- Klotzbach, P. J., C. J. Schreck, G. P. Compo, K. M. Wood, E. C. J. Oliver, S. G. Bowen, and M. M. Bell, 2023: Influence of the Madden-Julian Oscillation on Continental United States Hurricane Landfalls. Geophysical Research Letters, 50, doi:10.1029/2023gl102762.
- Kolbe, M., R. Bintanja, and E. C. van der Linden, 2023: Seasonal and regional contrasts of future trends in interannual arctic climate variability. Climate Dynamics, doi:10.1007/s00382-023-06766-y.
- Lee, R., L. Chen, and G. Ren, 2023: A comparison of East-Asia landfall tropical cyclone in recent reanalysis datasets--before and after satellite era. Frontiers in Earth Science, 10, doi:10.3389/feart.2022.1026945.
- Li, D. L., Y. Chen, J. F. Qi, Y. C. Zhu, C. H. Lu, and B. S. Yin, 2023: Attribution of the July 2021 Record-Breaking Northwest Pacific Marine Heatwave to Global Warming, Atmospheric Circulation, and ENSO. Bulletin of the American Meteorological Society, 104, E291-E297, doi:10.1175/bams-d-22-0142.1.
- Li, M., G. W. Wang, F. Q. Cao, S. W. Zong, and X. R. Chai, 2023: Determining optimal probability distributions for gridded precipitation data based on L-moments. Science of the Total Environment, 882, doi:10.1016/j.scitotenv.2023.163528.
- Little, C. M., 2023: Coastal Sea Level Observations Record the Twentieth-Century Enhancement of Decadal Climate Variability. J. Clim., 36, 243-260, doi:10.1175/jcli-d-22-0451.1.
- Lou, J. L., M. Newman, and A. Hoell, 2023: Multi-decadal variation of ENSO forecast skill since the late 1800s. Npj Climate and Atmospheric Science, 6, doi:10.1038/s41612-023-00417-z.
- Lundstad, E., and Coauthors, 2023: The global historical climate database HCLIM. Scientific Data, 10, doi:10.1038/s41597-022-01919-w.
- Montero-Martín, J., M. Antón, J. M. Vaquero, R. Román, J. Vaquero-Martinez, A. J. P. Aparicio, and A. Sanchez-Lorenzo, 2023: Reconstruction of daily global solar radiation under all-sky and cloud-free conditions in Badajoz (Spain) since 1929. International Journal of Climatology, 43, 3523-3537, doi:10.1002/joc.8042.
- Morineau, C., Y. Boulanger, P. Gachon, S. Plante, and M. H. St-Laurent, 2023: Climate change alone cannot explain boreal caribou range recession in Quebec since 1850. Global Change Biology, doi:10.1111/gcb.16949.
- Muñoz, S. E., B. Hamilton, and B. Parazin, 2023: Contrasting Ocean-Atmosphere Dynamics Mediate Flood Hazard across the Mississippi River Basin. Earth Interactions, 27, doi:10.1175/ei-d-22-0015.1.
- O'Reilly, C. H., M. Patterson, J. Robson, P. A. Monerie, D. Hodson, and Y. Ruprich-Robert, 2023: Challenges with interpreting the impact of Atlantic Multidecadal Variability using SST-restoring experiments. Npj Climate and Atmospheric Science, 6, doi:10.1038/s41612-023-00335-0.
- Park, J. H., and Coauthors, 2023: Distinct decadal modulation of Atlantic-Nino influence on ENSO. Npj Climate and Atmospheric Science, 6, doi:10.1038/s41612-023-00429-9.
- Peng, S. L., C. Y. Wang, Z. Li, K. Mihara, K. Kuramochi, Y. Toma, and R. Hatano, 2023: Climate change multi-model projections in CMIP6 scenarios in Central Hokkaido, Japan. Scientific Reports, 13, doi:10.1038/s41598-022-27357-7.
- Peng, T. T., and Coauthors, 2023: Changes in Temperature-Precipitation Compound Extreme Events in China During the Past 119 Years. Earth and Space Science, 10, doi:10.1029/2022ea002777.
- Piskala, V., and R. Huth, 2023: Identifying Shifts in Modes of Low-Frequency Circulation Variability Using the 20CR Renalysis Ensemble. J. Clim., 36, 7771-7783, doi:10.1175/jcli-d-22-0620.1.
- Rateb, S. A. A., A. Srivastava, and B. Zerouali, 2023: On the role of land-surface hydrology schemes in simulating the daily maximum and minimum air temperatures of Australia using a regional climate model (RegCM4). Journal of Water and Climate Change, 14, 989-1011, doi:10.2166/wcc.2023.512.
- Renard, B., D. McInerney, S. Westra, M. Leonard, D. Kavetski, M. Thyer, and J. P. Vidal, 2023: Floods and Heavy Precipitation at the Global Scale: 100-Year Analysis and 180-Year Reconstruction. Journal of Geophysical Research-Atmospheres, 128, doi:10.1029/2022jd037908.
- Saha, P., R. Mahanta, and B. N. Goswami, 2023: Present and future of the South Asian summer monsoon's rainy season over Northeast India. Npj Climate and Atmospheric Science, 6, doi:10.1038/s41612-023-00485-1.
- Sandhya, M., and S. Sridharan, 2023: On drastic change in the relationship between snow cover and Indian monsoon rainfall. Journal of Earth System Science, 132, doi:10.1007/s12040-023-02115-z.
- Schurer, A. P., and Coauthors, 2023: Quantifying the contribution of forcing and three prominent modes of variability to historical climate. Climate of the Past, 19, 943-957, doi:10.5194/cp-19-943-2023.
- Schwertfeger, B. T., G. Lohmann, and H. Lipskoch, 2023: Introduction of the BiasAdjustCXX command-line tool for the application of fast and efficient bias corrections in climatic research. Softwarex, 22, doi:10.1016/j.softx.2023.101379.
- Shu, Q., Y. Zhang, D. J. A. Maya, S. M. Larson, Y. U. Kosaka, J. C. Yang, and X. P. Lin, 2023: Role of Ocean Advections during the Evolution of the Pacific Meridional Modes. J. Clim., 36, 4327-4343, doi:10.1175/jcli-d-22-0296.1.
- Stone, L., C. Strong, H. S. L. Bai, T. Reichler, G. McCabe, and P. D. Brooks, 2023: Atlantic-Pacific influence on western U.S. hydroclimate and water resources. Npj Climate and Atmospheric Science, 6, doi:10.1038/s41612-023-00471-7.
- Su, Y. B., J. A. Smith, and G. Villarini, 2023: Extreme Convective Rainfall and Flooding from Winter Season Extratropical Cyclones in the Mid-Atlantic Region of the United States. Journal of Hydrometeorology, 24, 497-520, doi:10.1175/jhm-d-22-0069.1.
- Su, Y. B., J. A. Smith, and G. Villarini, 2023: The Hydrometeorology of Extreme Floods in the Lower Mississippi River. Journal of Hydrometeorology, 24, 203-219, doi:10.1175/jhm-d-22-0024.1.
- Sueki, S., A. Ishii, S. Coppieters, and A. Yamanaka, 2023: Inverse characterization of a material model using an ensemble-based four-dimensional variational method. International Journal of Solids and Structures, 279, doi:10.1016/j.ijsolstr.2023.112350.
- Taylor, L. M., and G. J. Hakim, 2023: Skillful Coupled Atmosphere-Ocean Forecasts on Interannual to Decadal Timescales Using a Linear Inverse Model. Earth and Space Science, 10, doi:10.1029/2022ea002679.
- Teleti, P., E. Hawkins, and K. R. Wood, 2023: Digitizing weather observations from World War II US naval ship logbooks. Geoscience Data Journal, doi:10.1002/gdj3.222.
- Terao, T., and Coauthors, 2023: AsiaPEX Challenges and Prospects in Asian Precipitation Research. Bulletin of the American Meteorological Society, 104, E884-E908, doi:10.1175/bams-d-20-0220.1.
- Terray, L., 2023: A Storyline Approach to the June 2021 Northwestern North American Heatwave. Geophysical Research Letters, 50, doi:10.1029/2022gl101640.
- Vaideanu, P., C. Stepanek, M. Dima, J. Schrepfer, F. Matos, M. Ionita, and G. Lohmann, 2023: Large-scale sea ice-Surface temperature variability linked to Atlantic meridional overturning circulation. Plos One, 18, doi:10.1371/journal.pone.0290437.
- Veiga, S. F., and Coauthors, 2023: Climate change over South America simulated by the Brazilian Earth system model under RCP4.5 and RCP8.5 scenarios. Journal of South American Earth Sciences, 131, doi:10.1016/j.jsames.2023.104598.
- Viorica, N., R. Catalin-Constantin, M. Andrei, S. Marian-Ionut, P. Ionel, and I. Monica, 2023: The first tree-ring reconstrruction of streamflow variability over the last-250 years in the Lower Danube. Journal of Hydrology, 617, doi:10.1016/j.jhydrol.2023.129150.
- Wang, H., Z. G. Li, J. P. Li, X. P. Lin, X. T. Zheng, L. Fan, and Y. Zhang, 2023: Interannual variation in the East Asian summer monsoon-tropical Atlantic SST relationship modulated by the Interdecadal Pacific Oscillation. Npj Climate and Atmospheric Science, 6, doi:10.1038/s41612-023-00497-x.
- Wang, H., K. F. Yu, T. Han, S. D. Xu, S. C. Tao, S. H. Dang, and X. P. Yu, 2023: Orbital-Insolation Controlled Porites Coral d13C Seasonality Variations Since the Mid-Holocene in the Northern South China Sea. Geophysical Research Letters, 50, doi:10.1029/2022gl101284.
- Wang, X., R. Y. Lu, and X. W. Hong, 2023: Weakening of the Silk Road Pattern in August after the Mid-1990s. J. Clim., 36, 4275-4286, doi:10.1175/jcli-d-22-0762.1.
- Wang, X. L., Y. Feng, V. Y. S. Cheng, and H. Xu, 2023: Observed Precipitation Trends Inferred from Canada's Homogenized Monthly Precipitation Dataset. J. Clim., 36, 7957-7971, doi:10.1175/JCLI-D-23-0193.s1.
- Wang, Y. G., X. R. Wu, L. P. Jiang, F. Zheng, and S. Brune, 2023: Editorial: Recent advances in climate reanalysis. Frontiers in Climate, 5, doi:10.3389/fclim.2023.1158244.
- Wegmann, M., and F. Jaume-Santero, 2023: Artificial intelligence achieves easy-to-adapt nonlinear global temperature reconstructions using minimal local data. Communications Earth & Environment, 4, doi:10.1038/s43247-023-00872-9.
- Williams, S. L., and Coauthors, 2023: Relative sea-level changes in southeastern Australia during the 19th and 20th centuries. Journal of Quaternary Science, 38, 1184-1201, doi:10.1002/jqs.3528.
- Wu, C. H., S. Y. Lee, I. C. Tsai, C. J. Shiu, and Y. Y. Chen, 2023: Volcanic contribution to the 1990s North Pacific climate shift in winter. Scientific Reports, 13, doi:10.1038/s41598-023-32956-z.
- Xavier, A. K., H. Varikoden, C. A. Babu, and T. Reshma, 2023: Influence of PDO and ENSO with Indian summer monsoon rainfall and its changing relationship before and after 1976 climate shift. Climate Dynamics, doi:10.1007/s00382-023-06865-w.
- Xiang, B. Q., S. P. Xie, S. M. Kang, and R. J. Kramer, 2023: An emerging Asian aerosol dipole pattern reshapes the Asian summer monsoon and exacerbates northern hemisphere warming. Npj Climate and Atmospheric Science, 6, doi:10.1038/s41612-023-00400-8.
- Yao, S. L., J. J. Luo, P. S. Chu, and F. Zheng, 2023: Decadal variations of Pacific Walker circulation tied to tropical Atlantic-Pacific trans-basin SST gradients. Environmental Research Letters, 18, doi:10.1088/1748-9326/acd12f.
- Yeasmin, A., S. Chand, and N. Sultanova, 2023: Reconstruction of tropical cyclone and depression proxies for the South Pacific since the 1850s. Weather and Climate Extremes, 39, doi:10.1016/j.wace.2022.100543.
- Zhou, L. M., W. J. Hua, S. E. Nicholson, and J. P. Clark, 2023: Interannual teleconnections in the Sahara temperatures associated with the North Atlantic Oscillation (NAO) during boreal winter. Climate Dynamics, doi:10.1007/s00382-023-06962-w.
- Abermann, J., and Coauthors, 2023: Learning from Alfred Wegener's pioneering field observations in West Greenland after a century of climate change. Scientific Reports, 13, doi:10.1038/s41598-023-33225-9.
- Alexandrov, G. A., V. A. Ginzburg, G. E. Insarov, and A. A. Romanovskaya, 2021: CMIP6 model projections leave no room for permafrost to persist in Western Siberia under the SSP5-8.5 scenario. Climatic Change, 169, doi:10.1007/s10584-021-03292-w.
- Anderson, T. G., K. A. McKinnon, D. Pons, and K. J. Anchukaitis, 2023: How Exceptional Was the 2015-2019 Central American Drought? Geophysical Research Letters, 50, doi:10.1029/2023gl105391.
- Baatz, R., and Coauthors, 2021: Reanalysis in Earth System Science: Toward Terrestrial Ecosystem Reanalysis. Reviews of Geophysics, 59, doi:10.1029/2020rg000715.
- Badescu, V., N. Rotar, A. Dumitrescu, C. Oprea, and M. Paulescu, 2023: Solar global irradiance from actinometric degree data for Montsouris (Paris) 1873-1877. Theoretical and Applied Climatology, 153, 539-559, doi:10.1007/s00704-023-04485-2.
- Biswas, S., S. S. Chand, A. J. Dowdy, W. Wright, C. Foale, X. H. Zhao, and A. Deo, 2022: Statistical Calibration of Long-Term Reanalysis Data for Australian Fire Weather Conditions. Journal of Applied Meteorology and Climatology, 61, 729-758, doi:10.1175/jamc-d-21-0034.1.
- Borhara, K., B. Fosu, and S. Y. S. Wang, 2023: The role of the western North Pacific (WNP) as an El Nino-Southern Oscillation (ENSO) precursor in a warmer future climate. Climate Dynamics, doi:10.1007/s00382-023-06773-z.
- Bourdeau-Goulet, S. C., and E. Hassanzadeh, 2021: Comparisons Between CMIP5 and CMIP6 Models: Simulations of Climate Indices Influencing Food Security, Infrastructure Resilience, and Human Health in Canada. Earths Future, 9, doi:10.1029/2021ef001995.
- Brönnimann, S., 2022: Historical Observations for Improving Reanalyses. Frontiers in Climate, 4, doi:10.3389/fclim.2022.880473.
- Brönnimann, S., and Coauthors, 2022: Influence of warming and atmospheric circulation changes on multidecadal European flood variability. Climate of the Past, 18, 919-933, doi:10.5194/cp-18-919-2022.
- Burt, S. D., 2023: A twice-daily barometric pressure record from Durham Observatory in north-east England, 1843-1960. Geoscience Data Journal, 10, 3-17, doi:10.1002/gdj3.135.
- Cai, Z. Y., and Coauthors, 2023: Interdecadal variability of the warm Arctic-cold Eurasia pattern linked to the Barents oscillation. Atmospheric Research, 287, doi:10.1016/j.atmosres.2023.106712.
- Cerón, W. L., M. T. Kayano, R. V. Andreoli, A. Avila-Diaz, I. P. de Souza, and R. A. F. Souza, 2021: Pacific and Atlantic Multidecadal Variability Relations with the Choco and Caribbean Low-Level Jets during the 1900-2015 Period. Atmosphere, 12, doi:10.3390/atmos12091120.
- Chen, Y. F., Y. Du, and Z. S. Chen, 2023: Indo-western Pacific Ocean capacitor events recorded by coral proxies in the South China Sea. Palaeogeography Palaeoclimatology Palaeoecology, 609, doi:10.1016/j.palaeo.2022.111315.
- Churakova, O. V., and Coauthors, 2023: Climate impacts on tree-ring stable isotopes across the Northern Hemispheric boreal zone. Science of the Total Environment, 870, doi:10.1016/j.scitotenv.2023.161644.
- Crossett, C. C., L. A. L. Dupigny-Giroux, K. E. Kunkel, A. K. Betts, and A. Bomblies, 2023: Synoptic Typing of Multiduration, Heavy Precipitation Records in the Northeastern United States: 1895-2017. Journal of Applied Meteorology and Climatology, 62, 721-736, doi:10.1175/jamc-d-22-0091.1.
- Engdaw, M. M., A. K. Steiner, G. C. Hegerl, and A. P. Ballinger, 2023: Attribution of observed changes in extreme temperatures to anthropogenic forcing using CMIP6 models. Weather and Climate Extremes, 39, doi:10.1016/j.wace.2023.100548.
- Fallah, B., E. Russo, C. Menz, P. Hoffmann, I. Didovets, and F. F. Hattermann, 2023: Anthropogenic influence on extreme temperature and precipitation in Central Asia. Scientific Reports, 13, doi:10.1038/s41598-023-33921-6.
- Fan, Y. F., W. Liu, P. F. Zhang, R. Chen, and L. F. Li, 2023: North Atlantic Oscillation contributes to the subpolar North Atlantic cooling in the past century. Climate Dynamics, doi:10.1007/s00382-023-06847-y.
- Fox-Hughes, P., and Coauthors, 2022: A review of early severe weather applications of high-resolution regional reanalysis in Australia. Meteorological Applications, 29, doi:10.1002/met.2087.
- Gergis, J., Z. Baillie, S. Ingallina, L. Ashcroft, and T. Ellwood, 2021: A historical climate dataset for southwestern Australia, 1830-1875. International Journal of Climatology, 41, 4898-4919, doi:10.1002/joc.7105.
- Gillespie, I., L. Haimberger, G. P. Compo, and P. W. Thorne, 2023: Assessing homogeneity of land surface air temperature observations using sparse-input reanalyses. International Journal of Climatology, 43, 736-760, doi:10.1002/joc.7822.
- Ginzburg, A. S., G. A. Alexandrov, and A. V. Chernokulsky, 2022: Climatic Criteria of the Need for Preventive Adaptation. Izvestiya Atmospheric and Oceanic Physics, 58, 536-544, doi:10.1134/s0001433822060068.
- Godoy, M. R. V., and Y. Markonis, 2023: Water cycle changes in reanalyses: a complementary framework. Scientific Reports, 13, doi:10.1038/s41598-023-31873-5.
- Han, J., and V. P. Singh, 2021: Impacts of Rossby Wave Packets and Atmospheric Rivers on Meteorological Drought in the Continental United States. Water Resources Research, 57, doi:10.1029/2021wr029966.
- Harvey, B., E. Hawkins, and R. Sutton, 2023: Storylines for future changes of the North Atlantic jet and associated impacts on the UK. International Journal of Climatology, 43, 4424-4441, doi:10.1002/joc.8095.
- Hawkins, E., L. V. Alexander, and R. J. Allan, 2023: Millions of digitized historical sea-level pressure observations rediscovered. Geoscience Data Journal, 10, 385-395, doi:10.1002/gdj3.163.
- Hawkins, E., and Coauthors, 2023: Rescuing historical weather observations improves quantification of severewindstorm risks. Natural Hazards and Earth System Sciences, 23, 1465-1482, doi:10.5194/nhess-23-1465-2023.
- Horton, P., 2022: Analogue methods and ERA5: Benefits and pitfalls. International Journal of Climatology, 42, 4078-4096, doi:10.1002/joc.7484.
- Huang, J. Y., Q. X. Li, and Z. Y. Song, 2022: Historical global land surface air apparent temperature and its future changes based on CMIP6 projections. Science of the Total Environment, 816, doi:10.1016/j.scitotenv.2021.151656.
- Hyncica, M., and R. Huth, 2022: Temporal evolution of relationships between temperature and circulation modes in five reanalyses. International Journal of Climatology, 42, 4391-4404, doi:10.1002/joc.7474.
- Ionita, M., V. Nagavciuc, P. Scholz, and M. Dima, 2022: Long-term drought intensification over Europe driven by the weakening trend of the Atlantic Meridional Overturning Circulation. J Hydrol-Reg Stud, 42, doi:10.1016/j.ejrh.2022.101176.
- Karmalkar, A. V., and R. M. Horton, 2021: Drivers of exceptional coastal warming in the northeastern United States. Nature Climate Change, 11, 854-+, doi:10.1038/s41558-021-01159-7.
- Kettle, A. J., and C. Murphy, 2023: Deciphering extreme rainfall and historical floods at Easkey on the west coast of Ireland. Weather, doi:10.1002/wea.4452.
- Klotzbach, P. J., C. J. Schreck, G. P. Compo, K. M. Wood, E. C. J. Oliver, S. G. Bowen, and M. M. Bell, 2023: Influence of the Madden-Julian Oscillation on Continental United States Hurricane Landfalls. Geophysical Research Letters, 50, doi:10.1029/2023gl102762.
- Labe, Z. M., and E. A. Barnes, 2022: Comparison of Climate Model Large Ensembles With Observations in the Arctic Using Simple Neural Networks. Earth and Space Science, 9, doi:10.1029/2022ea002348.
- Lakkis, S. G., P. O. Canziani, J. O. Rodriquez, and A. E. Yuchechen, 2023: Early meteorological records from Corrientes and Bahia Blanca, Argentina: Initial ACRE-Argentina data rescue and related activities. Geoscience Data Journal, 10, 328-346, doi:10.1002/gdj3.176.
- Lieber, R., A. King, J. Brown, L. Ashcroft, M. Freund, and C. McMichael, 2022: ENSO Teleconnections More Uncertain in Regions of Lower Socioeconomic Development. Geophysical Research Letters, 49, doi:10.1029/2022gl100553.
- Lorrey, A. M., and Coauthors, 2022: Meteorological data rescue: Citizen science lessons learned from Southern Weather Discovery. Patterns, 3, doi:10.1016/j.patter.2022.100495.
- Lu, Z. C., T. B. Zhao, W. C. Zhou, and H. K. Zhao, 2022: Interdecadal Variation of the Antarctic Circumpolar Wave Based on the 20CRV3 Dataset. Atmosphere, 13, doi:10.3390/atmos13050736.
- Mahoney, K., C. McColl, D. M. Hultstrand, W. D. Kappel, B. McCormick, and G. P. Compo, 2022: Blasts from the Past Reimagining Historical Storms with Model Simulations to Modernize Dam Safety and Flood Risk Assessment. Bulletin of the American Meteorological Society, 103, E266-E280, doi:10.1175/bams-d-21-0133.1.
- Mo, R. P., 2022: Prequel to the Stories of Warm Conveyor Belts and Atmospheric Rivers The Moist Tongues Identified by Rossby and His Collaborators in the 1930s. Bulletin of the American Meteorological Society, 103, E1019-E1040, doi:10.1175/bams-d-20-0276.1.
- Morineau, C., Y. Boulanger, P. Gachon, S. Plante, and M. H. St-Laurent, 2023: Climate change alone cannot explain boreal caribou range recession in Quebec since 1850. Global Change Biology, doi:10.1111/gcb.16949.
- Nolin, A. F., M. P. Girardin, J. C. Tardif, X. J. Guo, F. Conciatori, and Y. Bergeron, 2022: A 247-year tree-ring reconstruction of spring temperature and relation to spring flooding in eastern boreal Canada. International Journal of Climatology, 42, 6479-6498, doi:10.1002/joc.7608.
- Pan, Z. T., S. Kumar, Y. J. Zhang, and C. H. Shi, 2022: Central Continental Boreal Summer "Warming Holes" Modulated by Atlantic Multidecadal Oscillation Via Low-Level Jets. Journal of Geophysical Research-Atmospheres, 127, doi:10.1029/2021jd035217.
- Pohl, B., A. Sturman, J. Renwick, H. Quénol, N. Fauchereau, A. Lorrey, and J. Pergaud, 2023: Precipitation and temperature anomalies over Aotearoa New Zealand analysed by weather types and descriptors of atmospheric centres of action. International Journal of Climatology, 43, 331-353, doi:10.1002/joc.7762.
- Przybylak, R., P. Wyszynski, and A. Arazny, 2022: Comparison of Early-Twentieth-Century Arctic Warming and Contemporary Arctic Warming in the Light of Daily and Subdaily Data. J. Clim., 35, 2269-2290, doi:10.1175/jcli-d-21-0162.1.
- Qiao, P. J., Z. Q. Gong, W. Q. Liu, Y. W. Zhang, G. L. Feng, and W. J. Dong, 2021: Extreme rainfall synchronization network between Southwest China and Asia-Pacific region. Climate Dynamics, 57, 3207-3221, doi:10.1007/s00382-021-05865-y.
- Reed, E. V., D. M. Thompson, and K. J. Anchukaitis, 2022: Coral-Based Sea Surface Salinity Reconstructions and the Role of Observational Uncertainties in Inferred Variability and Trends. Paleoceanography and Paleoclimatology, 37, doi:10.1029/2021pa004371.
- Reynolds, C. A., and Coauthors, 2023: Impacts of Northeastern Pacific Buoy Surface Pressure Observations. Monthly Weather Review, 151, 211-226, doi:10.1175/mwr-d-22-0124.1.
- Schurer, A. P., G. C. Hegerl, H. Goosse, M. A. Bollasina, M. H. England, D. M. Smith, and S. F. B. Tett, 2023: Role of multi-decadal variability of the winter North Atlantic Oscillation on Northern Hemisphere climate. Environmental Research Letters, 18, doi:10.1088/1748-9326/acc477.
- Shirley, I. A., and Coauthors, 2022: Near-Surface Hydrology and Soil Properties Drive Heterogeneity in Permafrost Distribution, Vegetation Dynamics, and Carbon Cycling in a Sub-Arctic Watershed. Journal of Geophysical Research-Biogeosciences, 127, doi:10.1029/2022jg006864.
- Viorica, N., R. Catalin-Constantin, M. Andrei, S. Marian-Ionut, P. Ionel, and I. Monica, 2023: The first tree-ring reconstrruction of streamflow variability over the last-250 years in the Lower Danube. Journal of Hydrology, 617, doi:10.1016/j.jhydrol.2023.129150.
- Wang, H., Z. G. Li, J. P. Li, X. P. Lin, X. T. Zheng, L. Fan, and Y. Zhang, 2023: Interannual variation in the East Asian summer monsoon-tropical Atlantic SST relationship modulated by the Interdecadal Pacific Oscillation. Npj Climate and Atmospheric Science, 6, doi:10.1038/s41612-023-00497-x.
- Wegmann, M., and F. Jaume-Santero, 2023: Artificial intelligence achieves easy-to-adapt nonlinear global temperature reconstructions using minimal local data. Communications Earth & Environment, 4, doi:10.1038/s43247-023-00872-9.
- Yang, Y., Q. X. Li, Z. Y. Song, W. B. Sun, and W. J. Dong, 2022: A comparison of global surface temperature variability, extremes and warming trend using reanalysis datasets and CMST-Interim. International Journal of Climatology, 42, 5609-5628, doi:10.1002/joc.7551.
- Yao, W. J., X. Q. Yan, Y. M. Tang, D. J. Yang, X. X. Tan, X. S. Song, and T. Liu, 2022: Multidecadal Variation in the Seasonal Predictability of Winter PNA and Its Sources. Geophysical Research Letters, 49, doi:10.1029/2022gl099393.
- Yilmaz, F., M. Tsamados, and D. Osborn, 2023: Digitizing Ottoman daily weather observations of Halkali Agricultural School in Istanbul, Turkiye (1896-1917). Geoscience Data Journal, doi:10.1002/gdj3.205.
- Yu, B., and Coauthors, 2022: Northern Hemisphere Extratropical Cyclone Activity in the Twentieth Century Reanalysis Version 3 (20CRv3) and Its Relationship with Continental Extreme Temperatures. Atmosphere, 13, doi:10.3390/atmos13081166.
- Yule, E. L., G. Hegerl, A. Schurer, and E. Hawkins, 2023: Using early extremes to place the 2022 UK heat waves into historical context. Atmospheric Science Letters, 24, doi:10.1002/asl.1159.
- Zaplotnik, Z., M. Pikovnik, and L. Boljka, 2022: Recent Hadley Circulation Strengthening: A Trend or Multidecadal Variability. J. Clim., 35, 4157-4176, doi:10.1175/jcli-d-21-0204.1.
- Anderson, G. B., A. Schumacher, and J. Done, 2022: Exposure Assessment for Tropical Cyclone Epidemiology. Current Environmental Health Reports, 9, 104-119, doi:10.1007/s40572-022-00333-z.
- Antico, A., and M. Vuille, 2022: ENSO and Parana flow variability: Long-term changes in their connectivity. International Journal of Climatology, 42, 7269-7279, doi:10.1002/joc.7643.
- Basharin, D., and G. Stankunavicius, 2022: European precipitation response to Indian ocean dipole events. Atmospheric Research, 273, doi:10.1016/j.atmosres.2022.106142.
- Birkel, S. D., P. A. Mayewski, L. B. Perry, A. Seimon, and M. Andrade-Flores, 2022: Evaluation of Reanalysis Temperature and Precipitation for the Andean Altiplano and Adjacent Cordilleras. Earth and Space Science, 9, doi:10.1029/2021ea001934.
- Biswas, S., S. S. Chand, A. J. Dowdy, W. Wright, C. Foale, X. H. Zhao, and A. Deo, 2022: Statistical Calibration of Long-Term Reanalysis Data for Australian Fire Weather Conditions. Journal of Applied Meteorology and Climatology, 61, 729-758, doi:10.1175/jamc-d-21-0034.1.
- Bliznak, V., L. Pokorna, and Z. Rulfova, 2022: Assessment of the capability of modern reanalyses to simulate precipitation in warm months using adjusted radar precipitation. J Hydrol-Reg Stud, 42, doi:10.1016/j.ejrh.2022.101121.
- Bokuchava, D. D., and V. A. Semenov, 2022: The role of natural fluctuations and factors of external forcing in the Early 20th Century Warming in Northern Hemisphere. Led I Sneg-Ice and Snow, 62, 455-474, doi:10.31857/s2076673422030144.
- Brönnimann, S., 2022: Historical Observations for Improving Reanalyses. Frontiers in Climate, 4, doi:10.3389/fclim.2022.880473.
- Callahan, C. W., and J. S. Mankin, 2022: National attribution of historical climate damages. Climatic Change, 172, doi:10.1007/s10584-022-03387-y.
- Chand, S. S., and Coauthors, 2022: Declining tropical cyclone frequency under global warming. Nature Climate Change, 12, 655-+, doi:10.1038/s41558-022-01388-4.
- Chen, H. C., and F. F. Jin, 2022: Dynamics of ENSO Phase-Locking and Its Biases in Climate Models. Geophysical Research Letters, 49, doi:10.1029/2021gl097603.
- Chen, K. F., and Coauthors, 2022: Modulating and Resetting Impacts of Different Volcanic Eruptions on North Atlantic SST Variations. Journal of Geophysical Research-Atmospheres, 127, doi:10.1029/2021jd036246.
- Chen, L., and T. W. Ford, 2023: Future changes in the transitions of monthly-to-seasonal precipitation extremes over the Midwest in Coupled Model Intercomparison Project Phase 6 models. International Journal of Climatology, 43, 255-274, doi:10.1002/joc.7756.
- Chen, Z., B. L. Gan, F. Huang, J. P. Li, L. X. Wu, L. Fan, and Y. N. Diao, 2022: The influence of Pacific-North American teleconnection on the North Pacific SST anomalies in Wintertime under the global warming. Climate Dynamics, doi:10.1007/s00382-022-06398-8.
- Chen, Z. H., P. Q. Wang, S. L. Bao, and W. M. Zhang, 2022: Rapid reconstruction of temperature and salinity fields based on machine learning and the assimilation application. Frontiers in Marine Science, 9, doi:10.3389/fmars.2022.985048.
- Chih, C. H., K. H. Chou, and C. C. Wu, 2022: Idealized simulations of tropical cyclones with thermodynamic conditions under reanalysis and CMIP5 scenarios. Geoscience Letters, 9, doi:10.1186/s40562-022-00239-6.
- Chowdary, J. S., T. S. Saikrishna, D. A. Ramu, P. Darshana, A. Parekh, C. Gnanaseelan, and K. K. Osuri, 2023: Symmetric and asymmetric response of Indian Summer Monsoon rainfall to different ENSO decay phases in observations and CMIP6 models. Global and Planetary Change, 220, doi:10.1016/j.gloplacha.2022.104000.
- Christiansen, B., S. T. Yang, and D. Matte, 2022: The Forced Response and Decadal Predictability of the North Atlantic Oscillation: Nonstationary and Fragile Skills. J. Clim., 35, 5869-5882, doi:10.1175/jcli-d-21-0807.1.
- Codilean, A. T., and Coauthors, 2022: OCTOPUS database (v.2). Earth System Science Data, 14, 3695-3713, doi:10.5194/essd-14-3695-2022.
- Cresswell-Clay, N., C. C. Ummenhofer, D. L. Thatcher, A. D. Wanamaker, R. F. Denniston, Y. Asmerom, and V. J. Polyak, 2022: Twentieth-century Azores High expansion unprecedented in the past 1,200 years. Nature Geoscience, 15, 548-+, doi:10.1038/s41561-022-00971-w.
- Creutin, J. D., J. Blanchet, A. Reverdy, A. Brochet, C. Lutoff, and Y. Robert, 2022: Reported Occurrence of Multiscale Flooding in an Alpine Conurbation over the Long Run (1850-2019). Water, 14, doi:10.3390/w14040548.
- Cui, J. X., and T. Li, 2022: Changes in MJO Characteristics and Impacts in the Past Century. J. Clim., 35, 577-590, doi:10.1175/jcli-d-21-0306.1.
- Cwik, P., R. A. McPherson, M. B. Richman, and A. E. Mercer, 2023: Climatology of 500-hPa geopotential height anomalies associated with May tornado outbreaks in the United States. International Journal of Climatology, 43, 893-913, doi:10.1002/joc.7841.
- Darshana, P., J. S. Chowdary, A. Parekh, and C. Gnanaseelan, 2022: Relationship between the Indo-western Pacific Ocean capacitor mode and Indian summer monsoon rainfall in CMIP6 models. Climate Dynamics, 59, 393-415, doi:10.1007/s00382-021-06133-9.
- Diao, C. R., and Y. Y. Xu, 2022: Reassessing the relative role of anthropogenic aerosols and natural decadal variability in driving the mid-twentieth century global "cooling": a focus on the latitudinal gradient of tropospheric temperature. Climate Dynamics, 59, 2655-2681, doi:10.1007/s00382-022-06235-y.
- Diarra, A., and Coauthors, 2022: Medium-Resolution Mapping of Evapotranspiration at the Catchment Scale Based on Thermal Infrared MODIS Data and ERA-Interim Reanalysis over North Africa. Remote Sensing, 14, doi:10.3390/rs14205071.
- Diouf, I., and Coauthors, 2022: Oceanic Influence on Seasonal Malaria Incidence in West Africa. Weather Climate and Society, 14, 287-302, doi:10.1175/wcas-d-20-0160.1.
- Dong, J. Z., F. N. Lei, and W. T. Crow, 2022: Land transpiration-evaporation partitioning errors responsible for modeled summertime warm bias in the central United States. Nature Communications, 13, doi:10.1038/s41467-021-27938-6.
- Dutta, A., and J. M. Neena, 2022: Exploring the circum-global teleconnection-Indian summer monsoon interactions in the interannual and multidecadal timescales. Frontiers in Earth Science, 10, doi:10.3389/feart.2022.973468.
- Dwivedi, S., P. Pandey, and B. N. Goswami, 2022: Nonstationarity and potential multi-decadal variability in Indian Summer Monsoon Rainfall and Southern Annular Mode teleconnection. Climate Dynamics, 59, 671-683, doi:10.1007/s00382-022-06146-y.
- Egli, M., S. Sippel, A. G. Pendergrass, I. de Vries, and R. Knutti, 2022: Reconstruction of Zonal Precipitation From Sparse Historical Observations Using Climate Model Information and Statistical Learning. Geophysical Research Letters, 49, doi:10.1029/2022gl099826.
- Ehmele, F., and Coauthors, 2022: Adaptation and application of the large LAERTES-EU regional climate model ensemble for modeling hydrological extremes: a pilot study for the Rhine basin. Natural Hazards and Earth System Sciences, 22, 677-692, doi:10.5194/nhess-22-677-2022.
- Fang, M., X. Li, H. W. Chen, and D. L. Chen, 2022: Arctic amplification modulated by Atlantic Multidecadal Oscillation and greenhouse forcing on multidecadal to century scales. Nature Communications, 13, doi:10.1038/s41467-022-29523-x.
- Fazel-Rastgar, F., and V. Sivakumar, 2022: A severe weather system accompanied by a stratospheric intrusion during unusual warm winter in 2015 over the South Africa: An initial synoptic analysis. Remote Sensing Applications-Society and Environment, 28, doi:10.1016/j.rsase.2022.100833.
- Finkenbinder, M. S., and Coauthors, 2022: A 5000-year lacustrine sediment oxygen isotope record of late Holocene climate change in Newfoundland, Canada. Quaternary Science Reviews, 278, doi:10.1016/j.quascirev.2022.107376.
- Fraga, H., N. Guimaraes, T. R. Freitas, A. C. Malheiro, and J. A. Santos, 2022: Future Scenarios for Olive Tree and Grapevine Potential Yields in the World Heritage Coa Region, Portugal. Agronomy-Basel, 12, doi:10.3390/agronomy12020350.
- Frazao, H. C., R. D. Prien, D. E. Schulz-Bull, D. Seidov, and J. J. Waniek, 2022: The Forgotten Azores Current: A Long-Term Perspective. Frontiers in Marine Science, 9, doi:10.3389/fmars.2022.842251.
- Frederiksen, J. S., and S. L. Osbrough, 2022: Tipping Points and Changes in Australian Climate and Extremes. Climate, 10, doi:10.3390/cli10050073.
- Fu, Z., P. C. Hsu, J. Li, J. Cao, Y. M. Yang, and F. Liu, 2022: Multidecadal Changes in Zonal Displacement of Tropical Pacific MJO Variability Modulated by North Atlantic SST. J. Clim., 35, 5951-5966, doi:10.1175/jcli-d-21-0819.1.
- Gao, X., and Coauthors, 2022: Evaluation of Sea Ice Simulation of CAS-ESM 2.0 in Historical Experiment. Atmosphere, 13, doi:10.3390/atmos13071056.
- Gibson, A. J., D. C. Verdon-Kidd, and G. R. Hancock, 2022: Characterising the seasonal nature of meteorological drought onset and termination across Australia. Journal of Southern Hemisphere Earth Systems Science, 72, 38-51, doi:10.1071/es21009.
- Gillespie, I., L. Haimberger, G. P. Compo, and P. W. Thorne, 2023: Assessing homogeneity of land surface air temperature observations using sparse-input reanalyses. International Journal of Climatology, 43, 736-760, doi:10.1002/joc.7822.
- Guan, X. D., Z. K. Gao, J. P. Huang, C. Y. Cao, K. W. Zhu, and J. M. Wang, 2022: Speeding extreme cold events under global warming. Environmental Research Letters, 17, doi:10.1088/1748-9326/ac8110.
- Hallam, S., S. A. Josey, G. D. McCarthy, and J. J. M. Hirschi, 2022: A regional (land-ocean) comparison of the seasonal to decadal variability of the Northern Hemisphere jet stream 1871-2011. Climate Dynamics, 59, 1897-1918, doi:10.1007/s00382-022-06185-5.
- Hamill, T. M., and Coauthors, 2022: The Reanalysis for the Global Ensemble Forecast System, Version 12. Monthly Weather Review, 150, 59-79, doi:10.1175/mwr-d-21-0023.1.
- Han, S. Z., H. L. Ren, B. H. Su, and J. X. Li, 2022: Connection between the North Atlantic sea surface temperature and the late autumn snow cover anomalies over the central Tibetan Plateau. Atmospheric Research, 279, doi:10.1016/j.atmosres.2022.106405.
- Hardouin, L., and Coauthors, 2022: Uncertainty in land carbon budget simulated by terrestrial biosphere models: the role of atmospheric forcing. Environmental Research Letters, 17, doi:10.1088/1748-9326/ac888d.
- Harvey, P. J., and S. W. Grab, 2022: Australian sub-regional temperature responses to volcanic forcing: A critical analysis using CMIP5 models. International Journal of Climatology, 42, 6109-6125, doi:10.1002/joc.7580.
- Haslinger, K., and K. Mayer, 2023: Early spring droughts in Central Europe: Indications for atmospheric and oceanic drivers. Atmospheric Science Letters, 24, doi:10.1002/asl.1136.
- Hong, X., and J. Li, 2022: Typhoon wind hazard analysis using the decoupling approach. Wind and Structures, 35, 287-296, doi:10.12989/was.2022.35.4.287.
- Horwath, M., and Coauthors, 2022: Global sea-level budget and ocean-mass budget, with a focus on advanced data products and uncertainty characterisation. Earth System Science Data, 14, 411-447, doi:10.5194/essd-14-411-2022.
- Huang, H. L., and Coauthors, 2022: Changes in Mechanisms and Characteristics of Western US Floods Over the Last Sixty Years. Geophysical Research Letters, 49, doi:10.1029/2021gl097022.
- Hudson, A. R., W. K. Smith, D. J. P. Moore, and V. Trouet, 2022: Length of growing season is modulated by Northern Hemisphere jet stream variability. International Journal of Climatology, 42, 5644-5660, doi:10.1002/joc.7553.
- Kayano, M. T., W. L. Cerón, R. V. Andreoli, R. A. F. Souza, A. Avila-Diaz, C. F. Zuluaga, and L. M. V. Carvalho, 2022: Does the El Nino-Southern Oscillation Affect the Combined Impact of the Atlantic Multidecadal Oscillation and Pacific Decadal Oscillation on the Precipitation and Surface Air Temperature Variability over South America? Atmosphere, 13, doi:10.3390/atmos13020231.
- Kotal, S. D., and S. K. Bhattacharya, 2023: Impact of evolution of initial conditions in tropical cyclone forecasting. Natural Hazards, 115, 807-837, doi:10.1007/s11069-022-05575-6.
- Kotsuki, S., T. Miyoshi, K. Kondo, and R. Potthast, 2022: A local particle filter and its Gaussian mixture extensionimplemented with minor modifications to the LETKF. Geoscientific Model Development, 15, 8325-8348, doi:10.5194/gmd-15-8325-2022.
- Kunz, M., C. Kottmeier, W. Lähne, I. Bertram, and C. Ehmann, 2022: The Karlsruhe temperature time series since 1779. Meteorologische Zeitschrift, 31, 175-202, doi:10.1127/metz/2022/1106.
- Labrousse, C., W. Ludwig, S. Pinel, M. Sadaoui, A. Toreti, and G. Lacquement, 2022: Declining water resources in response to global warming and changes inatmospheric circulation patterns over southern Mediterranean France. Hydrology and Earth System Sciences, 26, 6055-6071, doi:10.5194/hess-26-6055-2022.
- Lai, W. K. M., J. I. Robson, L. J. Wilcox, and N. Dunstone, 2022: Mechanisms of Internal Atlantic Multidecadal Variability in HadGEM3-GC3.1 at Two Different Resolutions. J. Clim., 35, 1365-1383, doi:10.1175/jcli-d-21-0281.1.
- Li, L. H., and S. L. Li, 2022: A Comparison of Two 20th Century Reanalysis Datasets from the Perspective of Cross-Equatorial Flows. Journal of the Meteorological Society of Japan, 100, 807-824, doi:10.2151/jmsj.2022-042.
- Li, X. L., and Coauthors, 2022: A Comparison of Land Surface Phenology in the Northern Hemisphere Derived from Satellite Remote Sensing and the Community Land Model. Journal of Hydrometeorology, 23, 859-873, doi:10.1175/jhm-d-21-0169.1.
- Li, Y. D., X. C. Li, S. P. Xie, G. Zhang, Z. Wang, W. Z. Wang, and Y. R. Hou, 2022: Regional Perspective of Hadley Circulation and Its Uncertainties Among Different Datasets: Spread in Reanalysis Datasets. Journal of Geophysical Research-Atmospheres, 127, doi:10.1029/2022jd036940.
- Lieber, R., A. King, J. Brown, L. Ashcroft, M. Freund, and C. McMichael, 2022: ENSO Teleconnections More Uncertain in Regions of Lower Socioeconomic Development. Geophysical Research Letters, 49, doi:10.1029/2022gl100553.
- Ling, F. H., J. J. Luo, Y. Li, T. Tang, L. Bai, W. L. Ouyang, and T. Yamagata, 2022: Multi-task machine learning improves multi-seasonal prediction of the Indian Ocean Dipole. Nature Communications, 13, doi:10.1038/s41467-022-35412-0.
- Liu, Y. J., Y. G. Zhang, N. Shan, Z. Y. Zhang, and Z. W. Wei, 2022: Global assessment of partitioning transpiration from evapotranspiration based on satellite solar-induced chlorophyll fluorescence data. Journal of Hydrology, 612, doi:10.1016/j.jhydrol.2022.128044.
- Lopes, A. B., R. V. Andreoli, R. A. F. Souza, W. L. Cerón, M. T. Kayano, T. Canchala, and D. S. de Moraes, 2022: Multiyear La Nina effects on the precipitation in South America. International Journal of Climatology, 42, 9567-9582, doi:10.1002/joc.7847.
- Lorrey, A. M., and Coauthors, 2022: Meteorological data rescue: Citizen science lessons learned from Southern Weather Discovery. Patterns, 3, doi:10.1016/j.patter.2022.100495.
- Lu, Y., Y. L. Li, J. Duan, P. F. Lin, and F. Wang, 2022: Multidecadal Sea Level Rise in the Southeast Indian Ocean: The Role of Ocean Salinity Change. J. Clim., 35, 1479-1496, doi:10.1175/jcli-d-21-0288.1.
- Lu, Y. L., J. Q. Feng, F. Jia, and D. X. Hu, 2022: Interdecadal Change in the Relationship Between the El Nino-Southern Oscillation and the North/South Pacific Meridional Mode. Journal of Geophysical Research-Oceans, 127, doi:10.1029/2021jc018284.
- Luo, M., J. M. Feng, Z. F. Xu, J. Wang, and L. Dan, 2022: Numerical simulation and cause analysis of persistent summer drought during the 1920s in eastern China. Science China-Earth Sciences, 65, 966-982, doi:10.1007/s11430-021-9891-9.
- Lyu, A., and Q. Z. Yin, 2022: The spatial-temporal patterns of East Asian climate in response to insolation, CO2 and ice sheets during MIS-5. Quaternary Science Reviews, 293, doi:10.1016/j.quascirev.2022.107689.
- Mahoney, K., C. McColl, D. M. Hultstrand, W. D. Kappel, B. McCormick, and G. P. Compo, 2022: Blasts from the Past Reimagining Historical Storms with Model Simulations to Modernize Dam Safety and Flood Risk Assessment. Bulletin of the American Meteorological Society, 103, E266-E280, doi:10.1175/bams-d-21-0133.1.
- Marshall, G. J., R. L. Fogt, J. Turner, and K. R. Clem, 2022: Can current reanalyses accurately portray changes in Southern Annular Mode structure prior to 1979? Climate Dynamics, 59, 3717-3740, doi:10.1007/s00382-022-06292-3.
- McKenna, C. M., and A. C. Maycock, 2022: The Role of the North Atlantic Oscillation for Projections of Winter Mean Precipitation in Europe. Geophysical Research Letters, 49, doi:10.1029/2022gl099083.
- McPhaden, M. J., and C. Karamperidou, 2022: La Nina Came to Eden. Bulletin of the American Meteorological Society, 103, E2862-E2877, doi:10.1175/bams-d-21-0343.1.
- Mezzina, B., J. García-Serrano, T. Ambrizzi, D. Matei, E. Manzini, and I. Bladé, 2023: Tropospheric pathways of the late-winter ENSO teleconnection to Europe. Climate Dynamics, 60, 3307-3317, doi:10.1007/s00382-022-06508-6.
- Mo, R. P., 2022: Prequel to the Stories of Warm Conveyor Belts and Atmospheric Rivers The Moist Tongues Identified by Rossby and His Collaborators in the 1930s. Bulletin of the American Meteorological Society, 103, E1019-E1040, doi:10.1175/bams-d-20-0276.1.
- Mohanty, M. P., and S. P. Simonovic, 2022: A Comprehensive Approach for Floodplain Mapping through Identification of Hazard Using Publicly Available Data Sets over Canada. Water, 14, doi:10.3390/w14142280.
- Mok, H. Y., and Coauthors, 2022: A historical re-analysis of the calamitous midget typhoon passing through Hong Kong on 18 September 1906 and its storm surge impact to Hong Kong. Tropical Cyclone Research and Review, 11, 174-218, doi:10.1016/j.tcrr.2022.09.005.
- Mondal, P., and S. Chaudhuri, 2022: Temporal variability in the withdrawal phase of southwest monsoon over India and related consequences in northeast monsoon: a climatological perspective. Theoretical and Applied Climatology, 148, 1021-1034, doi:10.1007/s00704-022-03979-9.
- Monteverde, C., F. De Sales, and C. Jones, 2022: Evaluation of the CMIP6 Performance in Simulating Precipitation in the Amazon River Basin. Climate, 10, doi:10.3390/cli10080122.
- Noad, N. C., and P. P. Bonnaventure, 2022: Surface temperature inversion characteristics in dissimilar valleys, Yukon Canada. Arctic Science, doi:10.1139/as-2021-0048.
- Oksman, M., and Coauthors, 2022: Impact of freshwater runoff from the southwest Greenland Ice Sheet on fjord productivity since the late 19th century. Cryosphere, 16, 2471-2491, doi:10.5194/tc-16-2471-2022.
- Omrani, N. E., N. Keenlyside, K. Matthes, L. Boljka, D. Zanchettin, J. H. Jungclaus, and S. W. Lubis, 2022: Coupled stratosphere-troposphere-Atlantic multidecadal oscillation and its importance for near-future climate projection. Npj Climate and Atmospheric Science, 5, doi:10.1038/s41612-022-00275-1.
- Pandey, P., S. Dwivedi, and B. N. Goswami, 2022: Trend and variability in the long-term relationship between Eurasian snow cover and Indian summer monsoon rainfall. International Journal of Climatology, 42, 7751-7765, doi:10.1002/joc.7675.
- Pei, L., Z. W. Yan, D. L. Chen, and S. G. Miao, 2022: The Contribution of Human-Induced Atmospheric Circulation Changes to the Record-Breaking Winter Precipitation Event over Beijing in February 2020. Bulletin of the American Meteorological Society, 103, S55-S60, doi:10.1175/bams-d-21-0153.1.
- Peña, J. C., and Coauthors, 2022: Low-Frequency Atmospheric Variability Patterns and Synoptic Types Linked to Large Floods in the Lower Ebro River Basin. J. Clim., 35, 2351-2371, doi:10.1175/jcli-d-20-0394.1.
- Penland, C., and P. D. Sardeshmukh, 2022: A mechanism for the skew of ensemble forecasts. Quarterly Journal of the Royal Meteorological Society, 148, 1131-1143, doi:10.1002/qj.4251.
- Pronk, V., and Coauthors, 2022: Can reanalysis products outperform mesoscale numerical weather prediction models in modeling the wind resource in simple terrain? Wind Energy Science, 7, 487-504, doi:10.5194/wes-7-487-2022.
- Qian, D. W., Y. Y. Huang, and H. J. Wang, 2022: A preliminary attempt on decadal prediction of the East Asian summer monsoon. Theoretical and Applied Climatology, 148, 1499-1511, doi:10.1007/s00704-022-04011-w.
- Qu, Y., S. Jevrejeva, J. Williams, and J. C. Moore, 2022: Drivers for seasonal variability in sea level around the China seas. Global and Planetary Change, 213, doi:10.1016/j.gloplacha.2022.103819.
- Reddy, P. J., S. E. Perkins-Kirkpatrick, N. N. Ridder, and J. J. Sharples, 2022: Combined role of ENSO and IOD on compound drought and heatwaves in Australia using two CMIP6 large ensembles. Weather and Climate Extremes, 37, doi:10.1016/j.wace.2022.100469.
- Ren, Y. Y., G. Y. Ren, R. Allan, J. Li, G. W. Yang, and P. F. Zhang, 2022: The 1757-62 Temperature Observed in Beijing. Bulletin of the American Meteorological Society, 103, E2470-E2483, doi:10.1175/bams-d-21-0245.1.
- Renard, B., M. Thyer, D. McInerney, D. Kavetski, M. Leonard, and S. Westra, 2022: A Hidden Climate Indices Modeling Framework for Multivariable Space-Time Data. Water Resources Research, 58, doi:10.1029/2021wr030007.
- Renteria-Villalobos, M., R. T. Hanson, and C. Eastoe, 2022: Evaluation of climate variability on sustainability for transboundary water supply in Chihuahua, Mexico. J Hydrol-Reg Stud, 44, doi:10.1016/j.ejrh.2022.101207.
- Rimbu, N., M. Ionita, and G. Lohmann, 2022: Interdecadal Pacific Oscillation in Northern Greenland Dust Concentration Variability During the Last 400 Years. Geophysical Research Letters, 49, doi:10.1029/2022gl101500.
- Rogers, M. H., J. C. Furtado, and B. T. Anderson, 2022: The pacific decadal precession and its relationship to tropical pacific decadal variability in CMIP6 models. Climate Dynamics, 59, 23-40, doi:10.1007/s00382-021-06114-y.
- Roibu, C. C., V. Nagavciuc, M. Ionita, I. Popa, S. A. Horodnic, A. Mursa, and U. Büntgen, 2022: A tree ring-based hydroclimate reconstruction for eastern Europe reveals large-scale teleconnection patterns. Climate Dynamics, 59, 2979-2994, doi:10.1007/s00382-022-06255-8.
- Rojas-Labanda, C., F. González-Rouco, E. García-Bustamante, J. Navarro, E. E. Lucio-Eceiza, G. van der Schrier, and F. Kaspar, 2023: Surface wind over Europe: Data and variability. International Journal of Climatology, 43, 134-156, doi:10.1002/joc.7739.
- Rossby, T., J. Palter, and K. Donohue, 2022: What Can Hydrography Between the New England Slope, Bermuda and Africa Tell us About the Strength of the AMOC Over the Last 90 years? Geophysical Research Letters, 49, doi:10.1029/2022gl099173.
- Roustan, J. B., L. Pineau-Guillou, B. Chapron, N. Raillard, and M. Reinert, 2022: Shift of the storm surge season in Europe due to climate variability. Scientific Reports, 12, doi:10.1038/s41598-022-12356-5.
- Rutgersson, A., and Coauthors, 2022: Natural hazards and extreme events in the Baltic Sea region. Earth System Dynamics, 13, 251-301, doi:10.5194/esd-13-251-2022.
- Shiogama, H., M. Watanabe, H. Kim, and N. Hirota, 2022: Emergent constraints on future precipitation changes. Nature, 602, 612-+, doi:10.1038/s41586-021-04310-8.
- Smedsrud, L. H., and Coauthors, 2022: Nordic Seas Heat Loss, Atlantic Inflow, and Arctic Sea Ice Cover Over the Last Century. Reviews of Geophysics, 60, doi:10.1029/2020rg000725.
- Song, K. X., J. W. Zhao, R. F. Zhan, L. Tao, and L. Chen, 2022: Confidence and Uncertainty in Simulating Tropical Cyclone Long-Term Variability Using the CMIP6-HighResMIP. J. Clim., 35, 2829-2849, doi:10.1175/jcli-d-21-0875.1.
- Soster, F., and R. Parfitt, 2022: On Objective Identification of Atmospheric Fronts and Frontal Precipitation in Reanalysis Datasets. J. Clim., 35, 4513-4534, doi:10.1175/jcli-d-21-0596.1.
- Steffelbauer, D. B., R. E. M. Riva, J. S. Timmermans, J. H. Kwakkel, and M. Bakker, 2022: Evidence of regional sea-level rise acceleration for the North Sea. Environmental Research Letters, 17, doi:10.1088/1748-9326/ac753a.
- Steptoe, H., C. Souch, and J. Slingo, 2022: Advances in numerical weather prediction, data science, and open-source software herald a paradigm shift in catastrophe risk modeling and insurance underwriting. Risk Management and Insurance Review, 25, 69-81, doi:10.1111/rmir.12199.
- Sun, J. Z., and Coauthors, 2022: An online ensemble coupled data assimilation capability for the Community Earth System Model: system design and evaluation. Geoscientific Model Development, 15, 4805-4830, doi:10.5194/gmd-15-4805-2022.
- Sun, X. T., and Coauthors, 2022: Enhanced jet stream waviness induced by suppressed tropical Pacific convection during boreal summer. Nature Communications, 13, doi:10.1038/s41467-022-28911-7.
- Sun, Y. B., and Coauthors, 2022: A review of orbital-scale monsoon variability and dynamics in East Asia during the Quaternary. Quaternary Science Reviews, 288, doi:10.1016/j.quascirev.2022.107593.
- Tadesse, M. G., T. Wahl, M. M. Rashid, S. Dangendorf, A. Rodríguez-Enríquez, and S. A. Talke, 2022: Long-term trends in storm surge climate derived from an ensemble of global surge reconstructions. Scientific Reports, 12, doi:10.1038/s41598-022-17099-x.
- Tao, L. J., and W. S. Duan, 2022: A novel precursory signal of the Central Pacific El Nino event: Eastern Pacific cooling mode. Climate Dynamics, 59, 2599-2617, doi:10.1007/s00382-022-06229-w.
- Tao, W. C., X. W. Kong, Y. Liu, Y. Wang, and D. H. Dong, 2022: Diversity of Northwest Pacific atmospheric circulation anomalies during post-ENSO summer. Frontiers in Environmental Science, 10, doi:10.3389/fenvs.2022.1068155.
- Teng, H. Y., R. Leung, G. Branstator, J. Lu, and Q. H. Ding, 2022: Warming Pattern over the Northern Hemisphere Midlatitudes in Boreal Summer 1979-2020. J. Clim., 35, 3479-3494, doi:10.1175/jcli-d-21-0437.1.
- Thatcher, D. L., and Coauthors, 2022: Iberian hydroclimate variability and the Azores High during the last 1200 years: evidence from proxy records and climate model simulations. Climate Dynamics, doi:10.1007/s00382-022-06427-6.
- Trinh, T., A. Diaz, Y. Iseri, E. Snider, M. L. Anderson, K. J. Carr, and M. L. Kavvas, 2022: A numerical coupled atmospheric-hydrologic modeling system for probable maximum flood estimation with application to California's southern Sierra Nevada foothills watersheds. Journal of Flood Risk Management, doi:10.1111/jfr3.12809.
- Trinh, T., Y. Iseri, A. J. Diaz, E. D. Snider, M. L. Anderson, and M. L. Kavvas, 2022: Maximization of Historical Storm Events over Seven Watersheds in Central/Southern Sierra Nevada by Means of Atmospheric Boundary Condition Shifting and Relative Humidity Optimization Methods. J Hydrol Eng, 27, doi:10.1061/(asce)he.1943-5584.0002159.
- Tucker, C. S., J. K. Pearl, E. A. Elliott, J. C. Bregy, J. M. Friedman, and M. D. Therrell, 2022: Baldcypress false ring formation linked to summer hydroclimatic extremes in the southeastern United States. Environmental Research Letters, 17, doi:10.1088/1748-9326/ac9745.
- Vashisht, A., and B. Zaitchik, 2022: Modulation of East African Boreal Fall Rainfall: Combined Effects of the Madden-Julian Oscillation (MJO) and El Nino-Southern Oscillation (ENSO). J. Clim., 35, 2019-2034, doi:10.1175/jcli-d-21-0583.1.
- Wade, M., B. Rodríguez-Fonseca, M. Martín-Rey, A. Lazar, J. López-Parages, and A. T. Gaye, 2023: Interdecadal changes in SST variability drivers in the Senegalese-upwelling: the impact of ENSO. Climate Dynamics, 60, 667-685, doi:10.1007/s00382-022-06311-3.
- Wahl, E., E. Zorita, and A. Hoell, 2022: The Kalman Filter as Post-Processor for Analog Data-Model Assimilation in Paleoclimate Reconstruction. J. Clim., 35, 5501-5518, doi:10.1175/jcli-d-21-0454.1.
- Wang, D. D., Y. H. Chen, L. Q. Hu, J. A. Voogt, and X. Y. He, 2022: Satellite-based daytime urban thermal anisotropy: A comparison of 25 global cities. Remote Sens Environ, 283, doi:10.1016/j.rse.2022.113312.
- Wang, G. J., and Coauthors, 2022: Future Southern Ocean warming linked to projected ENSO variability. Nature Climate Change, 12, 649-+, doi:10.1038/s41558-022-01398-2.
- Wang, J., and Coauthors, 2022: Synergistic impacts of westerlies and monsoon on interdecadal variations of late spring precipitation over the southeastern extension of the Tibetan Plateau. International Journal of Climatology, 42, 7342-7361, doi:10.1002/joc.7648.
- Wang, Y. F., and P. Huang, 2022: Potential fire risks in South America under anthropogenic forcing hidden by the Atlantic Multidecadal Oscillation. Nature Communications, 13, doi:10.1038/s41467-022-30104-1.
- Webb, E. J., and B. I. Magi, 2022: The Ensemble Oceanic Nino Index. International Journal of Climatology, 42, 5321-5341, doi:10.1002/joc.7535.
- Wilhelm, B., B. Amann, J. P. Corella, W. Rapuc, C. Giguet-Covex, B. Merz, and E. Storen, 2022: Reconstructing Paleoflood Occurrence and Magnitude from Lake Sediments. Quaternary, 5, doi:10.3390/quat5010009.
- Wu, H. H., C. S. Fu, L. L. Zhang, and H. W. Wu, 2022: Elevated Wildfire and Ecosystem Carbon Loss Risks Due to Plant Hydraulic Stress Functions: A Global Modeling Perspective. Fire-Switzerland, 5, doi:10.3390/fire5060187.
- Xie, M. M., C. Z. Wang, and S. Chen, 2022: The Role of the Maritime Continent SST Anomalies in Maintaining the Pacific-Japan Pattern on Decadal Time Scales. J. Clim., 35, 1079-1095, doi:10.1175/jcli-d-21-0555.1.
- Xie, Y. Y., and Coauthors, 2022: Tripling of western US particulate pollution from wildfires in a warming climate. Proceedings of the National Academy of Sciences of the United States of America, 119, doi:10.1073/pnas.2111372119.
- Xu, D. H., G. Bisht, T. Zhou, L. R. Leung, and M. Pan, 2022: Development of Land-River Two-Way Hydrologic Coupling for Floodplain Inundation in the Energy Exascale Earth System Model. Journal of Advances in Modeling Earth Systems, 14, doi:10.1029/2021ms002772.
- Xu, P. Q., L. Wang, Z. Z. Dong, Y. J. Li, X. C. Shen, and W. Chen, 2022: The British-Okhotsk Corridor Pattern and Its Linkage to the Silk Road Pattern. J. Clim., 35, 5787-5804, doi:10.1175/jcli-d-21-0705.1.
- Xu, Z. Q., and K. Fan, 2022: Enhanced Intensity of the Interannual Variability of February Surface Air Temperature Over Mid- and High-Latitude Asia Since the Late-1990s. Journal of Geophysical Research-Atmospheres, 127, doi:10.1029/2022jd036873.
- Yu, B., and Coauthors, 2022: Northern Hemisphere Extratropical Cyclone Activity in the Twentieth Century Reanalysis Version 3 (20CRv3) and Its Relationship with Continental Extreme Temperatures. Atmosphere, 13, doi:10.3390/atmos13081166.
- Yu, M. X., J. Feng, J. P. Li, and R. An, 2023: Interdecadal shift of the El Nino's modulation on the connection between the Hadley circulation and tropical SST. Climate Dynamics, 60, 2167-2181, doi:10.1007/s00382-022-06407-w.
- Zanchettin, D., S. Rubinetti, and A. Rubino, 2022: Is the Atlantic a Source for Decadal Predictability of Sea-Level Rise in Venice? Earth and Space Science, 9, doi:10.1029/2022ea002494.
- Zhang, H., and Coauthors, 2022: Recent climate change has driven divergent hydrological shifts in high-latitude peatlands. Nature Communications, 13, doi:10.1038/s41467-022-32711-4.
- Zhang, W., B. Kirtman, L. Siqueira, B. Q. Xiang, J. Infanti, and N. Perlin, 2022: Decadal Variability of Southeast US Rainfall in an Eddying Global Coupled Model. Geophysical Research Letters, 49, doi:10.1029/2021gl096709.
- Zhang, Z. Y., and G. Li, 2022: Uncertainty in the projected changes of Sahel summer rainfall under global warming in CMIP5 and CMIP6 multi-model ensembles. Climate Dynamics, 59, 3579-3597, doi:10.1007/s00382-022-06284-3.
- Zheng, S. H., H. L. Liu, and X. D. Wang, 2022: A robust mode of the winter oceanic mixed layer depth in the North Pacific. Dynamics of Atmospheres and Oceans, 97, doi:10.1016/j.dynatmoce.2022.101281.
- Zhirnova, D. F., L. V. Belokopytova, K. V. Krutovsky, Y. A. Kholdaenko, E. A. Babushkina, and E. A. Vaganov, 2022: Spatial-Coherent Dynamics and Climatic Signals in the Radial Growth of Siberian Stone Pine (Pinus sibirica Du Tour) in Subalpine Stands along the Western Sayan Mountains. Forests, 13, doi:10.3390/f13121994.
- Zhirnova, D. F., L. V. Belokopytova, K. K. Upadhyay, S. K. Tripathi, E. A. Babushkina, and E. A. Vaganov, 2022: 495-Year Wood Anatomical Record of Siberian Stone Pine (Pinus sibirica Du Tour) as Climatic Proxy on the Timberline. Forests, 13, doi:10.3390/f13020247.
- Antico, A., and M. Vuille, 2022: ENSO and Parana flow variability: Long-term changes in their connectivity. International Journal of Climatology, 42, 7269-7279, doi:10.1002/joc.7643.
- Augustine, J. A., and A. Capotondi, 2022: Forcing for Multidecadal Surface Solar Radiation Trends Over Northern Hemisphere Continents. Journal of Geophysical Research-Atmospheres, 127, doi:10.1029/2021jd036342.
- Bracegirdle, T. J., 2022: Early-to-Late Winter 20th Century North Atlantic Multidecadal Atmospheric Variability in Observations, CMIP5 and CMIP6. Geophysical Research Letters, 49, doi:10.1029/2022gl098212.
- Bracegirdle, T. J., H. Lu, and J. Robson, 2022: Early-winter North Atlantic low-level jet latitude biases in climate models: implications for simulated regional atmosphere-ocean linkages. Environmental Research Letters, 17, doi:10.1088/1748-9326/ac417f.
- Brönnimann, S., 2022: Historical Observations for Improving Reanalyses. Frontiers in Climate, 4, doi:10.3389/fclim.2022.880473.
- Brönnimann, S., and Coauthors, 2022: Influence of warming and atmospheric circulation changes on multidecadal European flood variability. Climate of the Past, 18, 919-933, doi:10.5194/cp-18-919-2022.
- Burgdorf, A. M., 2022: A global inventory of quantitative documentary evidence related to climate since the 15th century. Climate of the Past, 18, 1407-1428, doi:10.5194/cp-18-1407-2022.
- Capozzi, V., C. De Vivo, and G. Budillon, 2022: Synoptic control over winter snowfall variability observed in a remote site of Apennine Mountains (Italy), 1884-2015. Cryosphere, 16, 1741-1763, doi:10.5194/tc-16-1741-2022.
- Cassalho, F., T. W. Miesse, A. Khalid, A. D. de Lima, C. M. Ferreira, M. Henke, and T. M. Ravens, 2022: Intercomparing atmospheric reanalysis products for hydrodynamic and wave modeling of extreme events during the open-water Arctic season. Arct Antarct Alp Res, 54, 125-146, doi:10.1080/15230430.2022.2059957.
- Cesana, G. V., T. Khadir, H. Chepfer, and M. Chiriaco, 2022: Southern Ocean Solar Reflection Biases in CMIP6 Models Linked to Cloud Phase and Vertical Structure Representations. Geophysical Research Letters, 49, doi:10.1029/2022gl099777.
- Chakraborty, T., X. Lee, and D. M. Lawrence, 2022: Diffuse Radiation Forcing Constraints on Gross Primary Productivity and Global Terrestrial Evapotranspiration. Earths Future, 10, doi:10.1029/2022ef002805.
- Chand, S. S., and Coauthors, 2022: Declining tropical cyclone frequency under global warming. Nature Climate Change, 12, 655-+, doi:10.1038/s41558-022-01388-4.
- Chemke, R., Y. Ming, and J. Yuval, 2022: The intensification of winter mid-latitude storm tracks in the Southern Hemisphere. Nature Climate Change, 12, 553-+, doi:10.1038/s41558-022-01368-8.
- Christidis, N., and P. A. Stott, 2022: Human Influence on Seasonal Precipitation in Europe. J. Clim., 35, 5215-5231, doi:10.1175/jcli-d-21-0637.1.
- Dunn, R. J. H., M. G. Donat, and L. V. Alexander, 2022: Comparing extremes indices in recent observational and reanalysis products. Frontiers in Climate, 4, doi:10.3389/fclim.2022.989505.
- Dunn, R. J. H., and C. P. Morice, 2022: On the effect of reference periods on trends in percentile-based extreme temperature indices. Environmental Research Letters, 17, doi:10.1088/1748-9326/ac52c8.
- Dwivedi, S., P. Pandey, and B. N. Goswami, 2022: Nonstationarity and potential multi-decadal variability in Indian Summer Monsoon Rainfall and Southern Annular Mode teleconnection. Climate Dynamics, 59, 671-683, doi:10.1007/s00382-022-06146-y.
- Egli, M., S. Sippel, A. G. Pendergrass, I. de Vries, and R. Knutti, 2022: Reconstruction of Zonal Precipitation From Sparse Historical Observations Using Climate Model Information and Statistical Learning. Geophysical Research Letters, 49, doi:10.1029/2022gl099826.
- Eischeid, J. K., M. P. Hoerling, X. W. Quan, and H. F. Diaz, 2022: Diagnosing Hawaii's Recent Drought. J. Clim., 35, 3997-4012, doi:10.1175/jcli-d-21-0754.1.
- Fazel-Rastgar, F., and V. Sivakumar, 2022: A severe weather system accompanied by a stratospheric intrusion during unusual warm winter in 2015 over the South Africa: An initial synoptic analysis. Remote Sensing Applications-Society and Environment, 28, doi:10.1016/j.rsase.2022.100833.
- Garrett, E., W. R. Gehrels, B. W. Hayward, R. Newnham, M. J. Gehrels, C. J. Morey, and S. Dangendorf, 2022: Drivers of 20th century sea-level change in southern New Zealand determined from proxy and instrumental records. Journal of Quaternary Science, 37, 1025-1043, doi:10.1002/jqs.3418.
- Gergis, J., Z. Baillie, L. Ashcroft, B. Trewin, and R. J. Allan, 2023: Consolidating historical instrumental observations in southern Australia for assessing pre-industrial weather and climate variability. Climate Dynamics, 61, 1063-1087, doi:10.1007/s00382-022-06573-x.
- Gillespie, I., L. Haimberger, G. P. Compo, and P. W. Thorne, 2023: Assessing homogeneity of land surface air temperature observations using sparse-input reanalyses. International Journal of Climatology, 43, 736-760, doi:10.1002/joc.7822.
- Goswami, B. N., D. Chakraborty, P. V. Rajesh, and A. Mitra, 2022: Predictability of South-Asian monsoon rainfall beyond the legacy of Tropical Ocean Global Atmosphere program (TOGA). Npj Climate and Atmospheric Science, 5, doi:10.1038/s41612-022-00281-3.
- Goswami, D. J., K. Ashok, and B. N. Goswami, 2022: Local ocean-atmosphere interaction in Indian summer monsoon multi-decadal variability. Climate Dynamics, doi:10.1007/s00382-022-06377-z.
- Grooms, I., 2022: A comparison of nonlinear extensions to the ensemble Kalman filter Gaussian anamorphosis and two-step ensemble filters. Computational Geosciences, 26, 633-650, doi:10.1007/s10596-022-10141-x.
- Guo, S. Y., X. D. Guan, L. L. Gao, W. Sun, C. Y. Cao, and Y. L. He, 2022: Opposite Atlantic Multidecadal Oscillation effects on dry/wet changes over Central and East Asian drylands. Atmospheric Research, 271, doi:10.1016/j.atmosres.2022.106102.
- Gupta, R. S., S. Steinschneider, and P. M. Reed, 2023: A multi-objective paleo-informed reconstruction of western US weather regimes over the past 600 years. Climate Dynamics, 60, 339-358, doi:10.1007/s00382-022-06302-4.
- Hahmann, A. N., O. García-Santiago, and A. Peña, 2022: Current and future wind energy resources in the North Sea according to CMIP6. Wind Energy Science, 7, 2373-2391, doi:10.5194/wes-7-2373-2022.
- Halder, S., A. Parekh, J. S. Chowdary, and C. Gnanaseelan, 2022: Dynamical and moist thermodynamical processes associated with Western Ghats rainfall decadal variability. Npj Climate and Atmospheric Science, 5, doi:10.1038/s41612-022-00232-y.
- Hamill, T. M., and Coauthors, 2022: The Reanalysis for the Global Ensemble Forecast System, Version 12. Monthly Weather Review, 150, 59-79, doi:10.1175/mwr-d-21-0023.1.
- Hanna, E., T. E. Cropper, R. J. Hall, R. C. Cornes, and M. Barriendos, 2022: Extended North Atlantic Oscillation and Greenland Blocking Indices 1800-2020 from New Meteorological Reanalysis. Atmosphere, 13, doi:10.3390/atmos13030436.
- Heidemann, H., J. Ribbe, T. Cowan, B. J. Henley, C. Pudmenzky, R. Stone, and D. H. Cobon, 2022: The Influence of Interannual and Decadal Indo-Pacific Sea Surface Temperature Variability on Australian Monsoon Rainfall. J. Clim., 35, 425-444, doi:10.1175/jcli-d-21-0264.1.
- Hirano, J., T. Mikami, and M. Zaiki, 2022: Analysis of early Japanese meteorological data and historical weather documents to reconstruct the winter climate between the 1840s and the early 1850s. Climate of the Past, 18, 327-339, doi:10.5194/cp-18-327-2022.
- Iqbal, S. W., and Coauthors, 2022: Performance evaluation and comparison of observed and reanalysis gridded precipitation datasets over Pakistan. Theoretical and Applied Climatology, 149, 1093-1116, doi:10.1007/s00704-022-04100-w.
- Ivasic, S., and I. Herceg-Bulic, 2023: A modelling study of the impact of tropical SSTs on the variability and predictable components of seasonal atmospheric circulation in the North Atlantic-European region. Climate Dynamics, 60, 927-944, doi:10.1007/s00382-022-06357-3.
- Jaume-Santero, F., D. Barriopedro, R. García-Herrera, and J. Luterbacher, 2022: Monthly North Atlantic Sea Level Pressure Reconstruction Back to 1750 CE Using Artificial Intelligence Optimization. J. Clim., 35, 3395-3410, doi:10.1175/jcli-d-21-0155.1.
- Joshi, M. K., A. Rai, and A. Kulkarni, 2022: Global-scale interdecadal variability a skillful predictor at decadal-to-multidecadal timescales for Sahelian and Indian Monsoon Rainfall. Npj Climate and Atmospheric Science, 5, doi:10.1038/s41612-021-00227-1.
- Junqueira, R., M. R. Viola, J. D. Amorim, S. C. Wongchuig, C. R. de Mello, M. Vieira, and G. Coelho, 2022: Hydrological Retrospective and Historical Drought Analysis in a Brazilian Savanna Basin. Water, 14, doi:10.3390/w14142178.
- Karzani, M., Y. Ghavidel, and M. Farajzadeh, 2022: Temporal Changes in Lethal Temperatures Above 50 °C in the Northern Hemisphere. Pure and Applied Geophysics, 179, 3377-3390, doi:10.1007/s00024-022-03109-6.
- Konstali, K., and A. Sorteberg, 2022: Why has Precipitation Increased in the Last 120 Years in Norway? Journal of Geophysical Research-Atmospheres, 127, doi:10.1029/2021jd036234.
- Labe, Z. M., and E. A. Barnes, 2022: Comparison of Climate Model Large Ensembles With Observations in the Arctic Using Simple Neural Networks. Earth and Space Science, 9, doi:10.1029/2022ea002348.
- Li, J. C., Z. P. Wen, X. Z. Li, and Y. Y. Guo, 2022: Interdecadal Changes in the Relationship between Wintertime Surface Air Temperature over the Indo-China Peninsula and ENSO. J. Clim., 35, 975-995, doi:10.1175/jcli-d-21-0477.1.
- Li, L. H., and S. L. Li, 2022: A Comparison of Two 20th Century Reanalysis Datasets from the Perspective of Cross-Equatorial Flows. Journal of the Meteorological Society of Japan, 100, 807-824, doi:10.2151/jmsj.2022-042.
- Li, M. X., P. L. Wu, Z. G. Ma, Z. H. Pan, M. X. Lv, Q. Yang, and Y. W. Duan, 2022: The Increasing Role of Vegetation Transpiration in Soil Moisture Loss across China under Global Warming. Journal of Hydrometeorology, 23, 253-274, doi:10.1175/jhm-d-21-0132.1.
- Li, X. J., Y. M. Tang, X. S. Song, and T. Liu, 2022: Decadal Variation of the Rainfall Predictability over the Maritime Continent in the Wet Season. J. Clim., 35, 4859-4867, doi:10.1175/jcli-d-21-0862.1.
- Lieber, R., A. King, J. Brown, L. Ashcroft, M. Freund, and C. McMichael, 2022: ENSO Teleconnections More Uncertain in Regions of Lower Socioeconomic Development. Geophysical Research Letters, 49, doi:10.1029/2022gl100553.
- Liu, C. Y., and Coauthors, 2022: Blending TAC and BUFR Marine In Situ Data for ICOADS Near-Real-Time Release 3.0.2. Journal of Atmospheric and Oceanic Technology, 39, 1943-1959, doi:10.1175/jtech-d-21-0182.1.
- Liu, X. H., and F. C. Yao, 2022: Relationship of the Warming of Red Sea Surface Water over 140 Years with External Heat Elements. Journal of Marine Science and Engineering, 10, doi:10.3390/jmse10070846.
- Lorrey, A. M., and Coauthors, 2022: Meteorological data rescue: Citizen science lessons learned from Southern Weather Discovery. Patterns, 3, doi:10.1016/j.patter.2022.100495.
- Lu, Z. C., T. B. Zhao, W. C. Zhou, and H. K. Zhao, 2022: Interdecadal Variation of the Antarctic Circumpolar Wave Based on the 20CRV3 Dataset. Atmosphere, 13, doi:10.3390/atmos13050736.
- Lyu, A., and Q. Z. Yin, 2022: The spatial-temporal patterns of East Asian climate in response to insolation, CO2 and ice sheets during MIS-5. Quaternary Science Reviews, 293, doi:10.1016/j.quascirev.2022.107689.
- Mahoney, K., C. McColl, D. M. Hultstrand, W. D. Kappel, B. McCormick, and G. P. Compo, 2022: Blasts from the Past Reimagining Historical Storms with Model Simulations to Modernize Dam Safety and Flood Risk Assessment. Bulletin of the American Meteorological Society, 103, E266-E280, doi:10.1175/bams-d-21-0133.1.
- Maksic, J., M. H. Shimizu, M. T. Kayano, C. M. Chiessi, M. Prange, and G. Sampaio, 2022: Influence of the Atlantic Multidecadal Oscillation on South American Atmosphere Dynamics and Precipitation. Atmosphere, 13, doi:10.3390/atmos13111778.
- Marshall, G. J., R. L. Fogt, J. Turner, and K. R. Clem, 2022: Can current reanalyses accurately portray changes in Southern Annular Mode structure prior to 1979? Climate Dynamics, 59, 3717-3740, doi:10.1007/s00382-022-06292-3.
- Matskovsky, V., F. A. Roig, M. Fuentes, I. Korneva, D. Araneo, H. W. Linderholm, and J. C. Aravena, 2022: Summer temperature changes in Tierra del Fuego since AD 1765: atmospheric drivers and tree-ring reconstruction from the southernmost forests of the world. Climate Dynamics, doi:10.1007/s00382-022-06384-0.
- McKenna, C. M., and A. C. Maycock, 2022: The Role of the North Atlantic Oscillation for Projections of Winter Mean Precipitation in Europe. Geophysical Research Letters, 49, doi:10.1029/2022gl099083.
- Melo-Aguilar, C., and Coauthors, 2022: Near-surface soil thermal regime and land-air temperature coupling: A case study over Spain. International Journal of Climatology, 42, 7516-7534, doi:10.1002/joc.7662.
- Meyer, E. M. I., R. Weisse, I. Grabemann, B. Tinz, and R. Scholz, 2022: Reconstruction of wind and surge of the 1906 storm tide at the German North Sea coast. Natural Hazards and Earth System Sciences, 22, 2419-2432, doi:10.5194/nhess-22-2419-2022.
- Mo, R. P., 2022: Prequel to the Stories of Warm Conveyor Belts and Atmospheric Rivers The Moist Tongues Identified by Rossby and His Collaborators in the 1930s. Bulletin of the American Meteorological Society, 103, E1019-E1040, doi:10.1175/bams-d-20-0276.1.
- Mortimer, C., and Coauthors, 2022: Benchmarking algorithm changes to the Snow CCI plus snow water equivalent product. Remote Sens Environ, 274, doi:10.1016/j.rse.2022.112988.
- Nagavciuc, V., M. Ionita, Z. Kern, D. McCarroll, and I. Popa, 2022: A ∼700 years perspective on the 21st century drying in the eastern part of Europe based on δ18O in tree ring cellulose. Communications Earth & Environment, 3, doi:10.1038/s43247-022-00605-4.
- Nakano, H., S. Urakawa, K. Sakamoto, T. Toyoda, Y. Kawakami, and G. Yamanaka, 2022: Long-term sea-level variability along the coast of Japan during the 20th century revealed by a 1/10° OGCM. Journal of Oceanography, doi:10.1007/s10872-022-00671-4.
- Nielsen, A. H., A. Iosifidis, and H. Karstoft, 2022: Forecasting large-scale circulation regimes using deformable convolutional neural networks and global spatiotemporal climate data. Scientific Reports, 12, doi:10.1038/s41598-022-12167-8.
- Nolin, A. F., M. P. Girardin, J. C. Tardif, X. J. Guo, F. Conciatori, and Y. Bergeron, 2022: A 247-year tree-ring reconstruction of spring temperature and relation to spring flooding in eastern boreal Canada. International Journal of Climatology, 42, 6479-6498, doi:10.1002/joc.7608.
- Obregón, M. A., M. T. Rodas, A. M. M. Farrona, F. Domínguez-Castro, M. C. Gallego, R. García-Herrera, and J. M. Vaquero, 2022: On the Value of Early Marine Weather Observations the Malaspina Expedition (1789-94). Bulletin of the American Meteorological Society, 103, E1684-E1695, doi:10.1175/bams-d-21-0051.1.
- Ombadi, M., and M. D. Risser, 2022: What's the temperature tomorrow? Increasing trends in extreme volatility of daily maximum temperature in Central and Eastern United States (1950-2019). Weather and Climate Extremes, 38, doi:10.1016/j.wace.2022.100515.
- Pandey, P., S. Dwivedi, and B. N. Goswami, 2022: Trend and variability in the long-term relationship between Eurasian snow cover and Indian summer monsoon rainfall. International Journal of Climatology, 42, 7751-7765, doi:10.1002/joc.7675.
- Pappert, D., and Coauthors, 2022: Statistical reconstruction of daily temperature and sea level pressure in Europe for the severe winter 1788/89. Climate of the Past, 18, 2545-2565, doi:10.5194/cp-18-2545-2022.
- Park, J. H., J. S. Kug, Y. M. Yang, H. Oh, J. W. Zhao, and Y. K. Wu, 2022: Role of the Climatological North Pacific High in the North Tropical Atlantic-ENSO Connection. J. Clim., 35, 3215-3226, doi:10.1175/jcli-d-21-0933.1.
- Peña, J. C., and Coauthors, 2022: Low-Frequency Atmospheric Variability Patterns and Synoptic Types Linked to Large Floods in the Lower Ebro River Basin. J. Clim., 35, 2351-2371, doi:10.1175/jcli-d-20-0394.1.
- Peng, Q. H., and Coauthors, 2022: Surface warming-induced global acceleration of upper ocean currents. Science Advances, 8, doi:10.1126/sciadv.abj8394.
- Prein, A. F., J. Coen, and A. Jaye, 2022: The Character and Changing Frequency of Extreme California Fire Weather. Journal of Geophysical Research-Atmospheres, 127, doi:10.1029/2021jd035350.
- Przybylak, R., P. Wyszynski, and A. Arazny, 2022: Comparison of Early-Twentieth-Century Arctic Warming and Contemporary Arctic Warming in the Light of Daily and Subdaily Data. J. Clim., 35, 2269-2290, doi:10.1175/jcli-d-21-0162.1.
- Qiao, P. J., Z. Q. Gong, W. Q. Liu, Y. W. Zhang, and G. L. Feng, 2022: Asymmetrical synchronization of extreme rainfall events in southwest China. International Journal of Climatology, 42, 5935-5948, doi:10.1002/joc.7569.
- Reichen, L., and Coauthors, 2022: A decade of cold Eurasian winters reconstructed for the early 19th century. Nature Communications, 13, doi:10.1038/s41467-022-29677-8.
- Reynolds, D. J., V. R. von Biela, K. H. Dunton, D. C. Douglas, and B. A. Black, 2022: Sclerochronological records of environmental variability and bivalve growth in the Pacific Arctic. Prog Oceanogr, 206, doi:10.1016/j.pocean.2022.102864.
- Roustan, J. B., L. Pineau-Guillou, B. Chapron, N. Raillard, and M. Reinert, 2022: Shift of the storm surge season in Europe due to climate variability. Scientific Reports, 12, doi:10.1038/s41598-022-12356-5.
- Shi, F., C. Sun, A. Guion, Q. Z. Yin, S. Zhao, T. Liu, and Z. T. Guo, 2022: Roman Warm Period and Late Antique Little Ice Age in an Earth System Model Large Ensemble. Journal of Geophysical Research-Atmospheres, 127, doi:10.1029/2021jd035832.
- Stamatis, M., N. Hatzianastassiou, M. B. Korras-Carraca, C. Matsoukas, M. Wild, and I. Vardavas, 2022: Interdecadal Changes of the MERRA-2 Incoming Surface Solar Radiation (SSR) and Evaluation against GEBA & BSRN Stations. Applied Sciences-Basel, 12, doi:10.3390/app121910176.
- Steffelbauer, D. B., R. E. M. Riva, J. S. Timmermans, J. H. Kwakkel, and M. Bakker, 2022: Evidence of regional sea-level rise acceleration for the North Sea. Environmental Research Letters, 17, doi:10.1088/1748-9326/ac753a.
- Sukhdeo, R., P. A. Ullrich, and R. Grotjahn, 2022: Assessing the large-scale drivers of precipitation in the northeastern United States via linear orthogonal decomposition. Climate Dynamics, 59, 3657-3681, doi:10.1007/s00382-022-06289-y.
- Sun, J. Z., and Coauthors, 2022: An online ensemble coupled data assimilation capability for the Community Earth System Model: system design and evaluation. Geoscientific Model Development, 15, 4805-4830, doi:10.5194/gmd-15-4805-2022.
- Sun, L. Y., S. G. Penny, and M. Harrison, 2022: Impacts of the Lagrangian Data Assimilation of Surface Drifters on Estimating Ocean Circulation during the Gulf of Mexico Grand Lagrangian Deployment. Monthly Weather Review, 150, 949-965, doi:10.1175/mwr-d-21-0123.1.
- Sun, Y. B., and Coauthors, 2022: A review of orbital-scale monsoon variability and dynamics in East Asia during the Quaternary. Quaternary Science Reviews, 288, doi:10.1016/j.quascirev.2022.107593.
- Sylla, A., E. S. Gomez, J. Mignot, and J. Lopez-Parages, 2022: Impact of increased resolution on the representation of the Canary upwelling system in climate models. Geoscientific Model Development, 15, 8245-8267, doi:10.5194/gmd-15-8245-2022.
- Thapa, U. K., S. Stevenson, and M. Midhun, 2022: Orbital Forcing Strongly Influences the Poleward Shift of the Spring Himalayan Jet During the Past Millennium. Geophysical Research Letters, 49, doi:10.1029/2021gl095955.
- Tsavkov, E., N. Tsvetanov, V. Shishkova, and M. Panayotov, 2022: First dendrochronological studies of Quercus protoroburoides. Dendrochronologia, 75, doi:10.1016/j.dendro.2022.125984.
- Valipour, M., and J. Dietrich, 2022: Developing ensemble mean models of satellite remote sensing, climate reanalysis, and land surface models. Theoretical and Applied Climatology, 150, 909-926, doi:10.1007/s00704-022-04185-3.
- van der Wiel, K., T. J. Batelaan, and N. Wanders, 2022: Large increases of multi-year droughts in north-western Europe in a warmer climate. Climate Dynamics, doi:10.1007/s00382-022-06373-3.
- Wahl, E., E. Zorita, and A. Hoell, 2022: The Kalman Filter as Post-Processor for Analog Data-Model Assimilation in Paleoclimate Reconstruction. J. Clim., 35, 5501-5518, doi:10.1175/jcli-d-21-0454.1.
- Wang, L., and M. F. Ting, 2022: Stratosphere-Troposphere Coupling Leading to Extended Seasonal Predictability of Summer North Atlantic Oscillation and Boreal Climate. Geophysical Research Letters, 49, doi:10.1029/2021gl096362.
- Webb, E. J., and B. I. Magi, 2022: The Ensemble Oceanic Nino Index. International Journal of Climatology, 42, 5321-5341, doi:10.1002/joc.7535.
- Wethey, D. S., and S. A. Woodin, 2022: Climate change and Arenicola marina: Heat waves and the southern limit of an ecosystem engineer. Estuarine Coastal and Shelf Science, 276, doi:10.1016/j.ecss.2022.108015.
- Wu, C. H., C. J. Shiu, Y. Y. Chen, I. C. Tsai, and S. Y. Lee, 2023: Climatological changes in East Asian winter monsoon circulation in a warmer future. Atmospheric Research, 284, doi:10.1016/j.atmosres.2022.106593.
- Xiao, C. L., C. Qian, A. N. Huang, R. X. Guo, and X. Y. Kuang, 2023: Evaluation of AMIP models from CMIP6 in simulating winter surface air temperature trends over Eurasia during 1998-2012 based on dynamical adjustment. Climate Dynamics, 60, 17-31, doi:10.1007/s00382-022-06295-0.
- Xu, T. F., D. L. Yuan, and J. Wang, 2022: Assessment of the oceanic channel dynamics responsible for the IOD-ENSO precursory teleconnection in CMIP5 climate models. Frontiers in Climate, 4, doi:10.3389/fclim.2022.996343.
- Yang, Y., Q. X. Li, Z. Y. Song, W. B. Sun, and W. J. Dong, 2022: A comparison of global surface temperature variability, extremes and warming trend using reanalysis datasets and CMST-Interim. International Journal of Climatology, 42, 5609-5628, doi:10.1002/joc.7551.
- Yang, Y. M., and Coauthors, 2022: Increased Indian Ocean-North Atlantic Ocean warming chain under greenhouse warming. Nature Communications, 13, doi:10.1038/s41467-022-31676-8.
- Yao, W. J., X. Q. Yan, Y. M. Tang, D. J. Yang, X. X. Tan, X. S. Song, and T. Liu, 2022: Multidecadal Variation in the Seasonal Predictability of Winter PNA and Its Sources. Geophysical Research Letters, 49, doi:10.1029/2022gl099393.
- Yee, M., and J. O. Kaplan, 2022: Drivers of urban heat in Hong Kong over the past 116 years. Urban Climate, 46, doi:10.1016/j.uclim.2022.101308.
- Yu, B., and Coauthors, 2022: Northern Hemisphere Extratropical Cyclone Activity in the Twentieth Century Reanalysis Version 3 (20CRv3) and Its Relationship with Continental Extreme Temperatures. Atmosphere, 13, doi:10.3390/atmos13081166.
- Yu, L. J., S. Y. Zhong, and B. Sun, 2022: Synchronous Variation Patterns of Monthly Sea Ice Anomalies at the Arctic and Antarctic. J. Clim., 35, 2823-2847, doi:10.1175/jcli-d-21-0756.1.
- Yu, L. W., D. Si, X. Y. Shen, X. M. Lang, R. Zhang, and Q. Q. Li, 2023: Impact of Tibetan Plateau vertical heating on the Asian summer monsoon on the interdecadal scale. Atmospheric Science Letters, 24, doi:10.1002/asl.1140.
- Zhang, Y., and Coauthors, 2022: Atmospheric Forcing of the Pacific Meridional Mode: Tropical Pacific-Driven Versus Internal Variability. Geophysical Research Letters, 49, doi:10.1029/2022gl098148.
- Zhao, C. Y., X. Geng, and L. Qi, 2022: Atlantic Multidecadal Oscillation Modulates the Relation of ENSO With the Precipitation in the Central-Western Indian Ocean. Frontiers in Earth Science, 10, doi:10.3389/feart.2022.866241.
- Biswas, S., S. S. Chand, A. J. Dowdy, W. Wright, C. Foale, X. H. Zhao, and A. Deo, 2022: Statistical Calibration of Long-Term Reanalysis Data for Australian Fire Weather Conditions. Journal of Applied Meteorology and Climatology, 61, 729-758, doi:10.1175/jamc-d-21-0034.1.
- Brönnimann, S., 2022: Historical Observations for Improving Reanalyses. Frontiers in Climate, 4, doi:10.3389/fclim.2022.880473.
- Brönnimann, S., and Coauthors, 2022: Influence of warming and atmospheric circulation changes on multidecadal European flood variability. Climate of the Past, 18, 919-933, doi:10.5194/cp-18-919-2022.
- Chen, Y. F., Y. Du, and Z. S. Chen, 2023: Indo-western Pacific Ocean capacitor events recorded by coral proxies in the South China Sea. Palaeogeography Palaeoclimatology Palaeoecology, 609, doi:10.1016/j.palaeo.2022.111315.
- Fox-Hughes, P., and Coauthors, 2022: A review of early severe weather applications of high-resolution regional reanalysis in Australia. Meteorological Applications, 29, doi:10.1002/met.2087.
- Gillespie, I., L. Haimberger, G. P. Compo, and P. W. Thorne, 2023: Assessing homogeneity of land surface air temperature observations using sparse-input reanalyses. International Journal of Climatology, 43, 736-760, doi:10.1002/joc.7822.
- Ginzburg, A. S., G. A. Alexandrov, and A. V. Chernokulsky, 2022: Climatic Criteria of the Need for Preventive Adaptation. Izvestiya Atmospheric and Oceanic Physics, 58, 536-544, doi:10.1134/s0001433822060068.
- Hawkins, E., L. V. Alexander, and R. J. Allan, 2023: Millions of digitized historical sea-level pressure observations rediscovered. Geoscience Data Journal, 10, 385-395, doi:10.1002/gdj3.163.
- Huang, J. Y., Q. X. Li, and Z. Y. Song, 2022: Historical global land surface air apparent temperature and its future changes based on CMIP6 projections. Science of the Total Environment, 816, doi:10.1016/j.scitotenv.2021.151656.
- Ionita, M., V. Nagavciuc, P. Scholz, and M. Dima, 2022: Long-term drought intensification over Europe driven by the weakening trend of the Atlantic Meridional Overturning Circulation. J Hydrol-Reg Stud, 42, doi:10.1016/j.ejrh.2022.101176.
- Labe, Z. M., and E. A. Barnes, 2022: Comparison of Climate Model Large Ensembles With Observations in the Arctic Using Simple Neural Networks. Earth and Space Science, 9, doi:10.1029/2022ea002348.
- Lakkis, S. G., P. O. Canziani, J. O. Rodriquez, and A. E. Yuchechen, 2023: Early meteorological records from Corrientes and Bahia Blanca, Argentina: Initial ACRE-Argentina data rescue and related activities. Geoscience Data Journal, 10, 328-346, doi:10.1002/gdj3.176.
- Lieber, R., A. King, J. Brown, L. Ashcroft, M. Freund, and C. McMichael, 2022: ENSO Teleconnections More Uncertain in Regions of Lower Socioeconomic Development. Geophysical Research Letters, 49, doi:10.1029/2022gl100553.
- Lorrey, A. M., and Coauthors, 2022: Meteorological data rescue: Citizen science lessons learned from Southern Weather Discovery. Patterns, 3, doi:10.1016/j.patter.2022.100495.
- Lu, Z. C., T. B. Zhao, W. C. Zhou, and H. K. Zhao, 2022: Interdecadal Variation of the Antarctic Circumpolar Wave Based on the 20CRV3 Dataset. Atmosphere, 13, doi:10.3390/atmos13050736.
- Mahoney, K., C. McColl, D. M. Hultstrand, W. D. Kappel, B. McCormick, and G. P. Compo, 2022: Blasts from the Past Reimagining Historical Storms with Model Simulations to Modernize Dam Safety and Flood Risk Assessment. Bulletin of the American Meteorological Society, 103, E266-E280, doi:10.1175/bams-d-21-0133.1.
- Mo, R. P., 2022: Prequel to the Stories of Warm Conveyor Belts and Atmospheric Rivers The Moist Tongues Identified by Rossby and His Collaborators in the 1930s. Bulletin of the American Meteorological Society, 103, E1019-E1040, doi:10.1175/bams-d-20-0276.1.
- Nolin, A. F., M. P. Girardin, J. C. Tardif, X. J. Guo, F. Conciatori, and Y. Bergeron, 2022: A 247-year tree-ring reconstruction of spring temperature and relation to spring flooding in eastern boreal Canada. International Journal of Climatology, 42, 6479-6498, doi:10.1002/joc.7608.
- Pan, Z. T., S. Kumar, Y. J. Zhang, and C. H. Shi, 2022: Central Continental Boreal Summer "Warming Holes" Modulated by Atlantic Multidecadal Oscillation Via Low-Level Jets. Journal of Geophysical Research-Atmospheres, 127, doi:10.1029/2021jd035217.
- Pohl, B., A. Sturman, J. Renwick, H. Quénol, N. Fauchereau, A. Lorrey, and J. Pergaud, 2023: Precipitation and temperature anomalies over Aotearoa New Zealand analysed by weather types and descriptors of atmospheric centres of action. International Journal of Climatology, 43, 331-353, doi:10.1002/joc.7762.
- Przybylak, R., P. Wyszynski, and A. Arazny, 2022: Comparison of Early-Twentieth-Century Arctic Warming and Contemporary Arctic Warming in the Light of Daily and Subdaily Data. J. Clim., 35, 2269-2290, doi:10.1175/jcli-d-21-0162.1.
- Reed, E. V., D. M. Thompson, and K. J. Anchukaitis, 2022: Coral-Based Sea Surface Salinity Reconstructions and the Role of Observational Uncertainties in Inferred Variability and Trends. Paleoceanography and Paleoclimatology, 37, doi:10.1029/2021pa004371.
- Shirley, I. A., and Coauthors, 2022: Near-Surface Hydrology and Soil Properties Drive Heterogeneity in Permafrost Distribution, Vegetation Dynamics, and Carbon Cycling in a Sub-Arctic Watershed. Journal of Geophysical Research-Biogeosciences, 127, doi:10.1029/2022jg006864.
- Yang, Y., Q. X. Li, Z. Y. Song, W. B. Sun, and W. J. Dong, 2022: A comparison of global surface temperature variability, extremes and warming trend using reanalysis datasets and CMST-Interim. International Journal of Climatology, 42, 5609-5628, doi:10.1002/joc.7551.
- Yao, W. J., X. Q. Yan, Y. M. Tang, D. J. Yang, X. X. Tan, X. S. Song, and T. Liu, 2022: Multidecadal Variation in the Seasonal Predictability of Winter PNA and Its Sources. Geophysical Research Letters, 49, doi:10.1029/2022gl099393.
- Yu, B., and Coauthors, 2022: Northern Hemisphere Extratropical Cyclone Activity in the Twentieth Century Reanalysis Version 3 (20CRv3) and Its Relationship with Continental Extreme Temperatures. Atmosphere, 13, doi:10.3390/atmos13081166.
- Zaplotnik, Z., M. Pikovnik, and L. Boljka, 2022: Recent Hadley Circulation Strengthening: A Trend or Multidecadal Variability. J. Clim., 35, 4157-4176, doi:10.1175/jcli-d-21-0204.1.
- Abatzoglou, J. T., D. E. Rupp, L. W. O'Neill, and M. Sadegh, 2021: Compound Extremes Drive the Western Oregon Wildfires of September 2020. Geophysical Research Letters, 48, doi:10.1029/2021gl092520.
- Agrawal, S., C. R. Ferguson, L. Bosart, and D. A. Burrows, 2021: Teleconnections Governing the Interannual Variability of Great Plains Low-Level Jets in May. J. Clim., 34, 4785-4802, doi:10.1175/jcli-d-20-0451.1.
- Alexandrov, G. A., V. A. Ginzburg, G. E. Insarov, and A. A. Romanovskaya, 2021: CMIP6 model projections leave no room for permafrost to persist in Western Siberia under the SSP5-8.5 scenario. Climatic Change, 169, doi:10.1007/s10584-021-03292-w.
- Arthun, M., R. C. J. Wills, H. L. Johnson, L. Chafik, and H. R. Langehaug, 2021: Mechanisms of Decadal North Atlantic Climate Variability and Implications for the Recent Cold Anomaly. J. Clim., 34, 3421-3439, doi:10.1175/jcli-d-20-0464.1.
- Aubry, T. J., and Coauthors, 2021: The Independent Volcanic Eruption Source Parameter Archive (IVESPA, version 1.0): A new observational database to support explosive eruptive column model validation and development. Journal of Volcanology and Geothermal Research, 417, doi:10.1016/j.jvolgeores.2021.107295.
- Baatz, R., and Coauthors, 2021: Reanalysis in Earth System Science: Toward Terrestrial Ecosystem Reanalysis. Reviews of Geophysics, 59, doi:10.1029/2020rg000715.
- Balting, D. F., and Coauthors, 2021: Large-scale climate signals of a European oxygen isotope network from tree rings. Climate of the Past, 17, 1005-1023, doi:10.5194/cp-17-1005-2021.
- Bao, X. H., F. Q. Zhang, Y. Zhao, and Y. L. Chen, 2021: The Impact of the Observation Data Assimilation on Atmospheric Reanalyses over Tibetan Plateau and Western Yunnan-Guizhou Plateau. Atmosphere, 12, doi:10.3390/atmos12010038.
- Bell, B., and Coauthors, 2021: The ERA5 global reanalysis: Preliminary extension to 1950. Quarterly Journal of the Royal Meteorological Society, 147, 4186-4227, doi:10.1002/qj.4174.
- Benito, G., O. Castillo, J. A. Ballesteros-Canovas, M. Machado, and M. Barriendos, 2021: Enhanced flood hazard assessment beyond decadal climate cycles based on centennial historical data (Duero basin, Spain). Hydrology and Earth System Sciences, 25, 6107-6132, doi:10.5194/hess-25-6107-2021.
- Blaker, A. T., M. Joshi, B. Sinha, D. P. Stevens, R. S. Smith, and J. J. M. Hirschi, 2021: FORTE 2.0: a fast, parallel and flexible coupled climate model. Geoscientific Model Development, 14, 275-293, doi:10.5194/gmd-14-275-2021.
- Blanc, A., J. Blanchet, and J. D. Creutin, 2022: Characterizing large-scale circulations driving extreme precipitation in the Northern French Alps. International Journal of Climatology, 42, 465-480, doi:10.1002/joc.7254.
- Bodai, T., G. Drotos, K. J. Ha, J. Y. Lee, and E. S. Chung, 2021: Nonlinear Forced Change and Nonergodicity: The Case of ENSO-Indian Monsoon and Global Precipitation Teleconnections. Frontiers in Earth Science, 8, doi:10.3389/feart.2020.599785.
- Bokuchava, D. D., and V. A. Semenov, 2021: Mechanisms of the Early 20th Century Warming in the Arctic. Earth-Science Reviews, 222, doi:10.1016/j.earscirev.2021.103820.
- Bonnafous, L., and U. Lall, 2021: Space-time clustering of climate extremes amplify global climate impacts, leading to fat-tailed risk. Natural Hazards and Earth System Sciences, 21, 2277-2284, doi:10.5194/nhess-21-2277-2021.
- Bourdeau-Goulet, S. C., and E. Hassanzadeh, 2021: Comparisons Between CMIP5 and CMIP6 Models: Simulations of Climate Indices Influencing Food Security, Infrastructure Resilience, and Human Health in Canada. Earths Future, 9, doi:10.1029/2021ef001995.
- Bui, M. T., J. M. Lu, and L. M. Nie, 2021: Evaluation of the Climate Forecast System Reanalysis weather data for the hydrological model in the Arctic watershed Malselv. Journal of Water and Climate Change, 12, 3481-3504, doi:10.2166/wcc.2021.346.
- Caillouet, L., J. P. Vidal, E. Sauquet, A. Devers, C. Lauvernet, B. Graff, and O. Vannier, 2021: Inter-comparison of extreme low-flow events in France since 1871. Lhb-Hydroscience Journal, 107, doi:10.1080/00186368.2021.1914463.
- Carrasco, V. M. S., J. M. Vaquero, A. Ballesteros, M. Cruz Gallego, and J. A. Garcia, 2021: The tornado of Talavera de la Reina on September 3, 1880. Atmosfera, 34, 301-309, doi:10.20937/atm.52830.
- Ceron, W. L., R. V. Andreoli, M. T. Kayano, and A. Avila-Diaz, 2021: Role of the eastern Pacific-Caribbean Sea SST gradient in the Choco low-level jet variations from 1900-2015. Climate Research, 83, 61-74, doi:10.3354/cr01633.
- Ceron, W. L., M. T. Kayano, R. V. Andreoli, A. Avila-Diaz, I. P. de Souza, and R. A. F. Souza, 2021: Pacific and Atlantic Multidecadal Variability Relations with the Choco and Caribbean Low-Level Jets during the 1900-2015 Period. Atmosphere, 12, doi:10.3390/atmos12091120.
- Chai, R. F., and Coauthors, 2021: Human-caused long-term changes in global aridity. Npj Climate and Atmospheric Science, 4, doi:10.1038/s41612-021-00223-5.
- Chakravorty, S., R. C. Perez, C. Gnanaseelan, and B. T. Anderson, 2021: Revisiting the Recharge and Discharge Processes for Different Flavors of El Nino. Journal of Geophysical Research-Oceans, 126, doi:10.1029/2020jc017075.
- Chen, S. F., R. G. Wu, and W. Chen, 2021: Influence of North Atlantic sea surface temperature anomalies on springtime surface air temperature variation over Eurasia in CMIP5 models. Climate Dynamics, 57, 2669-2686, doi:10.1007/s00382-021-05826-5.
- Chimani, B., I. Auer, M. Prohom, M. Nadbath, A. Paul, and D. Rasol, 2022: Data rescue in selected countries in connection with the EUMETNET DARE activity. Geoscience Data Journal, 9, 187-200, doi:10.1002/gdj3.128.
- Chinta, V., Z. S. Chen, Y. Du, and J. S. Chowdary, 2022: Influence of the Interdecadal Pacific Oscillation on South Asian and East Asian summer monsoon rainfall in CMIP6 models. Climate Dynamics, 58, 1791-1809, doi:10.1007/s00382-021-05992-6.
- Chun, K. P., and Coauthors, 2021: Identifying drivers of streamflow extremes in West Africa to inform a nonstationary prediction model. Weather and Climate Extremes, 33, doi:10.1016/j.wace.2021.100346.
- Codilean, A. T., and Coauthors, 2021: Controls on denudation along the East Australian continental margin. Earth-Science Reviews, 214, doi:10.1016/j.earscirev.2021.103543.
- Coffel, E. D., and J. S. Mankin, 2021: Thermal power generation is disadvantaged in a warming world. Environmental Research Letters, 16, doi:10.1088/1748-9326/abd4a8.
- Dahri, Z. H., and Coauthors, 2021: Spatio-temporal evaluation of gridded precipitation products for the high-altitude Indus basin. International Journal of Climatology, 41, 4283-4306, doi:10.1002/joc.7073.
- Dangendorf, S., T. Frederikse, L. Chafik, J. M. Klinck, T. Ezer, and B. D. Hamlington, 2021: Data-driven reconstruction reveals large-scale ocean circulation control on coastal sea level. Nature Climate Change, 11, 514-+, doi:10.1038/s41558-021-01046-1.
- de Oliveira, M. M. F., J. L. F. de Oliveira, P. J. F. Fernandes, E. Gilleland, and N. F. F. Ebecken, 2021: Extreme climatic characteristics near the coastline of the southeast region of Brazil in the last 40 years. Theoretical and Applied Climatology, 146, 657-674, doi:10.1007/s00704-021-03711-z.
- Deepa, J. S., and C. Gnanaseelan, 2021: The decadal sea level variability observed in the Indian Ocean tide gauge records and its association with global climate modes. Global and Planetary Change, 198, doi:10.1016/j.gloplacha.2021.103427.
- Devers, A., J. P. Vidal, C. Lauvernet, and O. Vannier, 2021: FYRE Climate: a high-resolution reanalysis of daily precipitation and temperature in France from 1871 to 2012. Climate of the Past, 17, 1857-1879, doi:10.5194/cp-17-1857-2021.
- Dey, R., M. Bador, L. V. Alexander, and S. C. Lewis, 2021: The drivers of extreme rainfall event timing in Australia. International Journal of Climatology, 41, 6654-6673, doi:10.1002/joc.7218.
- Ding, Z. M., and R. G. Wu, 2021: Seasonally changing contribution of sea ice and snow cover to uncertainty in multi-decadal Eurasian surface air temperature trends based on CESM simulations. Climate Dynamics, 57, 917-932, doi:10.1007/s00382-021-05746-4.
- Diodato, N., I. Gomara, A. Baronetti, S. Fratianni, and G. Bellocchi, 2021: Reconstruction of erosivity density in northwest Italy since 1701. Hydrological Sciences Journal-Journal Des Sciences Hydrologiques, 66, 1185-1196, doi:10.1080/02626667.2021.1918696.
- Dong, T. Y., and W. J. Dong, 2021: Evaluation of extreme precipitation over Asia in CMIP6 models. Climate Dynamics, 57, 1751-1769, doi:10.1007/s00382-021-05773-1.
- Dosio, A., I. Pinto, C. Lennard, M. B. Sylla, C. Jack, and G. Nikulin, 2021: What Can We Know About Recent Past Precipitation Over Africa? Daily Characteristics of African Precipitation From a Large Ensemble of Observational Products for Model Evaluation. Earth and Space Science, 8, doi:10.1029/2020ea001466.
- Duan, J., and Coauthors, 2021: Rapid Sea Level Rise in the Southern Hemisphere Subtropical Oceans. J. Clim., 34, 9401-9423, doi:10.1175/jcli-d-21-0248.1.
- Eade, R., D. B. Stephenson, A. A. Scaife, and D. M. Smith, 2022: Quantifying the rarity of extreme multi-decadal trends: how unusual was the late twentieth century trend in the North Atlantic Oscillation? Climate Dynamics, 58, 1555-1568, doi:10.1007/s00382-021-05978-4.
- Emanuel, K., 2021: Atlantic tropical cyclones downscaled from climate reanalyses show increasing activity over past 150 years. Nature Communications, 12, doi:10.1038/s41467-021-27364-8.
- Ezer, T., and S. Dangendorf, 2021: Variability and upward trend in the kinetic energy of western boundary currents over the last century: impacts from barystatic and dynamic sea level change. Climate Dynamics, 57, 2351-2373, doi:10.1007/s00382-021-05808-7.
- Fan, F. X., R. P. Lin, X. H. Fang, F. Xue, F. Zheng, and J. Zhu, 2021: Influence of the Eastern Pacific and Central Pacific Types of ENSO on the South Asian Summer Monsoon. Advances in Atmospheric Sciences, 38, 12-28, doi:10.1007/s00376-020-0055-1.
- Fang, J. Y., T. Wahl, J. Fang, X. Sun, F. Kong, and M. Liu, 2021: Compound flood potential from storm surge and heavy precipitation in coastal China: dependence, drivers, and impacts. Hydrology and Earth System Sciences, 25, 4403-4416, doi:10.5194/hess-25-4403-2021.
- Feliks, Y., J. Small, and M. Ghil, 2021: Global oscillatory modes in high-end climate modeling and reanalyses. Climate Dynamics, 57, 3385-3411, doi:10.1007/s00382-021-05872-z.
- Feng, X. F., and Coauthors, 2021: A Multidecadal-Scale Tropically Driven Global Teleconnection over the Past Millennium and Its Recent Strengthening. J. Clim., 34, 2549-2565, doi:10.1175/jcli-d-20-0216.1.
- Feng, X. F., and L. G. Wu, 2021: The Contribution of Internal Variability to Asian Midlatitude Warming. J. Clim., 34, 2429-2439, doi:10.1175/jcli-d-20-0231.1.
- Feser, F., O. Krueger, K. Woth, and L. van Garderen, 2021: North Atlantic Winter Storm Activity in Modern Reanalyses and Pressure-Based Observations. J. Clim., 34, 2411-2428, doi:10.1175/jcli-d-20-0529.1.
- Freund, M. B., A. G. Marshall, M. C. Wheeler, and J. N. Brown, 2021: Central Pacific El Nino as a Precursor to Summer Drought-Breaking Rainfall Over Southeastern Australia. Geophysical Research Letters, 48, doi:10.1029/2020gl091131.
- Gagnon-Poire, A., P. Brigode, P. Francus, D. Fortin, P. Lajeunesse, H. Dorion, and A. P. Trottier, 2021: Reconstructing past hydrology of eastern Canadian boreal catchments using clastic varved sediments and hydro-climatic modelling: 160 years of fluvial inflows. Climate of the Past, 17, 653-673, doi:10.5194/cp-17-653-2021.
- Galbraith, P. S., P. Larouche, and C. Caverhill, 2021: A Sea-Surface Temperature Homogenization Blend for the Northwest Atlantic. Canadian Journal of Remote Sensing, 47, 554-568, doi:10.1080/07038992.2021.1924645.
- Gallego, D., R. Garcia-Herrera, T. Losada, E. Mohino, and B. R. de Fonseca, 2021: A Shift in the Wind Regime of the Southern End of the Canary Upwelling System at the Turn of the 20th Century. Journal of Geophysical Research-Oceans, 126, doi:10.1029/2020jc017093.
- Garrison, C., C. Kilburn, D. Smart, and S. Edwards, 2021: The blue suns of 1831: was the eruption of Ferdinandea, near Sicily, one of the largest volcanic climate forcing events of we nineteenth century? Climate of the Past, 17, 2607-2632, doi:10.5194/cp-17-2607-2021.
- Gauthier, N., K. J. Anchukaitis, and B. Coulthard, 2022: Pattern-based downscaling of snowpack variability in the western United States. Climate Dynamics, 58, 3225-3241, doi:10.1007/s00382-021-06094-z.
- Gergis, J., Z. Baillie, S. Ingallina, L. Ashcroft, and T. Ellwood, 2021: A historical climate dataset for southwestern Australia, 1830-1875. International Journal of Climatology, 41, 4898-4919, doi:10.1002/joc.7105.
- Gil-Guirado, S., A. Perez-Morales, D. Pino, J. C. Pena, and F. L. Martinez, 2022: Flood impact on the Spanish Mediterranean coast since 1960 based on the prevailing synoptic patterns. Science of the Total Environment, 807, doi:10.1016/j.scitotenv.2021.150777.
- Gong, Z. Q., Y. S. Liu, C. Sun, J. Zhang, J. P. Li, and C. M. Shi, 2021: Linking AMOC Variations With the Multidecadal Seesaw in Tropical Cyclone Activity Between Eastern North Pacific and Atlantic. Journal of Geophysical Research-Oceans, 126, doi:10.1029/2021jc017308.
- Gray, J. L., J. B. D. Jaffres, D. C. Verdon-Kidd, M. G. Hewson, J. M. Clarke, A. Pepler, and N. B. English, 2021: A comparison of the MATCHES and NCEP1 databases for use in Australian east coast low studies. Weather and Climate Extremes, 34, doi:10.1016/j.wace.2021.100400.
- Gutenstein, M., K. Fennig, M. Schroder, T. Trent, S. Bakan, J. B. Roberts, and F. R. Robertson, 2021: Intercomparison of freshwater fluxes over ocean and investigations into water budget closure. Hydrology and Earth System Sciences, 25, 121-146, doi:10.5194/hess-25-121-2021.
- Han, S. Z., and J. Q. Sun, 2021: A skillful prediction scheme for April precipitation over central East China. Atmospheric Research, 261, doi:10.1016/j.atmosres.2021.105737.
- Haslinger, K., M. Hofstatter, W. Schoner, and G. Bloschl, 2021: Changing summer precipitation variability in the Alpine region: on the role of scale dependent atmospheric drivers. Climate Dynamics, 57, 1009-1021, doi:10.1007/s00382-021-05753-5.
- He, K. J., and Coauthors, 2021: Effect of preceding soil moisture-snow cover anomalies around Turan Plain on June precipitation over the southern Yangtze River valley. Atmospheric Research, 264, doi:10.1016/j.atmosres.2021.105853.
- Helama, S., and Coauthors, 2021: Recurrent transitions to Little Ice Age-like climatic regimes over the Holocene. Climate Dynamics, 56, 3817-3833, doi:10.1007/s00382-021-05669-0.
- Hiraga, Y., Y. Iseri, M. D. Warner, C. D. Frans, A. M. Duren, J. F. England, and M. L. Kavvas, 2021: Estimation of Long-duration Maximum Precipitation during a winter season for large basins dominated by Atmospheric Rivers using a Numerical Weather Model. Journal of Hydrology, 598, doi:10.1016/j.jhydrol.2021.126224.
- Hochet, A., G. Dodet, F. Ardhuin, M. Hemer, and I. Young, 2021: Sea State Decadal Variability in the North Atlantic: A Review. Climate, 9, doi:10.3390/cli9120173.
- Hoerling, M., L. Smith, X. W. Quan, J. Eischeid, J. Barsugli, and H. F. Diaz, 2021: Explaining the Spatial Pattern of US Extreme Daily Precipitation Change. J. Clim., 34, 2759-2775, doi:10.1175/jcli-d-20-0666.1.
- Hong, X., and J. Li, 2021: A beta-advection typhoon track model and its application for typhoon hazard assessment. Journal of Wind Engineering and Industrial Aerodynamics, 208, doi:10.1016/j.jweia.2020.104439.
- Horsburgh, K., I. D. Haigh, J. Williams, M. De Dominicis, J. Wolf, A. Inayatillah, and D. Byrne, 2021: "Grey swan" storm surges pose a greater coastal flood hazard than climate change. Ocean Dynamics, 71, 715-730, doi:10.1007/s10236-021-01453-0.
- Horton, P., 2022: Analogue methods and ERA5: Benefits and pitfalls. International Journal of Climatology, 42, 4078-4096, doi:10.1002/joc.7484.
- Hyncica, M., and R. Huth, 2022: Temporal evolution of relationships between temperature and circulation modes in five reanalyses. International Journal of Climatology, 42, 4391-4404, doi:10.1002/joc.7474.
- Imfeld, N., L. Haimberger, A. Sterin, Y. Brugnara, and S. Bronnimann, 2021: Intercomparisons, error assessments, and technical information on historical upper-air measurements. Earth System Science Data, 13, 2471-2485, doi:10.5194/essd-13-2471-2021.
- Jacques-Coper, M., D. Veloso-Aguila, C. Segura, and A. Valencia, 2021: Intraseasonal teleconnections leading to heat waves in central Chile. International Journal of Climatology, 41, 4712-4731, doi:10.1002/joc.7096.
- Janicke, L., and Coauthors, 2021: Assessment of Tidal Range Changes in the North Sea From 1958 to 2014. Journal of Geophysical Research-Oceans, 126, doi:10.1029/2020jc016456.
- Jeong, J., and Coauthors, 2021: Using the International Tree-Ring Data Bank (ITRDB) records as century-long benchmarks for global land-surface models. Geoscientific Model Development, 14, 5891-5913, doi:10.5194/gmd-14-5891-2021.
- Jia, B. H., and Coauthors, 2021: CAS-LSM Datasets for the CMIP6 Land Surface Snow and Soil Moisture Model Intercomparison Project. Advances in Atmospheric Sciences, 38, 862-874, doi:10.1007/s00376-021-0293-x.
- Jiang, H., W. H. Xu, S. Yang, Y. N. Zhu, Z. J. Zhou, and J. Liao, 2021: Development of an Integrated Global Land Surface Dataset from 1901 to 2018. Journal of Meteorological Research, 35, 789-798, doi:10.1007/s13351-021-1058-2. Jing, B. Y., H. H. Tong, Y. D. Zhu, and Acm, 2021: Network of Tensor Time Series. 30th World Wide Web Conference (WWW), Electr Network, 2425-2437.
- Jones, E., A. A. Wing, and R. Parfitt, 2021: A Global Perspective of Tropical Cyclone Precipitation in Reanalyses. J. Clim., 34, 8461-8480, doi:10.1175/jcli-d-20-0892.1.
- Joshi, M. K., M. A. Abid, and F. Kucharski, 2021: The Role of an Indian Ocean Heating Dipole in the ENSO Teleconnection to the North Atlantic European Region in Early Winter during the Twentieth Century in Reanalysis and CMIP5 Simulations. J. Clim., 34, 1047-1060, doi:10.1175/jcli-d-20-0269.1.
- Kajtar, J. B., A. Santoso, M. Collins, A. S. Taschetto, M. H. England, and L. M. Frankcombe, 2021: CMIP5 Intermodel Relationships in the Baseline Southern Ocean Climate System and With Future Projections. Earths Future, 9, doi:10.1029/2020ef001873.
- Karimi, A. A., M. Bagherbandi, and M. Horemuz, 2021: Multidecadal Sea Level Variability in the Baltic Sea and Its Impact on Acceleration Estimations. Frontiers in Marine Science, 8, doi:10.3389/fmars.2021.702512.
- Karmalkar, A. V., and R. M. Horton, 2021: Drivers of exceptional coastal warming in the northeastern United States. Nature Climate Change, 11, 854-+, doi:10.1038/s41558-021-01159-7.
- Kim, D. I., D. W. Han, and T. Lee, 2021: Reanalysis Product-Based Nonstationary Frequency Analysis for Estimating Extreme Design Rainfall. Atmosphere, 12, doi:10.3390/atmos12020191.
- Kim, W. M., and C. C. Raible, 2021: Dynamies of the Mediterranean droughts from 850 to 2099 CE in the Community Earth System Model. Climate of the Past, 17, 887-911, doi:10.5194/cp-17-887-2021.
- Klotzbach, P. J., C. J. Schreck, G. P. Compo, S. G. Bowen, E. J. Gibney, E. C. J. Oliver, and M. M. Bell, 2021: The Record-Breaking 1933 Atlantic Hurricane Season. Bulletin of the American Meteorological Society, 102, E446-E463, doi:10.1175/bams-d-19-0330.1.
- Knoflach, B., and Coauthors, 2021: Modelling of Vegetation Dynamics from Satellite Time Series to Determine Proglacial Primary Succession in the Course of Global Warming-A Case Study in the Upper Martell Valley (Eastern Italian Alps). Remote Sensing, 13, doi:10.3390/rs13214450.
- Labe, Z. M., and E. A. Barnes, 2021: Detecting Climate Signals Using Explainable AI With Single-Forcing Large Ensembles. Journal of Advances in Modeling Earth Systems, 13, doi:10.1029/2021ms002464.
- Le Bras, I., F. Straneo, M. Muilwijk, L. H. Smedsrud, F. L. Li, M. S. Lozier, and N. P. Holliday, 2021: How Much Arctic Fresh Water Participates in the Subpolar Overturning Circulation? J Phys Oceanogr, 51, 955-973, doi:10.1175/jpo-d-20-0240.1.
- Lee, J., and Coauthors, 2021: Robust Evaluation of ENSO in Climate Models: How Many Ensemble Members Are Needed? Geophysical Research Letters, 48, doi:10.1029/2021gl095041.
- Lee, J., K. R. Sperber, P. J. Gleckler, K. E. Taylor, and C. J. W. Bonfils, 2021: Benchmarking Performance Changes in the Simulation of Extratropical Modes of Variability across CMIP Generations. J. Clim., 34, 6945-6969, doi:10.1175/jcli-d-20-0832-1.
- Lejk, A. M., S. Smolinski, G. Radtke, and A. Martyniak, 2021: Higher growth variability and stronger responses to temperature changes in wild than hatchery-reared sea trout (Salmo trutta L.). Ecology and Evolution, 11, 10207-10224, doi:10.1002/ece3.7827.
- Li, J., and X. Hong, 2021: Typhoon hazard analysis based on the probability density evolution theory. Journal of Wind Engineering and Industrial Aerodynamics, 219, doi:10.1016/j.jweia.2021.104796.
- Li, J. P., and Coauthors, 2022: Influence of the NAO on Wintertime Surface Air Temperature over East Asia: Multidecadal Variability and Decadal Prediction. Advances in Atmospheric Sciences, 39, 625-642, doi:10.1007/s00376-021-1075-1.
- Li, L. F., M. S. Lozier, and F. L. Li, 2022: Century-long cooling trend in subpolar North Atlantic forced by atmosphere: an alternative explanation. Climate Dynamics, 58, 2249-2267, doi:10.1007/s00382-021-06003-4.
- Li, R. C., and Coauthors, 2021: Simulated response of the active layer thickness of permafrost to climate change. Atmospheric and Oceanic Science Letters, 14, doi:10.1016/j.aosl.2020.100007.
- Li, T., and Coauthors, 2021: Refining the empirical global pressure and temperature model with the ERA5 reanalysis and radiosonde data. Journal of Geodesy, 95, doi:10.1007/s00190-021-01478-9.
- Li, X. C., and Coauthors, 2021: Local and remote SST variability contribute to the westward shift of the Pacific Walker circulation during 1979-2015. Geoscience Letters, 8, doi:10.1186/s40562-021-00180-0.
- Li, Y., Q. L. Chen, N. Xing, Z. G. Cheng, Y. L. Qi, F. Feng, and M. G. Li, 2021: Long-Term Trend of Equatorial Atlantic Zonal Sea Surface Temperature Gradient Linked to the Tropical Pacific Cold Tongue Mode Under Global Warming. Journal of Geophysical Research-Oceans, 126, doi:10.1029/2020jc017132.
- Liao, C. F., J. Ma, H. M. Xu, L. Wang, and H. Guo, 2021: The Impact of the Atlantic Multidecadal Oscillation on the Interannual Relationship Between the Storm Track and SST Over the North Atlantic in Spring. Atmosphere-Ocean, 59, 152-164, doi:10.1080/07055900.2021.1927665.
- Ling, X. L., and Coauthors, 2021: Comprehensive evaluation of satellite-based and reanalysis soil moisture products using in situ observations over China. Hydrology and Earth System Sciences, 25, 4209-4229, doi:10.5194/hess-25-4209-2021.
- Liu, F. Y., W. J. Zhang, F. F. Jin, and S. Q. Hu, 2021: Decadal Modulation of the ENSO-Indian Ocean Basin Warming Relationship during the Decaying Summer by the Interdecadal Pacific Oscillation. J. Clim., 34, 2685-2699, doi:10.1175/jcli-d-20-0457.1.
- Liu, K. S., J. C. L. Chan, and H. Kubota, 2021: Meridional oscillation of tropical cyclone activity in the western North Pacific during the past 110 years. Climatic Change, 164, doi:10.1007/s10584-021-02983-8.
- Liu, Y. S., C. Sun, Z. Q. Gong, J. P. Li, and Z. Shi, 2022: Multidecadal seesaw in cold wave frequency between central Eurasia and Greenland and its relation to the Atlantic Multidecadal Oscillation. Climate Dynamics, 58, 1403-1418, doi:10.1007/s00382-021-05967-7.
- Liu, Y. X., L. Zhuo, M. Pregnolato, and D. W. Han, 2022: An assessment of statistical interpolation methods suited for gridded rainfall datasets. International Journal of Climatology, 42, 2754-2772, doi:10.1002/joc.7389.
- Lubken, F. J., G. Baumgarten, and U. Berger, 2021: Long term trends of mesopheric ice layers: A model study. Journal of Atmospheric and Solar-Terrestrial Physics, 214, doi:10.1016/j.jastp.2020.105378.
- Lupikasza, E. B., T. Niedzwiedz, R. Przybylak, and O. Nordli, 2021: Importance of regional indices of atmospheric circulation for periods of warming and cooling in Svalbard during 1920-2018. International Journal of Climatology, 41, 3481-3502, doi:10.1002/joc.7031.
- Mahendra, N., J. S. Chowdary, P. Darshana, P. Sunitha, A. Parekh, and C. Gnanaseelan, 2021: Interdecadal modulation of interannual ENSO-Indian summer monsoon rainfall teleconnections in observations and CMIP6 models: Regional patterns. International Journal of Climatology, 41, 2528-2552, doi:10.1002/joc.6973.
- Maroon, E. A., S. G. Yeager, G. Danabasoglu, and N. Rosenbloom, 2021: Was the 2015 North Atlantic Subpolar Cold Anomaly Predictable? J. Clim., 34, 5403-5423, doi:10.1175/jcli-d-20-0750.1.
- Materia, S., and Coauthors, 2022: Summer temperature response to extreme soil water conditions in the Mediterranean transitional climate regime. Climate Dynamics, 58, 1943-1963, doi:10.1007/s00382-021-05815-8.
- McKenna, C. M., and A. C. Maycock, 2021: Sources of Uncertainty in Multimodel Large Ensemble Projections of the Winter North Atlantic Oscillation. Geophysical Research Letters, 48, doi:10.1029/2021gl093258.
- Medvedev, I., and A. Medvedeva, 2021: Seasonal and Decadal Variations of the Variance of the Synoptic and Mesoscale Sea Level Variability in the Baltic Sea. Water, 13, doi:10.3390/w13131785.
- Mengel, M., S. Treu, S. Lange, and K. Frieler, 2021: ATTRICI v1.1-counterfactual climate for impact attribution. Geoscientific Model Development, 14, 5269-5284, doi:10.5194/gmd-14-5269-2021.
- Miao, J. P., and D. B. Jiang, 2021: Multidecadal Variations in the East Asian Winter Monsoon and Their Relationship with the Atlantic Multidecadal Oscillation since 1850. J. Clim., 34, 7525-7539, doi:10.1175/jcli-d-21-0073.1.
- Mohanty, M. P., and S. P. Simonovic, 2021: Fidelity of reanalysis datasets in floodplain mapping: Investigating performance at inundation level over large regions. Journal of Hydrology, 597, doi:10.1016/j.jhydrol.2020.125757.
- Molina, M. O., C. Gutierrez, and E. Sanchez, 2021: Comparison of ERA5 surface wind speed climatologies over Europe with observations from the HadISD dataset. International Journal of Climatology, 41, 4864-4878, doi:10.1002/joc.7103.
- Murphy, L. N., J. M. Klavans, A. C. Clement, and M. A. Cane, 2021: Investigating the Roles of External Forcing and Ocean Circulation on the Atlantic Multidecadal SST Variability in a Large Ensemble Climate Model Hierarchy. J. Clim., 34, 4835-4849, doi:10.1175/jcli-d-20-0167.1.
- Nagashima, K., J. Addison, T. Irino, T. Omori, K. Yoshimura, and N. Harada, 2022: Aleutian Low variability for the last 7500 years and its relation to the Westerly Jet. Quaternary Research, 108, 161-179, doi:10.1017/qua.2020.116.
- Ng, B., W. J. Cai, T. Cowan, and D. H. Bi, 2021: Impacts of Low-Frequency Internal Climate Variability and Greenhouse Warming on El Nino-Southern Oscillation. J. Clim., 34, 2205-2218, doi:10.1175/jcli-d-20-0232.1.
- O'Kane, T. J., and Coauthors, 2021: CAFE60v1: A 60-Year Large Ensemble Climate Reanalysis. Part I: System Design, Model Configuration, and Data Assimilation. J. Clim., 34, 5153-5169, doi:10.1175/jcli-d-20-0974.1.
- O'Kane, T. J., and Coauthors, 2021: CAFE60v1: A 60-Year Large Ensemble Climate Reanalysis. Part II: Evaluation. J. Clim., 34, 5171-5194, doi:10.1175/jcli-d-20-0518.1.
- O'Reilly, C. H., D. J. Befort, A. Weisheimer, T. Woollings, A. Ballinger, and G. Hegerl, 2021: Projections of northern hemisphere extratropical climate underestimate internal variability and associated uncertainty. Communications Earth & Environment, 2, doi:10.1038/s43247-021-00268-7.
- Oh, J., and Y. Jung, 2021: Local climate impacts of dipole-like sea surface temperature oscillations in the Southern Hemisphere. Journal of Water and Climate Change, 12, 311-324, doi:10.2166/wcc.2020.113.
- Osman, M. B., S. Coats, S. B. Das, J. R. McConnell, and N. Chellman, 2021: North Atlantic jet stream projections in the context of the past 1,250 years. Proceedings of the National Academy of Sciences of the United States of America, 118, doi:10.1073/pnas.2104105118.
- Osman, M. B., and Coauthors, 2021: Abrupt Common Era hydroclimate shifts drive west Greenland ice cap change. Nature Geoscience, 14, 756-+, doi:10.1038/s41561-021-00818-w.
- Otto-Bliesner, B. L., and Coauthors, 2021: Large-scale features of Last Interglacial climate: results from evaluating the lig127k simulations for the Coupled Model Intercomparison Project (CMIP6)-Paleoclimate Modeling Intercomparison Project (PMIP4). Climate of the Past, 17, 63-94, doi:10.5194/cp-17-63-2021.
- Perkins, W. A., and G. J. Hakim, 2021: Coupled Atmosphere-Ocean Reconstruction of the Last Millennium Using Online Data Assimilation. Paleoceanography and Paleoclimatology, 36, doi:10.1029/2020pa003959.
- Pettit, J. L., and Coauthors, 2021: Both Cyclone-induced and Convective Storms Drive Disturbance Patterns in European Primary Beech Forests. Journal of Geophysical Research-Atmospheres, 126, doi:10.1029/2020jd033929.
- Pineau-Guillou, L., P. Lazure, and G. Woppelmann, 2021: Large-scale changes of the semidiurnal tide along North Atlantic coasts from 1846 to 2018. Ocean Science, 17, 17-34, doi:10.5194/os-17-17-2021.
- Planton, Y. Y., and Coauthors, 2021: Evaluating Climate Models with the CLIVAR 2020 ENSO Metrics Package. Bulletin of the American Meteorological Society, 102, E193-E217, doi:10.1175/bams-d-19-0337.1.
- Poletti, S., and I. Staffell, 2021: Understanding New Zealand's wind resources as a route to 100% renewable electricity. Renewable Energy, 170, 449-461, doi:10.1016/j.renene.2021.01.053.
- Power, S., and Coauthors, 2021: Decadal climate variability in the tropical Pacific: Characteristics, causes, predictability, and prospects. Science, 374, 48-+, doi:10.1126/science.aay9165.
- Prado, L. F., I. Wainer, and R. B. de Souza, 2021: The Representation of the Southern Annular Mode Signal in the Brazilian Earth System Model. Atmosphere, 12, doi:10.3390/atmos12081045.
- Prado, L. F., I. Wainer, E. Yokoyama, M. Khodri, and J. Garnier, 2021: Changes in summer precipitation variability in central Brazil over the past eight decades. International Journal of Climatology, 41, 4171-4186, doi:10.1002/joc.7065.
- Prado-Cabrero, A., and J. M. Nolan, 2021: Omega-3 nutraceuticals, climate change and threats to the environment: The cases of Antarctic krill and Calanus finmarchicus. Ambio, 50, 1184-1199, doi:10.1007/s13280-020-01472-z.
- Qi, L., 2022: Decadal shift of the interannual relationship between western North Pacific tropical cyclone genesis frequency and South China Sea monsoon trough around 1980s. International Journal of Climatology, 42, 4289-4299, doi:10.1002/joc.7465.
- Raicich, F., and R. R. Colucci, 2021: A mean-sea-level pressure time series for Trieste, Italy (1841-2018). Earth System Science Data, 13, 3363-3377, doi:10.5194/essd-13-3363-2021.
- Rajesh, P. V., B. N. Goswami, B. A. Choudhury, and Y. Zahan, 2021: Large Sensitivity of Simulated Indian Summer Monsoon Rainfall (ISMR) to Global Warming: Implications of ISMR Projections. Journal of Geophysical Research-Atmospheres, 126, doi:10.1029/2020jd033511.
- Rani, S. I., and Coauthors, 2021: IMDAA: High-Resolution Satellite-Era Reanalysis for the Indian Monsoon Region. J. Clim., 34, 5109-5133, doi:10.1175/jcli-d-20-0412.1.
- Rimbu, N., M. Ionita, and G. Lohmann, 2021: A Synoptic Scale Perspective on Greenland Ice Core delta O-18 Variability and Related Teleconnection Patterns. Atmosphere, 12, doi:10.3390/atmos12030294.
- Ruane, A. C., and Coauthors, 2021: Strong regional influence of climatic forcing datasets on global crop model ensembles. Agricultural and Forest Meteorology, 300, doi:10.1016/j.agrformet.2020.108313.
- Saemian, P., and Coauthors, 2021: Comprehensive evaluation of precipitation datasets over Iran. Journal of Hydrology, 603, doi:10.1016/j.jhydrol.2021.127054.
- Sanchez, S. C., G. J. Hakim, and C. P. Saenger, 2021: Climate Model Teleconnection Patterns Govern the Nino-3.4 Response to Early Nineteenth-Century Volcanism in Coral-Based Data Assimilation Reconstructions. J. Clim., 34, 1863-1880, doi:10.1175/jcli-d-20-0549.1.
- Sanchez, S. C., and K. B. Karnauskas, 2021: Diversity in the Persistence of El Nino Events Over the Last Millennium. Geophysical Research Letters, 48, doi:10.1029/2021gl093698.
- Sasaki, Y. N., and C. Umeda, 2021: Rapid Warming of Sea Surface Temperature along the Kuroshio and the China Coast in the East China Sea during the Twentieth Century. J. Clim., 34, 4803-4815, doi:10.1175/jcli-d-20-0421.1.
- Sayani, H. R., D. M. Thompson, J. E. Carilli, T. M. Marchitto, A. U. Chapman, and K. M. Cobb, 2021: Reproducibility of Coral Mn/Ca-Based Wind Reconstructions at Kiritimati Island and Butaritari Atoll. Geochemistry Geophysics Geosystems, 22, doi:10.1029/2020gc009398.
- Scaife, A. A., and Coauthors, 2021: The UK-China Climate Science to Service Partnership. Bulletin of the American Meteorological Society, 102, E1563-E1578, doi:10.1175/bams-d-20-0055.1.
- Scholz, S. R., and Coauthors, 2022: Changing hydroclimate dynamics and the 19th to 20th century wetting trend in the English Channel region of northwest Europe. Climate Dynamics, 58, 1539-1553, doi:10.1007/s00382-021-05977-5.
- Sekulic, A., M. Kilibarda, D. Protic, and B. Bajat, 2021: A high-resolution daily gridded meteorological dataset for Serbia made by Random Forest Spatial Interpolation. Scientific Data, 8, doi:10.1038/s41597-021-00901-2.
- Semenov, V. A., 2021: Modern Arctic Climate Research: Progress, Change of Concepts, and Urgent Problems. Izvestiya Atmospheric and Oceanic Physics, 57, 18-28, doi:10.1134/s0001433821010114.
- Serykh, I. V., and D. M. Sonechkin, 2021: El Nino-Global Atmospheric Oscillation as the Main Mode of Interannual Climate Variability. Atmosphere, 12, doi:10.3390/atmos12111443.
- Shen, C., J. L. Zha, J. Wu, and D. M. Zhao, 2021: Centennial-Scale Variability of Terrestrial Near-Surface Wind Speed over China from Reanalysis. J. Clim., 34, 5829-5846, doi:10.1175/jcli-d-20-0436.1.
- Shen, C., J. L. Zha, D. M. Zhao, J. Wu, W. X. Fan, M. X. Yang, and Z. B. Li, 2021: Estimating centennial-scale changes in global terrestrial near-surface wind speed based on CMIP6 GCMs. Environmental Research Letters, 16, doi:10.1088/1748-9326/ac1378.
- Shi, W. J., Q. Z. Wang, Z. N. Xiao, W. Cheng, and W. Duan, 2021: Modulation of Atlantic Multidecadal Oscillation on the Interdecadal Variation of South Asian High and Somali Jet in Summer. Frontiers in Earth Science, 9, doi:10.3389/feart.2021.772202.
- Si, D., D. B. Jiang, and Y. H. Ding, 2021: Synergistic Impacts of the Atlantic and Pacific Oceans on Interdecadal Variations of Summer Rainfall in Northeast Asia. Journal of Meteorological Research, 35, 844-856, doi:10.1007/s13351-021-0191-2.
- Siew, P. Y. F., C. Li, M. F. Ting, S. P. Sobolowski, Y. T. Wu, and X. D. Chen, 2021: North Atlantic Oscillation in winter is largely insensitive to autumn Barents-Kara sea ice variability. Science Advances, 7, doi:10.1126/sciadv.abg4893.
- Slivinski, L. C., and Coauthors, 2021: An Evaluation of the Performance of the Twentieth Century Reanalysis Version 3. J. Clim., 34, 1417-1438, doi:10.1175/jcli-d-20-0505.1.
- Storto, A., M. A. Balmaseda, E. de Boisseson, B. S. Giese, S. Masina, and C. X. Yang, 2021: The 20th century global warming signature on the ocean at global and basin scales as depicted from historical reanalyses. International Journal of Climatology, 41, 5977-5997, doi:10.1002/joc.7163.
- Stratimirovic, D., I. Batas-Bjelic, V. Djurdjevic, and S. Blesic, 2021: Changes in long-term properties and natural cycles of the Danube river level and flow induced by damming. Physica a-Statistical Mechanics and Its Applications, 566, doi:10.1016/j.physa.2020.125607.
- Suarez-Moreno, R., Y. Kushnir, and R. Seager, 2022: Observational analysis of decadal and long-term hydroclimate drivers in the Mediterranean region: role of the ocean-atmosphere system and anthropogenic forcing. Climate Dynamics, 58, 2079-2107, doi:10.1007/s00382-021-05765-1.
- Sullivan, R. M., P. J. van Hengstum, S. J. Coats, J. P. Donnelly, A. E. Tamalavage, T. S. Winkler, and N. A. Albury, 2021: Hydroclimate Dipole Drives Multi-Centennial Variability in the Western Tropical North Atlantic Margin During the Middle and Late Holocene. Paleoceanography and Paleoclimatology, 36, doi:10.1029/2020pa004184.
- Sun, C., Y. S. Liu, J. Q. Xue, F. Kucharski, J. P. Li, and X. C. Li, 2021: The importance of inter-basin atmospheric teleconnection in the SST footprint of Atlantic multidecadal oscillation over western Pacific. Climate Dynamics, 57, 239-252, doi:10.1007/s00382-021-05705-z.
- Sung, H. M., and Coauthors, 2021: Climate Change Projection in the Twenty-First Century Simulated by NIMS-KMA CMIP6 Model Based on New GHGs Concentration Pathways. Asia-Pacific Journal of Atmospheric Sciences, 57, 851-862, doi:10.1007/s13143-021-00225-6.
- Svendsen, L., N. Keenlyside, M. Muilwijk, I. Bethke, N. E. Omrani, and Y. Q. Gao, 2021: Pacific contribution to decadal surface temperature trends in the Arctic during the twentieth century. Climate Dynamics, 57, 3223-3243, doi:10.1007/s00382-021-05868-9.
- Szuwalski, C., and Coauthors, 2021: Climate change and the future productivity and distribution of crab in the Bering Sea. Ices J Mar Sci, 78, 502-515, doi:10.1093/icesjms/fsaa140.
- Tadesse, M. G., and T. Wahl, 2021: A database of global storm surge reconstructions. Scientific Data, 8, doi:10.1038/s41597-021-00906-x.
- Tan, P. H., J. Y. Tu, and M. Y. Tsai, 2021: Large-scale processes modulating the frequency of typhoons affecting Taiwan during 1900-1945. Terrestrial Atmospheric and Oceanic Sciences, 32, 1197-1213, doi:10.3319/tao.2021.11.29.01.
- Tang, T., J. J. Luo, K. Peng, L. Qi, and S. L. Tang, 2021: Over-projected Pacific warming and extreme El Nino frequency due to CMIP5 common biases. National Science Review, 8, doi:10.1093/nsr/nwab056.
- Taszarek, M., N. Pilguj, J. T. Allen, V. Gensini, H. E. Brooks, and P. Szuster, 2021: Comparison of Convective Parameters Derived from ERA5 and MERRA-2 with Rawinsonde Data over Europe and North America. J. Clim., 34, 3211-3237, doi:10.1175/jcli-d-20-0484.1.
- Teckentrup, L., M. G. De Kauwe, A. J. Pitman, and B. Smith, 2021: Examining the sensitivity of the terrestrial carbon cycle to the expression of El Nino. Biogeosciences, 18, 2181-2203, doi:10.5194/bg-18-2181-2021.
- Thandlam, V., A. Rutgersson, and E. Sahlee, 2022: Spatio-temporal variability of atmospheric rivers and associated atmospheric parameters in the Euro-Atlantic region. Theoretical and Applied Climatology, 147, 13-33, doi:10.1007/s00704-021-03776-w.
- Thompson, D. M., 2022: Environmental records from coral skeletons: A decade of novel insights and innovation. Wiley Interdisciplinary Reviews-Climate Change, 13, doi:10.1002/wcc.745.
- Tichavsky, R., A. Fabianova, and R. Tolasz, 2021: Intra-annual dendrogeomorphic dating and climate linkages of flood events in headwaters of central Europe. Science of the Total Environment, 763, doi:10.1016/j.scitotenv.2020.142953.
- Titus, M. L., K. R. Thompson, E. C. J. Oliver, and P. J. Klotzbach, 2021: Statistical Reconstruction of Seasonal Tropical Cyclone Variability in the North Atlantic Basin. Journal of Geophysical Research-Atmospheres, 126, doi:10.1029/2020jd032669.
- Vaccaro, A., J. Emile-Geay, D. Guillot, R. Verna, C. Morice, J. Kennedy, and B. Rajaratnam, 2021: Climate Field Completion via Markov Random Fields: Application to the HadCRUT4.6 Temperature Dataset. J. Clim., 34, 4169-4188, doi:10.1175/jcli-d-19-0814.1.
- Vanderkelen, I., and Coauthors, 2021: Simulating the Impact of Global Reservoir Expansion on the Present-Day Climate. Journal of Geophysical Research-Atmospheres, 126, doi:10.1029/2020jd034485.
- Vanmaercke, M., and Coauthors, 2021: Measuring, modelling and managing gully erosion at large scales: A state of the art. Earth-Science Reviews, 218, doi:10.1016/j.earscirev.2021.103637.
- Villamayor, J., M. Khodri, R. Villalba, and V. Daux, 2021: Causes of the long-term variability of southwestern South America precipitation in the IPSL-CM6A-LR model. Climate Dynamics, 57, 2391-2414, doi:10.1007/s00382-021-05811-y.
- Wang, X., R. Y. Lu, and X. W. Hong, 2021: Reduction of mid-summer rainfall in northern India after the late-1990s induced by the decadal change of the Silk Road pattern. Environmental Research Letters, 16, doi:10.1088/1748-9326/ac2cea.
- Wang, X. Y., and Coauthors, 2021: Underestimated responses of Walker circulation to ENSO-related SST anomaly in atmospheric and coupled models. Geoscience Letters, 8, doi:10.1186/s40562-021-00186-8.
- Wang, Y. C., and Coauthors, 2021: Performance of the Taiwan Earth System Model in Simulating Climate Variability Compared With Observations and CMIP6 Model Simulations. Journal of Advances in Modeling Earth Systems, 13, doi:10.1029/2020ms002353.
- Wang, Z. Y., T. Li, and Y. Sun, 2021: Interdecadal variability of intensity of the Madden-Julian oscillation. Atmospheric Science Letters, 22, doi:10.1002/asl.1027.
- Wei, W. U., Z. W. Yan, and Z. Li, 2021: Influence of Pacific Decadal Oscillation on global precipitation extremes. Environmental Research Letters, 16, doi:10.1088/1748-9326/abed7c.
- Williamson, F., 2021: Building a long-time series for weather and extreme weather in the Straits Settlements: a multi-disciplinary approach to the archives of societies. Climate of the Past, 17, 791-803, doi:10.5194/cp-17-791-2021.
- Wu, M. N., T. J. Zhou, and X. L. Chen, 2021: The Source of Uncertainty in Projecting the Anomalous Western North Pacific Anticyclone during El Nino-Decaying Summers. J. Clim., 34, 6603-6617, doi:10.1175/jcli-d-20-0904.1.
- Wu, M. N., and Coauthors, 2021: A very likely weakening of Pacific Walker Circulation in constrained near-future projections. Nature Communications, 12, doi:10.1038/s41467-021-26693-y.
- Wu, X. B., X. H. Yan, Y. Li, H. Mei, Y. A. Liou, and G. Li, 2021: Climatic Variation of Maximum Intensification Rate for Major Tropical Cyclones over the Western North Pacific. Atmosphere, 12, doi:10.3390/atmos12040494.
- Xie, T. J., J. P. Li, K. Q. Chen, Y. Z. Zhang, and C. Sun, 2021: Origin of Indian Ocean multidecadal climate variability: role of the North Atlantic Oscillation. Climate Dynamics, 56, 3277-3294, doi:10.1007/s00382-021-05643-w.
- Yang, X. S., and Coauthors, 2021: On the Development of GFDL's Decadal Prediction System: Initialization Approaches and Retrospective Forecast Assessment. Journal of Advances in Modeling Earth Systems, 13, doi:10.1029/2021ms002529.
- Yeasmin, A., S. Chand, C. Turville, and N. Sultanova, 2021: Detection and verification of tropical cyclones and depressions over the South Pacific Ocean basin using ERA-5 reanalysis dataset. International Journal of Climatology, 41, 5318-5330, doi:10.1002/joc.7131.
- Zahan, Y., P. V. Rajesh, B. A. Choudhury, and B. N. Goswami, 2021: Why Indian summer monsoon circulation indices? Fidelity in representing rainfall variability and teleconnections. Quarterly Journal of the Royal Meteorological Society, 147, 1300-1316, doi:10.1002/qj.3972.
- Zerbini, S., S. Bruni, and F. Raicich, 2021: Tide gauge data archaeology provides natural subsidence rates along the coasts of the Po Plain and of the Veneto-Friuli Plain, Italy. Geophysical Journal International, 225, 253-260, doi:10.1093/gji/ggaa602.
- Zhang, C. A. L., X. J. Sun, W. Lu, Y. N. Shi, N. Y. Dou, and S. H. Li, 2021: Relationship between wind observation accuracy and the ascending node of the sun-synchronous orbit for the Aeolus-type spaceborne Doppler wind lidar. Atmos Meas Tech, 14, 4787-4803, doi:10.5194/amt-14-4787-2021.
- Zhang, H. B., W. W. Immerzeel, F. Zhang, R. J. de Kok, S. J. Gorrie, and M. Ye, 2021: Creating 1-km long-term (1980-2014) daily average air temperatures over the Tibetan Plateau by integrating eight types of reanalysis and land data assimilation products downscaled with MODIS-estimated temperature lapse rates based on machine learning. International Journal of Applied Earth Observation and Geoinformation, 97, doi:10.1016/j.jag.2021.102295.
- Zhang, H. H., R. Seager, J. He, H. S. Diao, and S. Pascale, 2021: Quantifying atmosphere and ocean origins of North American precipitation variability. Climate Dynamics, 56, 4051-4074, doi:10.1007/s00382-021-05685-0.
- Zhang, L., B. L. Gan, X. C. Li, H. Wang, C. Y. Wang, W. J. Cai, and L. X. Wu, 2021: Remote Influence of the Midlatitude South Atlantic Variability in Spring on Antarctic Summer Sea Ice. Geophysical Research Letters, 48, doi:10.1029/2020gl090810.
- Zhang, L. Y., and Coauthors, 2021: Pacific Warming Pattern Diversity Modulated by Indo-Pacific Sea Surface Temperature Gradient. Geophysical Research Letters, 48, doi:10.1029/2021gl095516.
- Zhang, S. Q., G. Y. Ren, Y. Y. Ren, Y. X. Zhang, and X. Y. Xue, 2021: Comprehensive evaluation of surface air temperature reanalysis over China against urbanization-bias-adjusted observations. Advances in Climate Change Research, 12, 783-794, doi:10.1016/j.accre.2021.09.010.
- Zhang, W., B. Kirtman, L. Siqueira, A. Clement, and J. F. Xia, 2021: Understanding the signal-to-noise paradox in decadal climate predictability from CMIP5 and an eddying global coupled model. Climate Dynamics, 56, 2895-2913, doi:10.1007/s00382-020-05621-8.
- Zheng, X. G., and C. S. Frederiksen, 2021: Variability of Multisite Decadal Running Means Arising from Year-To-Year Fluctuations. J. Clim., 34, 1337-1350, doi:10.1175/jcli-d-20-0414.1.
- Zhou, B. T., Z. Y. Wang, B. Sun, and X. Hao, 2021: Decadal Change of Heavy Snowfall over Northern China in the Mid-1990s and Associated Background Circulations. J. Clim., 34, 825-837, doi:10.1175/jcli-d-19-0815.1.
- Alexandrov, G. A., V. A. Ginzburg, G. E. Insarov, and A. A. Romanovskaya, 2021: CMIP6 model projections leave no room for permafrost to persist in Western Siberia under the SSP5-8.5 scenario. Climatic Change, 169, doi:10.1007/s10584-021-03292-w.
- Baatz, R., and Coauthors, 2021: Reanalysis in Earth System Science: Toward Terrestrial Ecosystem Reanalysis. Reviews of Geophysics, 59, doi:10.1029/2020rg000715.
- Bourdeau-Goulet, S. C., and E. Hassanzadeh, 2021: Comparisons Between CMIP5 and CMIP6 Models: Simulations of Climate Indices Influencing Food Security, Infrastructure Resilience, and Human Health in Canada. Earths Future, 9, doi:10.1029/2021ef001995.
- Burt, S. D.: A twice-daily barometric pressure record from Durham Observatory in north-east England, 1843-1960. Geoscience Data Journal, doi:10.1002/gdj3.135.
- Ceron, W. L., M. T. Kayano, R. V. Andreoli, A. Avila-Diaz, I. P. de Souza, and R. A. F. Souza, 2021: Pacific and Atlantic Multidecadal Variability Relations with the Choco and Caribbean Low-Level Jets during the 1900-2015 Period. Atmosphere, 12, doi:10.3390/atmos12091120.
- Gergis, J., Z. Baillie, S. Ingallina, L. Ashcroft, and T. Ellwood, 2021: A historical climate dataset for southwestern Australia, 1830-1875. International Journal of Climatology, 41, 4898-4919, doi:10.1002/joc.7105.
- Han, J., and V. P. Singh, 2021: Impacts of Rossby Wave Packets and Atmospheric Rivers on Meteorological Drought in the Continental United States. Water Resources Research, 57, doi:10.1029/2021wr029966.
- Horton, P., 2022: Analogue methods and ERA5: Benefits and pitfalls. International Journal of Climatology, 42, 4078-4096, doi:10.1002/joc.7484.
- Hyncica, M., and R. Huth, 2022: Temporal evolution of relationships between temperature and circulation modes in five reanalyses. International Journal of Climatology, 42, 4391-4404, doi:10.1002/joc.7474.
- Karmalkar, A. V., and R. M. Horton, 2021: Drivers of exceptional coastal warming in the northeastern United States. Nature Climate Change, 11, 854-+, doi:10.1038/s41558-021-01159-7.
- Qiao, P. J., Z. Q. Gong, W. Q. Liu, Y. W. Zhang, G. L. Feng, and W. J. Dong, 2021: Extreme rainfall synchronization network between Southwest China and Asia-Pacific region. Climate Dynamics, 57, 3207-3221, doi:10.1007/s00382-021-05865-y.
- Allchin, M. I., and S. J. Dery, 2020: The Climatological Context of Trends in the Onset of Northern Hemisphere Seasonal Snow Cover, 1972-2017. Journal of Geophysical Research-Atmospheres, 125, doi:10.1029/2019jd032367.
- Ardilouze, C., S. Materia, L. Batte, M. Benassi, and C. Prodhomme: Precipitation response to extreme soil moisture conditions over the Mediterranean. Climate Dynamics, doi:10.1007/s00382-020-05519-5.
- Armal, S., N. Devineni, N. Y. Krakauer, and R. Khanbilvardi, 2020: Simulating precipitation in the Northeast United States using aclimate-informedK-nearestneighbour algorithm. Hydrological Processes, 34, 3966-3980, doi:10.1002/hyp.13853.
- Ballinger, T. J., and Coauthors, 2021: The role of blocking circulation and emerging open water feedbacks on Greenland cold-season air temperature variability over the last century. International Journal of Climatology, 41, E2778-E2800, doi:10.1002/joc.6879.
- Baudouin, J. P., M. Herzog, and C. A. Petrie, 2020: Cross-validating precipitation datasets in the Indus River basin. Hydrology and Earth System Sciences, 24, 427-450, doi:10.5194/hess-24-427-2020.
- Blanchet, J., and J. D. Creutin, 2020: Explaining Rainfall Accumulations over Several Days in the French Alps Using Low-Dimensional Atmospheric Predictors Based on Analogy. Journal of Applied Meteorology and Climatology, 59, 237-250, doi:10.1175/jamc-d-19-0112.1.
- Boe, J., and Coauthors, 2020: Past long-term summer warming over western Europe in new generation climate models: role of large-scale atmospheric circulation. Environmental Research Letters, 15, doi:10.1088/1748-9326/ab8a89.
- Bohm, C., M. Reyers, J. H. Schween, and S. Crewell, 2020: Water vapor variability in the Atacama Desert during the 20th century. Global and Planetary Change, 190, doi:10.1016/j.gloplacha.2020.103192.
- Bonnet, R., J. Boe, and F. Habets, 2020: Influence of multidecadal variability on high and low flows: the case of the Seine basin. Hydrology and Earth System Sciences, 24, 1611-1631, doi:10.5194/hess-24-1611-2020.
- Boustead, B. M., M. D. Shulski, and S. D. Hilberg, 2020: The Long Winter of 1880/81. Bulletin of the American Meteorological Society, 101, E797-E813, doi:10.1175/bams-d-19-0014.1.
- Brady, R. X., N. S. Lovenduski, S. G. Yeager, M. C. Long, and K. Lindsay, 2020: Skillful multiyear predictions of ocean acidification in the California Current System. Nature Communications, 11, doi:10.1038/s41467-020-15722-x.
- Brennan, M. K., G. J. Hakim, and E. Blanchard-Wrigglesworth, 2020: Arctic Sea-Ice Variability During the Instrumental Era. Geophysical Research Letters, 47, doi:10.1029/2019gl086843.
- Brierley, C. M., and Coauthors, 2020: Large-scale features and evaluation of the PMIP4-CMIP6 midHolocene simulations. Climate of the Past, 16, 1847-1872, doi:10.5194/cp-16-1847-2020.
- Bronnimann, S., 2020: Synthetic weather diaries: concept and application to Swiss weather in 1816. Climate of the Past, 16, 1937-1952, doi:10.5194/cp-16-1937-2020.
- Brown, J. R., and Coauthors, 2020: Comparison of past and future simulations of ENSO in CMIP5/PMIP3 and CMIP6/PMIP4 models. Climate of the Past, 16, 1777-1805, doi:10.5194/cp-16-1777-2020.
- Brown, J. R., and Coauthors, 2020: South Pacific Convergence Zone dynamics, variability and impacts in a changing climate. Nature Reviews Earth & Environment, 1, 530-543, doi:10.1038/s43017-020-0078-2.
- Caceres, D., B. Marzeion, J. H. Malles, B. D. Gutknecht, H. M. Schmied, and P. Doll, 2020: Assessing global water mass transfers from continents to oceans over the period 1948-2016. Hydrology and Earth System Sciences, 24, 4831-4851, doi:10.5194/hess-24-4831-2020.
- Cannon, A. J., 2020: Reductions in daily continental-scale atmospheric circulation biases between generations of global climate models: CMIP5 to CMIP6. Environmental Research Letters, 15, doi:10.1088/1748-9326/ab7e4f.
- Capozzi, V., Y. Cotroneo, P. Castagno, C. De Vivo, and G. Budillon, 2020: Rescue and quality control of sub-daily meteorological data collected at Montevergine Observatory (Southern Apennines), 1884-1963. Earth System Science Data, 12, 1467-1487, doi:10.5194/essd-12-1467-2020.
- Ceglar, A., M. Zampieri, N. Gonzalez-Reviriego, P. Ciais, B. Schauberger, and M. Van der Velde, 2020: Time-varying impact of climate on maize and wheat yields in France since 1900. Environmental Research Letters, 15, doi:10.1088/1748-9326/aba1be.
- Champagne, O., M. Leduc, P. Coulibaly, and M. A. Arain, 2020: Winter hydrometeorological extreme events modulated by large-scale atmospheric circulation in southern Ontario. Earth System Dynamics, 11, 301-318, doi:10.5194/esd-11-301-2020. Chand, S. S., A. Dowdy, S. Bell, and K. Tory, 2020: A Review of South Pacific Tropical Cyclones: Impacts of Natural Climate Variability and Climate Change. Climate Change and Impacts in the Pacific, L. Kumar, Ed., 251-273.
- Chen, D., Y. Gao, J. Q. Sun, H. J. Wang, and J. H. Ma, 2020: Interdecadal Variation and Causes of Drought in Northeast China in Recent Decades. Journal of Geophysical Research-Atmospheres, 125, doi:10.1029/2019jd032069.
- Chen, D., J. Q. Sun, and Y. Gao, 2020: Distinct impact of the Pacific multi-decadal oscillation on precipitation in Northeast China during April in different Pacific multi-decadal oscillation phases. International Journal of Climatology, 40, 1630-1643, doi:10.1002/joc.6291.
- Chen, D., J. Q. Sun, and Y. Gao, 2020: Effects of AO on the interdecadal oscillating relationship between the ENSO and East Asian winter monsoon. International Journal of Climatology, 40, 4374-4383, doi:10.1002/joc.6459.
- Chen, R. Y., I. R. Simpson, C. Deser, and B. Wang, 2020: Model Biases in the Simulation of the Springtime North Pacific ENSO Teleconnection. J. Clim., 33, 9985-10002, doi:10.1175/jcli-d-19-1004.1.
- Chen, S. F., W. Chen, R. G. Wu, and L. Y. Song, 2020: Impacts of the Atlantic Multidecadal Oscillation on the Relationship of the Spring Arctic Oscillation and the Following East Asian Summer Monsoon. J. Clim., 33, 6651-6672, doi:10.1175/jcli-d-19-0978.1.
- Choi, H. Y., H. J. Lee, S. Y. Kim, and W. Park, 2020: Deepening of Future Aleutian Low in Ensemble Global Warming Simulations with the Kiel Climate Model. Ocean Science Journal, 55, 219-230, doi:10.1007/s12601-020-0017-7.
- Cook, E. R., and Coauthors, 2020: The European Russia Drought Atlas (1400-2016 CE). Climate Dynamics, 54, 2317-2335, doi:10.1007/s00382-019-05115-2.
- Cowan, T., and Coauthors, 2020: Ocean and land forcing of the record-breaking Dust Bowl heatwaves across central United States. Nature Communications, 11, doi:10.1038/s41467-020-16676-w.
- Cowan, T., S. Undorf, G. C. Hegerl, L. J. Harrington, and F. E. L. Otto, 2020: Present-day greenhouse gases could cause more frequent and longer Dust Bowl heatwaves. Nature Climate Change, 10, 505-+, doi:10.1038/s41558-020-0771-7.
- Craig, P. M., and E. Hawkins, 2020: Digitizing observations from the Met Office Daily Weather Reports for 1900-1910 using citizen scientist volunteers. Geoscience Data Journal, 7, 116-134, doi:10.1002/gdj3.93.
- Dai, N., and P. A. Arkin, 2021: Diagnosis of ENSO-related precipitation changes during the twentieth and twenty-first centuries using reanalyses and two multi-model clusters. Climate Dynamics, 56, 727-748, doi:10.1007/s00382-020-05495-w.
- Darshana, P., J. S. Chowdary, C. Gnanaseelan, A. Parekh, and G. Srinivas, 2020: Interdecadal modulation of the Indo-western Pacific Ocean Capacitor mode and its influence on Indian summer monsoon rainfall. Climate Dynamics, 54, 1761-1777, doi:10.1007/s00382-019-05085-5.
- Dasgupta, P., A. Metya, C. V. Naidu, M. Singh, and M. K. Roxy, 2020: Exploring the long-term changes in the Madden Julian Oscillation using machine learning. Scientific Reports, 10, doi:10.1038/s41598-020-75508-5.
- Delunel, R., and Coauthors, 2020: Late-Pleistocene catchment-wide denudation patterns across the European Alps. Earth-Science Reviews, 211, doi:10.1016/j.earscirev.2020.103407.
- Ding, Z. M., and R. G. Wu, 2020: Quantifying the internal variability in multi-decadal trends of spring surface air temperature over mid-to-high latitudes of Eurasia. Climate Dynamics, 55, 2013-2030, doi:10.1007/s00382-020-05365-5.
- Diodato, N., N. Filizola, P. Borrelli, P. Panagos, and G. Bellocchi, 2020: The Rise of Climate-Driven Sediment Discharge in the Amazonian River Basin. Atmosphere, 11, doi:10.3390/atmos11020208.
- Diouf, I., and Coauthors, 2020: Climate Variability and Malaria over West Africa. American Journal of Tropical Medicine and Hygiene, 102, 1037-1047, doi:10.4269/ajtmh.19-0062.
- Djebbar, A., H. Goosse, and F. Klein, 2020: Robustness of the Link between Precipitation in North Africa and Standard Modes of Atmospheric Variability during the Last Millennium. Climate, 8, doi:10.3390/cli8050062. Donat, M. G., J. Sillmann, and E. M. Fischer, 2020: Changes in climate extremes in observations and climate model simulations. From the past to the future. 31-57 pp.
- Dunne, J. P., and Coauthors, 2020: The GFDL Earth System Model Version 4.1 (GFDL-ESM 4.1): Overall Coupled Model Description and Simulation Characteristics. Journal of Advances in Modeling Earth Systems, 12, doi:10.1029/2019ms002015.
- Ehmele, F., L. A. Kautz, H. Feldmann, and J. G. Pinto, 2020: Long-term variance of heavy precipitation across central Europe using a large ensemble of regional climate model simulations. Earth System Dynamics, 11, 469-490, doi:10.5194/esd-11-469-2020.
- Fasullo, J. T., A. S. Phillips, and C. Deser, 2020: Evaluation of Leading Modes of Climate Variability in the CMIP Archives. J. Clim., 33, 5527-5545, doi:10.1175/jcli-d-19-1024.1.
- Figliuolo, G. C., R. V. Andreoli, M. T. Kayano, J. A. C. da Costa, W. H. T. Rego, and D. S. de Moraes, 2020: The role of the Atlantic Multidecadal Oscillation precondition in the teleconnection of different El Nino-Southern Oscillation types and impacts on the 15 degrees N-15 degrees S South American sector precipitation. International Journal of Climatology, 40, 1943-1964, doi:10.1002/joc.6309.
- Fogt, R. L., C. P. Belak, J. M. Jones, L. C. Slivinski, and G. P. Compo, 2021: An assessment of early 20th century Antarctic pressure reconstructions using historical observations. International Journal of Climatology, 41, E672-E689, doi:10.1002/joc.6718.
- Forster, K., and L. B. Thiele, 2020: Variations in sub-daily precipitation at centennial scale. Npj Climate and Atmospheric Science, 3, doi:10.1038/s41612-020-0117-1.
- Fu, Z., P. C. Hsu, and F. Liu, 2020: Factors Regulating the Multidecadal Changes in MJO Amplitude over the Twentieth Century. J. Clim., 33, 9513-9529, doi:10.1175/jcli-d-20-0111.1.
- Fujiwara, M., P. Martineau, and J. S. Wright, 2020: Surface temperature response to the major volcanic eruptions in multiple reanalysis data sets. Atmospheric Chemistry and Physics, 20, 345-374, doi:10.5194/acp-20-345-2020.
- Fulop, R. H., and Coauthors, 2020: Million-year lag times in a post-orogenic sediment conveyor. Science Advances, 6, doi:10.1126/sciadv.aaz8845.
- Gavrilov, A., S. Kravtsov, and D. Mukhin, 2020: Analysis of 20th century surface air temperature using linear dynamical modes. Chaos, 30, doi:10.1063/5.0028246.
- Geng, T., W. J. Cai, and L. X. Wu, 2020: Two Types of ENSO Varying in Tandem Facilitated by Nonlinear Atmospheric Convection. Geophysical Research Letters, 47, doi:10.1029/2020gl088784.
- Gergis, J., L. Ashcroft, and P. Whetton, 2020: A historical perspective on Australian temperature extremes. Climate Dynamics, 55, 843-868, doi:10.1007/s00382-020-05298-z.
- Ghil, M., and V. Lucarini, 2020: The physics of climate variability and climate change. Reviews of Modern Physics, 92, doi:10.1103/RevModPhys.92.035002.
- Gibson, A. J., D. C. Verdon-Kidd, G. R. Hancock, and G. Willgoose, 2020: Catchment-scale drought: capturing the whole drought cycle using multiple indicators. Hydrology and Earth System Sciences, 24, 1985-2002, doi:10.5194/hess-24-1985-2020.
- Gibson, P. B., D. E. Waliser, B. Guan, M. J. DeFlorio, F. M. Ralph, and D. L. Swain, 2020: Ridging Associated with Drought across the Western and Southwestern United States: Characteristics, Trends, and Predictability Sources. J. Clim., 33, 2485-2508, doi:10.1175/jcli-d-19-0439.1.
- Gillespie, I. M., L. Haimberger, G. P. Compo, and P. W. Thorne, 2021: Assessing potential of sparse-input reanalyses for centennial-scale land surface air temperature homogenisation. International Journal of Climatology, 41, E3000-E3020, doi:10.1002/joc.6898.
- Gong, Y. H., T. Li, and L. Chen, 2020: Interdecadal modulation of ENSO amplitude by the Atlantic multi-decadal oscillation (AMO). Climate Dynamics, 55, 2689-2702, doi:10.1007/s00382-020-05408-x.
- Gos, M., P. Baranowski, J. Krzyszczak, A. Kieliszek, and K. Siwek, 2021: Dynamics of meteorological time series on the base of ground measurements and retrospective data fromMERRA-2 for Poland. International Journal of Climatology, 41, E1531-E1552, doi:10.1002/joc.6787.
- Haakenstad, H., O. Breivik, M. Reistad, and O. J. Aarnes, 2020: NORA10EI: A revised regional atmosphere-wave hindcast for the North Sea, the Norwegian Sea and the Barents Sea. International Journal of Climatology, 40, 4347-4373, doi:10.1002/joc.6458.
- Han, Z. X., and Coauthors, 2020: The changes in ENSO-induced tropical Pacific precipitation variability in the past warm and cold climates from the EC-Earth simulations. Climate Dynamics, 55, 503-519, doi:10.1007/s00382-020-05280-9.
- Hawley, W. B., C. C. Hay, J. X. Mitrovica, and R. E. Kopp, 2020: A Spatially Variable Time Series of Sea Level Change Due to Artificial Water Impoundment. Earths Future, 8, doi:10.1029/2020ef001497.
- Hernandez, A., and Coauthors, 2020: Modes of climate variability: Synthesis and review of proxy-based reconstructions through the Holocene. Earth-Science Reviews, 209, doi:10.1016/j.earscirev.2020.103286.
- Hernandez, A., and Coauthors, 2020: A 2,000-year Bayesian NAO reconstruction from the Iberian Peninsula. Scientific Reports, 10, doi:10.1038/s41598-020-71372-5.
- Hersbach, H., and Coauthors, 2020: The ERA5 global reanalysis. Quarterly Journal of the Royal Meteorological Society, 146, 1999-2049, doi:10.1002/qj.3803.
- Hogan, R. J., and M. Matricardi, 2020: Evaluating and improving the treatment of gases in radiation schemes: the Correlated K-Distribution Model Intercomparison Project (CKDMIP). Geoscientific Model Development, 13, 6501-6521, doi:10.5194/gmd-13-6501-2020.
- Hong, H. X., J. Q. Sun, and H. J. Wang, 2020: Interdecadal variation in the frequency of extreme hot events in Northeast China and the possible mechanism. Atmospheric Research, 244, doi:10.1016/j.atmosres.2020.105065.
- Hong, X., A. Kareem, and J. Li, 2020: Validation of the fast intensity model for typhoon and its application to the estimation of typhoon wind hazard for the southeast coast of China. Journal of Wind Engineering and Industrial Aerodynamics, 206, doi:10.1016/j.jweia.2020.104379.
- Hounsou-Gbo, A., J. Servain, F. D. Vasconcelos, E. Martins, and M. Araujo, 2020: Summer and winter Atlantic Nino: connections with ENSO and implications. Climate Dynamics, 55, 2939-2956, doi:10.1007/s00382-020-05424-x.
- Hu, S. J., J. Sprintall, C. Guan, M. J. McPhaden, F. Wang, D. X. Hu, and W. J. Cai, 2020: Deep-reaching acceleration of global mean ocean circulation over the past two decades. Science Advances, 6, doi:10.1126/sciadv.aax7727.
- Huang, Y. Y., and H. J. Wang, 2020: A Possible Approach for Decadal Prediction of the PDO. Journal of Meteorological Research, 34, 63-72, doi:10.1007/s13351-020-9144-4.
- Huang, Y. Y., and H. J. Wang, 2020: Is the Regional Precipitation Predictable in Decadal Scale? A Possible Approach for the Decadal Prediction of the Summer Precipitation Over North China. Earth and Space Science, 7, doi:10.1029/2019ea000986.
- Hyncica, M., and R. Huth, 2020: Modes of Atmospheric Circulation Variability in the Northern Extratropics: A Comparison of Five Reanalyses. J. Clim., 33, 10707-10726, doi:10.1175/jcli-d-19-0904.1.
- Jebri, B., M. Khodri, V. Echevin, G. Gastineau, S. Thiria, J. Vialard, and N. Lebas, 2020: Contributions of Internal Variability and External Forcing to the Recent Trends in the Southeastern Pacific and Peru-Chile Upwelling System. J. Clim., 33, 10555-10578, doi:10.1175/jcli-d-19-0304.1.
- Jing, Y. J., Y. C. Li, and Y. F. Xu, 2020: Assessment of responses of North Atlantic winter sea surface temperature to the North Atlantic Oscillation on an interannual scale in 13 CMIP5 models. Ocean Science, 16, 1509-1527, doi:10.5194/os-16-1509-2020.
- Johnson, N. C., D. J. Amaya, Q. H. Ding, Y. Kosaka, H. Tokinaga, and S. P. Xie, 2020: Multidecadal modulations of key metrics of global climate change. Global and Planetary Change, 188, doi:10.1016/j.gloplacha.2020.103149.
- Jong, B. T., M. F. Ting, R. Seager, and W. B. Anderson, 2020: ENSO Teleconnections and Impacts on US Summertime Temperature during a Multiyear La Nina Life Cycle. J. Clim., 33, 6009-6024, doi:10.1175/jcli-d-19-0701.1.
- Kadow, C., D. M. Hall, and U. Ulbrich, 2020: Artificial intelligence reconstructs missing climate information. Nature Geoscience, 13, 408-+, doi:10.1038/s41561-020-0582-5.
- Karmakar, N., A. Chakraborty, and R. S. Nanjundiah, 2020: Influence of global sea-surface temperature on ultra-low-frequency variability in Indian summer monsoon rainfall. Quarterly Journal of the Royal Meteorological Society, 146, 904-921, doi:10.1002/qj.3715.
- Kim, D. I., H. H. Kwon, D. W. Han, and Y. T. Kim, 2020: Exploration of Daily Rainfall Intensity Change in South Korea 1900-2010 Using Bias-Corrected ERA-20C. J Hydrol Eng, 25, doi:10.1061/(asce)he.1943-5584.0001928.
- Kirdyanov, A. V., and Coauthors, 2020: Ecological and conceptual consequences of Arctic pollution. Ecology Letters, 23, 1827-1837, doi:10.1111/ele.13611.
- Krieger, D., O. Krueger, F. Feser, R. Weisse, B. Tinz, and H. von Storch, 2021: German Bight storm activity, 1897-2018. International Journal of Climatology, 41, E2159-E2177, doi:10.1002/joc.6837.
- Kudo, Y., 2020: Maintaining law and order: Welfare implications from village vigilante groups in northern Tanzania. Journal of Economic Behavior & Organization, 178, 607-628, doi:10.1016/j.jebo.2020.08.007.
- Kwon, Y. O., H. Seo, C. C. Ummenhofer, and T. M. Joyce, 2020: Impact of Multidecadal Variability in Atlantic SST on Winter Atmospheric Blocking. J. Clim., 33, 867-892, doi:10.1175/jcli-d-19-0324.1.
- Larson, S. M., and K. Pegion, 2020: Do asymmetries in ENSO predictability arise from different recharged states? Climate Dynamics, 54, 1507-1522, doi:10.1007/s00382-019-05069-5.
- Le, T., K. J. Ha, D. H. Bae, and S. H. Kim, 2020: Causal effects of Indian Ocean Dipole on El Nino-Southern Oscillation during 1950-2014 based on high-resolution models and reanalysis data. Environmental Research Letters, 15, doi:10.1088/1748-9326/abb96d.
- Lhotka, O., and S. Bronnimann, 2020: Possible Increase of Vegetation Exposure to Spring Frost under Climate Change in Switzerland. Atmosphere, 11, doi:10.3390/atmos11040391.
- Li, L. F., M. S. Lozier, and M. W. Buckley, 2020: An Investigation of the Ocean's Role in Atlantic Multidecadal Variability. J. Clim., 33, 3019-3035, doi:10.1175/jcli-d-19-0236.1.
- Li, X., F. Liu, and M. Fang, 2020: Harmonizing models and observations: Data assimilation in Earth system science. Science China-Earth Sciences, 63, 1059-1068, doi:10.1007/s11430-019-9620-x.
- Liu, Y. S., Z. Q. Gong, C. Sun, J. P. Li, and L. Wang, 2020: Multidecadal Seesaw in Hadley Circulation Strength Between the Two Hemispheres Caused by the Atlantic Multidecadal Variability. Frontiers in Earth Science, 8, doi:10.3389/feart.2020.580457.
- Loope, G., D. Thompson, and J. Overpeck, 2020: The spectrum of Asian Monsoon variability: A proxy system model approach to the hydroclimate scaling mismatch. Quaternary Science Reviews, 240, doi:10.1016/j.quascirev.2020.106362.
- Lucio-Eceiza, E. E., J. F. Gonzalez-Rouco, E. Garcia-Bustamante, J. Navarro, C. Rojas-Labanda, and H. Beltrami, 2020: Summertime Surface Wind Variability over Northeastern North America at Multidecadal to Centennial Time Scales via Statistical Downscaling. J. Clim., 33, 1969-1990, doi:10.1175/jcli-d-19-0331.1.
- Luo, H., F. Zheng, N. Keenlyside, and J. Zhu, 2020: Ocean-atmosphere coupled Pacific Decadal variability simulated by a climate model. Climate Dynamics, 54, 4759-4773, doi:10.1007/s00382-020-05248-9.
- Martineau, P., H. Nakamura, Y. Kosaka, B. Taguchi, and M. Mori, 2020: Modulations of North American and European Weather Variability and Extremes by Interdecadal Variability of the Atmospheric Circulation over the North Atlantic Sector. J. Clim., 33, 8125-8146, doi:10.1175/jcli-d-19-0977.1.
- Massmann, C., 2020: Evaluating the Suitability of Century-Long Gridded Meteorological Datasets for Hydrological Modeling. Journal of Hydrometeorology, 21, 2565-2580, doi:10.1175/jhm-d-19-0113.1.
- McCabe, G. J., and D. M. Wolock, 2020: Hydro-Climatic Drought in the Delaware River Basin. Journal of the American Water Resources Association, 56, 981-994, doi:10.1111/1752-1688.12875.
- McCabe, G. J., and D. M. Wolock, 2021: Multi-year hydroclimatic droughts and pluvials across the conterminous United States. International Journal of Climatology, 41, 1731-1746, doi:10.1002/joc.6925.
- McDonald, A. J., and L. H. Cairns, 2020: A New Method to Evaluate Reanalyses Using Synoptic Patterns: An Example Application in the Ross Sea/Ross Ice Shelf Region. Earth and Space Science, 7, doi:10.1029/2019ea000794.
- Mekhaldi, F., and Coauthors, 2020: Radionuclide wiggle matching reveals a nonsynchronous early Holocene climate oscillation in Greenland and western Europe around a grand solar minimum. Climate of the Past, 16, 1145-1157, doi:10.5194/cp-16-1145-2020.
- Melnikova, I., and T. Sasai, 2020: Effects of Anthropogenic Activity on Global Terrestrial Gross Primary Production. Journal of Geophysical Research-Biogeosciences, 125, doi:10.1029/2019jg005403.
- Merrifield, A. L., L. Brunner, R. Lorenz, I. Medhaug, and R. Knutti, 2020: An investigation of weighting schemes suitable for incorporating large ensembles into multi-model ensembles. Earth System Dynamics, 11, 807-834, doi:10.5194/esd-11-807-2020.
- Meucci, A., I. R. Young, O. J. Aarnes, and O. Breivik, 2020: Comparison of Wind Speed and Wave Height Trends from Twentieth-Century Models and Satellite Altimeters. J. Clim., 33, 611-624, doi:10.1175/jcli-d-19-0540.1.
- Mezzina, B., J. Garcia-Serrano, I. Blade, and F. Kucharski, 2020: Dynamics of the ENSO Teleconnection and NAO Variability in the North Atlantic-European Late Winter. J. Clim., 33, 907-923, doi:10.1175/jcli-d-19-0192.1.
- Miao, J. P., T. Wang, and H. J. Wang, 2020: Interdecadal Variations of the East Asian Winter Monsoon in CMIP5 Preindustrial Simulations. J. Clim., 33, doi:10.1175/jcli-d-19-0148.1.
- Min, S. K., 2020: Human fingerprint in global weather. Nature Climate Change, 10, 15-16, doi:10.1038/s41558-019-0670-y.
- Mokhov, II, A. V. Chernokulsky, and A. M. Osipov, 2020: Atmospheric Centers of Action in the Northern and Southern Hemispheres: Features and Variability. Russ Meteorol Hydro+, 45, 749-761, doi:10.3103/s1068373920110011.
- Molteni, F., and Coauthors, 2020: Boreal-winter teleconnections with tropical Indo-Pacific rainfall in HighResMIP historical simulations from the PRIMAVERA project. Climate Dynamics, 55, 1843-1873, doi:10.1007/s00382-020-05358-4.
- Muller, W. A., L. Borchert, and R. Ghosh, 2020: Observed Subdecadal Variations of European Summer Temperatures. Geophysical Research Letters, 47, doi:10.1029/2019gl086043.
- Munoz, S. E., and Coauthors, 2020: Lipid Biomarker Record Documents Hydroclimatic Variability of the Mississippi River Basin During the Common Era. Geophysical Research Letters, 47, doi:10.1029/2020gl087237.
- Najibi, N., A. Mazor, N. Devineni, C. Mossel, and J. F. Booth, 2020: Understanding the Spatial Organization of Simultaneous Heavy Precipitation Events Over the Conterminous United States. Journal of Geophysical Research-Atmospheres, 125, doi:10.1029/2020jd033036.
- Nayak, M. A., M. K. Cowles, G. Villarini, and B. Ul Wafa, 2020: Bayesian Hierarchical Models for the Frequency of Winter Heavy Precipitation Events Over the Central United States: The Role of Atmospheric Rivers. Water Resources Research, 56, doi:10.1029/2020wr028256.
- Nicholson, S. E., and D. Klotter, 2021: The Tropical Easterly Jet over Africa, its representation in six reanalysis products, and its association with Sahel rainfall. International Journal of Climatology, 41, 328-347, doi:10.1002/joc.6623.
- Nitta, T., T. Arakawa, M. Hatono, A. Takeshima, and K. Yoshimura, 2020: Development of Integrated Land Simulator. Progress in Earth and Planetary Science, 7, doi:10.1186/s40645-020-00383-7.
- Noone, S., and Coauthors: Progress towards a holistic land and marine surface meteorological database and a call for additional contributions. Geoscience Data Journal, doi:10.1002/gdj3.109.
- Nordli, O., P. Wyszynski, H. M. Gjelten, K. Isaksen, E. Lupikasza, T. Niedzwiedz, and R. Przybylak, 2020: Revisiting the extended Svalbard Airport monthly temperature series, and the compiled corresponding daily series 1898-2018. Polar Research, 39, doi:10.33265/polar.v39.3614.
- O'Reilly, C. H., D. J. Befort, and A. Weisheimer, 2020: Calibrating large-ensemble European climate projections using observational data. Earth System Dynamics, 11, 1033-1049, doi:10.5194/esd-11-1033-2020.
- Paik, S., and S. K. Min, 2020: Quantifying the Anthropogenic Greenhouse Gas Contribution to the Observed Spring Snow-Cover Decline Using the CMIP6 Multimodel Ensemble. J. Clim., 33, 9261-9269, doi:10.1175/jcli-d-20-0002.1.
- Parfitt, R., C. C. Ummenhofer, B. M. Buckley, K. G. Hansen, and R. D. D'Arrigo, 2020: Distinct seasonal climate drivers revealed in a network of tree-ring records from Labrador, Canada. Climate Dynamics, 54, 1897-1911, doi:10.1007/s00382-019-05092-6.
- Pearl, J. K., K. J. Anchukaitis, N. Pederson, and J. P. Donnelly, 2020: Multivariate Climate Field Reconstructions Using Tree Rings for the Northeastern United States. Journal of Geophysical Research-Atmospheres, 125, doi:10.1029/2019jd031619.
- Pena, J. C., and L. Schulte, 2020: Simulated and reconstructed atmospheric variability and their relation with large Pre-industrial summer floods in the Hasli-Aare catchment (Swiss Alps) since 1300 CE. Global and Planetary Change, 190, doi:10.1016/j.gloplacha.2020.103191.
- Penna, A. C., R. R. Torres, S. R. Garcia, and J. A. Marengo, 2021: Moisture flows on Southeast Brazil: Present and future climate. International Journal of Climatology, 41, E935-E951, doi:10.1002/joc.6738.
- Perkins, W. A., and G. Hakim, 2020: Linear Inverse Modeling for Coupled Atmosphere-Ocean Ensemble Climate Prediction. Journal of Advances in Modeling Earth Systems, 12, doi:10.1029/2019ms001778.
- Piecuch, C. G., 2020: Likely weakening of the Florida Current during the past century revealed by sea-level observations. Nature Communications, 11, doi:10.1038/s41467-020-17761-w.
- Pinheiro, E., R. P. da Rocha, and A. Drumond, 2021: Assessment of 20th-century reanalysis circulation patterns associated with El Nino-Southern Oscillation impacts on the tropical Atlantic and northeastern Brazil rainy season. International Journal of Climatology, 41, 3824-3840, doi:10.1002/joc.6750.
- Pinheiro, H. R., K. I. Hodges, and M. A. Gan, 2020: An intercomparison of subtropical cut-off lows in the Southern Hemisphere using recent reanalyses: ERA-Interim, NCEP-CFRS, MERRA-2, JRA-55, and JRA-25. Climate Dynamics, 54, 777-792, doi:10.1007/s00382-019-05089-1.
- Pohl, E., C. Grenier, M. Vrac, and M. Kageyama, 2020: Emerging climate signals in the Lena River catchment: a non-parametric statistical approach. Hydrology and Earth System Sciences, 24, 2817-2839, doi:10.5194/hess-24-2817-2020.
- Polvani, L. M., and S. J. Camargo, 2020: Scant evidence for a volcanically forced winter warming over Eurasia following the Krakatau eruption of August 1883. Atmospheric Chemistry and Physics, 20, 13687-13700, doi:10.5194/acp-20-13687-2020.
- Przybylak, R., and P. Wyszynski, 2020: Air temperature changes in the Arctic in the period 1951-2015 in the light of observational and reanalysis data. Theoretical and Applied Climatology, 139, 75-94, doi:10.1007/s00704-019-02952-3.
- Raavi, P. H., and K. J. E. Walsh, 2020: Basinwise Statistical Analysis of Factors Limiting Tropical Storm Formation From an Initial Tropical Circulation. Journal of Geophysical Research-Atmospheres, 125, doi:10.1029/2019jd032006.
- Raavi, P. H., and K. J. E. Walsh, 2020: Sensitivity of Tropical Cyclone Formation to Resolution-Dependent and Independent Tracking Schemes in High-Resolution Climate Model Simulations. Earth and Space Science, 7, doi:10.1029/2019ea000906.
- Rajesh, P. V., and B. N. Goswami, 2020: Four-dimensional structure and sub-seasonal regulation of the Indian summer monsoon multi-decadal mode. Climate Dynamics, 55, 2645-2666, doi:10.1007/s00382-020-05407-y.
- Rao, K. K., and Coauthors, 2020: Projections of heat stress and associated work performance over India in response to global warming. Scientific Reports, 10, doi:10.1038/s41598-020-73245-3.
- Ratna, S. B., T. J. Osborn, M. Joshi, and J. Luterbacher, 2020: The Influence of Atlantic Variability on Asian Summer Climate Is Sensitive to the Pattern of the Sea Surface Temperature Anomaly. J. Clim., 33, 7567-7590, doi:10.1175/jcli-d-20-0039.1.
- Raynaud, D., B. Hingray, G. Evin, A. C. Favre, and J. Chardon, 2020: Assessment of meteorological extremes using a synoptic weather generator and a downscaling model based on analogues. Hydrology and Earth System Sciences, 24, 4339-4352, doi:10.5194/hess-24-4339-2020.
- Ren, Q. P., Y. L. Li, F. Wang, J. Duan, S. J. Hu, and F. J. Wang, 2020: Variability of the Mindanao Current Induced by El Ni(n)over-tildeo Events. J Phys Oceanogr, 50, 1753-1772, doi:10.1175/jpo-d-19-0150.1.
- Ren, Q. P., Y. L. Li, F. Zheng, F. Wang, J. Duan, and R. Li, 2020: Asymmetry of Interannual Sea Level Variability in the Western Tropical Pacific: Responses to El Nino and La Nina. Journal of Geophysical Research-Oceans, 125, doi:10.1029/2020jc016616.
- Ribera, P., P. Ordonez, D. Gallego, and C. Pena-Ortiz, 2020: Internal variability and external forcings in the ocean-atmosphere multidecadal oscillator over the North Atlantic. Climate Dynamics, 55, 909-923, doi:10.1007/s00382-020-05300-8.
- Rivera, J. A., and G. Arnould, 2020: Evaluation of the ability of CMIP6 models to simulate precipitation over Southwestern South America: Climatic features and long-term trends (1901-2014). Atmospheric Research, 241, doi:10.1016/j.atmosres.2020.104953.
- Robertson, F. R., and Coauthors, 2020: Uncertainties in Ocean Latent Heat Flux Variations over Recent Decades in Satellite-Based Estimates and Reduced Observation Reanalyses. J. Clim., 33, 8415-8437, doi:10.1175/jcli-d-19-0954.1.
- Robson, J., and Coauthors, 2020: The Evaluation of the North Atlantic Climate System in UKESM1 Historical Simulations for CMIP6. Journal of Advances in Modeling Earth Systems, 12, doi:10.1029/2020ms002126.
- Rocha, E., B. E. Gunnarson, and S. Holzkamper, 2020: Reconstructing Summer Precipitation with MXD Data fromPinus sylvestrisGrowing in the Stockholm Archipelago. Atmosphere, 11, doi:10.3390/atmos11080790.
- Rohmer, J., J. Louisor, G. Le Cozannet, P. Naveau, S. Thao, and X. Bertin, 2020: Attribution of Extreme Wave Height Records along the North Atlantic Coasts using Hindcast Data: Feasibility and Limitations. Journal of Coastal Research, 1268-1272, doi:10.2112/si95-245.1.
- Roy, I., 2020: Major Climate Variability and Natural Factors in Boreal Winter. Pure and Applied Geophysics, 177, 4983-5005, doi:10.1007/s00024-020-02522-z.
- Sabatier, P., and Coauthors, 2020: Past African dust inputs in the western Mediterranean area controlled by the complex interaction between the Intertropical Convergence Zone, the North Atlantic Oscillation, and total solar irradiance. Climate of the Past, 16, 283-298, doi:10.5194/cp-16-283-2020.
- Salinger, M. J., and Coauthors, 2020: Unparalleled coupled ocean-atmosphere summer heatwaves in the New Zealand region: drivers, mechanisms and impacts. Climatic Change, 162, 485-506, doi:10.1007/s10584-020-02730-5.
- Santolaria-Otin, M., and O. Zolina, 2020: Evaluation of snow cover and snow water equivalent in the continental Arctic in CMIP5 models. Climate Dynamics, 55, 2993-3016, doi:10.1007/s00382-020-05434-9.
- Saunders, M. A., P. J. Klotzbach, A. S. R. Lea, C. J. Schreck, and M. M. Bell, 2020: Quantifying the Probability and Causes of the Surprisingly Active 2018 North Atlantic Hurricane Season. Earth and Space Science, 7, doi:10.1029/2019ea000852.
- Schrapffer, A., A. Sorensson, J. Polcher, and L. Fita, 2020: Benefits of representing floodplains in a Land Surface Model: Pantanal simulated with ORCHIDEE CMIP6 version. Climate Dynamics, 55, 1303-1323, doi:10.1007/s00382-020-05324-0.
- Scussolini, P., and Coauthors, 2020: Global River Discharge and Floods in the Warmer Climate of the Last Interglacial. Geophysical Research Letters, 47, doi:10.1029/2020gl089375. Serykh, I. V., A. V. Tolstikov, and Iop, 2019: On the climatic changes of the surface air temperature in the White Sea region. All-Russian Conference on Climate Change - Causes, Risks, Consequences, Problems of Adaptation and Management (CLIMATE), Russian Acad Sci, Presidium, Moscow, RUSSIA.
- Shen, S. S. P., J. Pierret, I. Dorado, and S. Ilawe, 2020: 4DVD visualization and delivery of the 20th century reanalysis data: methods and examples. Theoretical and Applied Climatology, 142, 243-254, doi:10.1007/s00704-020-03288-z.
- Sherman, P., E. Tziperman, C. Deser, and M. McElroy, 2020: Historical and Future Roles of Internal Atmospheric Variability in Modulating Summertime Greenland Ice Sheet Melt. Geophysical Research Letters, 47, doi:10.1029/2019gl086913.
- Si, D., D. B. Jiang, A. X. Hu, and X. M. Lang, 2021: Variations in northeast Asian summer precipitation driven by the Atlantic multidecadal oscillation. International Journal of Climatology, 41, 1682-1695, doi:10.1002/joc.6912.
- Si, D., D. B. Jiang, and H. J. Wang, 2020: Intensification of the Atlantic Multidecadal Variability Since 1870: Implications and Possible Causes. Journal of Geophysical Research-Atmospheres, 125, doi:10.1029/2019jd030977.
- Simon, M. H., and Coauthors, 2020: A multi-decadal record of oceanographic changes of the past similar to 165 years (1850-2015 AD) from Northwest of Iceland. Plos One, 15, doi:10.1371/journal.pone.0239373.
- Simpson, I. R., and Coauthors, 2020: An Evaluation of the Large-Scale Atmospheric Circulation and Its Variability in CESM2 and Other CMIP Models. Journal of Geophysical Research-Atmospheres, 125, doi:10.1029/2020jd032835.
- Sippel, S., E. M. Fischer, S. C. Scherrer, N. Meinshausen, and R. Knutti, 2020: Late 1980s abrupt cold season temperature change in Europe consistent with circulation variability and long-term warming. Environmental Research Letters, 15, doi:10.1088/1748-9326/ab86f2.
- Sippel, S., N. Meinshausen, E. M. Fischer, E. Szekely, and R. Knutti, 2020: Climate change now detectable from any single day of weather at global scale. Nature Climate Change, 10, 35-+, doi:10.1038/s41558-019-0666-7.
- Sjolte, J., F. Adolphi, B. M. Vinther, R. Muscheler, C. Sturm, M. Werner, and G. Lohmann, 2020: Seasonal reconstructions coupling ice core data and an isotope-enabled climate model - methodological implications of seasonality, climate modes and selection of proxy data. Climate of the Past, 16, 1737-1758, doi:10.5194/cp-16-1737-2020.
- Stolpe, M. B., K. Cowtan, I. Medhaug, and R. Knutti, 2021: Pacific variability reconciles observed and modelled global mean temperature increase since 1950. Climate Dynamics, 56, 613-634, doi:10.1007/s00382-020-05493-y.
- Strong, C., G. J. McCabe, and A. Weech, 2020: Step Increase in Eastern US Precipitation Linked to Indian Ocean Warming. Geophysical Research Letters, 47, doi:10.1029/2020gl088911.
- Stucki, P., P. Froidevaux, M. Zamuriano, F. A. Isotta, M. Messmer, and A. Martynov, 2020: Simulations of the 2005, 1910, and 1876 Vb cyclones over the Alps - sensitivity to model physics and cyclonic moisture flux. Natural Hazards and Earth System Sciences, 20, 35-57, doi:10.5194/nhess-20-35-2020.
- Sun, C., Y. S. Liu, Z. Q. Gong, F. Kucharski, J. P. Li, Q. Y. Wang, and X. Li, 2020: The Footprint of Atlantic Multidecadal Oscillation on the Intensity of Tropical Cyclones Over the Western North Pacific. Frontiers in Earth Science, 8, doi:10.3389/feart.2020.604807.
- Sung, M. K., C. Yoo, S. W. Yeh, Y. Kosaka, and S. I. An, 2020: Characteristics of the North Pacific Oscillation in CMIP5 Models in Relation to Atmospheric Mean States. J. Clim., 33, 3809-3825, doi:10.1175/jcli-d-19-0446.1.
- Tadesse, M., T. Wahl, and A. Cid, 2020: Data-Driven Modeling of Global Storm Surges. Frontiers in Marine Science, 7, doi:10.3389/fmars.2020.00260.
- Tafasca, S., A. Ducharne, and C. Valentin, 2020: Weak sensitivity of the terrestrial water budget to global soil texture maps in the ORCHIDEE land surface model. Hydrology and Earth System Sciences, 24, 3753-3774, doi:10.5194/hess-24-3753-2020.
- Tamang, S. K., A. M. Ebtehaj, A. F. Prein, and A. J. Heymsfield, 2020: Linking Global Changes of Snowfall and Wet-Bulb Temperature. J. Clim., 33, 39-59, doi:10.1175/jcli-d-19-0254.1.
- Tan, W., Z. X. Wei, Q. Liu, Q. J. Fu, M. Y. Chen, B. T. Li, and J. Li, 2020: Different Influences of Two El Nino Types on Low-Level Atmospheric Circulation over the Subtropical Western North Pacific. J. Clim., 33, 825-846, doi:10.1175/jcli-d-19-0223.1.
- Tedesco, M., and X. Fettweis, 2020: Unprecedented atmospheric conditions (1948-2019) drive the 2019 exceptional melting season over the Greenland ice sheet. Cryosphere, 14, 1209-1223, doi:10.5194/tc-14-1209-2020.
- Thapa, U. K., S. St George, and V. Trouet, 2020: Poleward Excursions by the Himalayan Subtropical Jet Over the Past Four Centuries. Geophysical Research Letters, 47, doi:10.1029/2020gl089631.
- Thatcher, D. L., and Coauthors, 2020: Hydroclimate variability from western Iberia (Portugal) during the Holocene: Insights from a composite stalagmite isotope record. Holocene, 30, 966-981, doi:10.1177/0959683620908648.
- Thomas, N., S. Nigam, and V. Ravi, 2021: Seasonality in the Vertical Structure of Long-Term Temperature Trends Over North America. Atmosphere-Ocean, 59, 29-38, doi:10.1080/07055900.2020.1855409.
- Topal, D., I. G. Hatvani, and Z. Kern, 2020: Refining projected multidecadal hydroclimate uncertainty in East-Central Europe using CMIP5 and single-model large ensemble simulations. Theoretical and Applied Climatology, 142, 1147-1167, doi:10.1007/s00704-020-03361-7.
- Tseng, Y. H., R. Q. Ding, S. Zhao, Y. C. Kuo, and Y. C. Liang, 2020: Could the North Pacific Oscillation Be Modified by the Initiation of the East Asian Winter Monsoon? J. Clim., 33, 2389-2406, doi:10.1175/jcli-d-19-0112.1.
- Tuel, A., and E. A. B. Eltahir, 2020: Why Is the Mediterranean a Climate Change Hot Spot? J. Clim., 33, 5829-5843, doi:10.1175/jcli-d-19-0910.1.
- Vega, I., P. Ribera, and D. Gallego, 2020: Characteristics of the Onset, Withdrawal, and Breaks of the Western North Pacific Summer Monsoon in the 1949-2014 Period. J. Clim., 33, 7371-7389, doi:10.1175/jcli-d-19-0734.1.
- Veiga, S. F., E. Giarolla, P. Nobre, and C. A. Nobre, 2020: Analyzing the Influence of the North Atlantic Ocean Variability on the Atlantic Meridional Mode on Decadal Time Scales. Atmosphere, 11, doi:10.3390/atmos11010003.
- Wahl, E. R., A. Hoell, E. Zorita, E. Gille, and H. F. Diaz, 2020: A 450-Year Perspective on California Precipitation "Flips". J. Clim., 33, 10221-10237, doi:10.1175/jcli-d-19-0828.1.
- Wang, A. H., and X. H. Kong, 2021: Regional climate model simulation of soil moisture and its application in drought reconstruction across China from 1911 to 2010. International Journal of Climatology, 41, E1028-E1044, doi:10.1002/joc.6748.
- Wang, C. G., Y. Y. Hu, X. Y. Wen, C. Zhou, and J. P. Liu, 2020: Inter-model spread of the climatological annual mean Hadley circulation and its relationship with the double ITCZ bias in CMIP5. Climate Dynamics, 55, 2823-2834, doi:10.1007/s00382-020-05414-z.
- Wang, J., J. M. Feng, Z. W. Yan, Y. Qiu, and L. J. Cao, 2020: An analysis of the urbanization contribution to observed terrestrial stilling in the Beijing-Tianjin-Hebei region of China. Environmental Research Letters, 15, doi:10.1088/1748-9326/ab7396.
- Wang, Y., and Coauthors, 2020: Sensitivity of Snow Simulations to Different Atmospheric Forcing Data Sets in the Land Surface Model CAS-LSM. Journal of Geophysical Research-Atmospheres, 125, doi:10.1029/2019jd032001.
- Wang, Z. Y., T. Li, J. Y. Gao, and M. Peng, 2020: Enhanced winter and summer trend difference of Madden-Julian Oscillation intensity since 1871. International Journal of Climatology, 40, 6369-6381, doi:10.1002/joc.6586.
- Weisheimer, A., D. J. Befort, D. MacLeod, T. Palmer, C. O'Reilly, and K. Strommen, 2020: Seasonal Forecasts of the Twentieth Century. Bulletin of the American Meteorological Society, 101, E1413-E1426, doi:10.1175/bams-d-19-0019.1.
- Whiting, J. M., T. P. Wang, Z. Q. Yang, M. H. Huesemann, P. J. Wolfram, T. F. Mumford, and D. Righi, 2020: Simulating the Trajectory and Biomass Growth of Free-Floating Macroalgal Cultivation Platforms along the U.S. West Coast. Journal of Marine Science and Engineering, 8, doi:10.3390/jmse8110938.
- Wohland, J., D. Brayshaw, H. Bloomfield, and M. Wild, 2020: European multidecadal solar variability badly captured in all centennial reanalyses except CERA20C. Environmental Research Letters, 15, doi:10.1088/1748-9326/aba7e6.
- Woodhouse, C. A., D. M. Meko, and E. R. Bigio, 2020: A Long View of Southern California Water Supply: Perfect Droughts Revisited. Journal of the American Water Resources Association, 56, 212-229, doi:10.1111/1752-1688.12822.
- Wu, B. L., X. P. Lin, and L. S. Yu, 2020: Decadal to Multidecadal Variability of the Mixed Layer to the South of the Kuroshio Extension Region. J. Clim., 33, 7697-7714, doi:10.1175/jcli-d-20-0115.1.
- Wu, Y. K., A. Y. Huang, C. K. Wu, C. C. Hong, and C. C. Chang, 2020: Effect of Warm SST in the Subtropical Eastern North Pacific on Triggering the Abrupt Change of the Mei-Yu Rainfall over South China in the Early 1990s. J. Clim., 33, 657-673, doi:10.1175/jcli-d-18-0292.1.
- Xiao, F. A., D. X. Wang, and L. Yang, 2020: Can Tropical Pacific Winds Enhance the Footprint of the Interdecadal Pacific Oscillation on the Upper-Ocean Heat Content in the South China Sea? J. Clim., 33, 4419-4437, doi:10.1175/jcli-d-19-0679.1.
- Xiao, X. C., D. Q. Huang, B. Yang, J. Zhu, P. W. Yan, and Y. C. Zhang, 2020: Contributions of Different Combinations of the IPO and AMO to the Concurrent Variations of Summer East Asian Jets. J. Clim., 33, 7967-7982, doi:10.1175/jcli-d-19-0366.1.
- Xie, M. M., and C. Z. Wang, 2020: Decadal Variability of the Anticyclone in the Western North Pacific. J. Clim., 33, 9031-9043, doi:10.1175/jcli-d-20-0008.1.
- Xing, C., F. Liu, B. Wang, D. L. Chen, J. Liu, and B. Liu, 2020: Boreal Winter Surface Air Temperature Responses to Large Tropical Volcanic Eruptions in CMIP5 Models. J. Clim., 33, 2407-2426, doi:10.1175/jcli-d-19-0186.1.
- Xiong, P., and Coauthors, 2020: Modeling paleogeographic scenarios of the last glacial cycle as a base for source-to-sink studies: An example from the northwestern shelf of the South China Sea. Journal of Asian Earth Sciences, 203, doi:10.1016/j.jseaes.2020.104542.
- Xue, X., W. Chen, and Q. Zhou, 2020: Solar cycle modulation of the connection between boreal winter ENSO and following summer South Asia high. Journal of Atmospheric and Solar-Terrestrial Physics, 211, doi:10.1016/j.jastp.2020.105466.
- Yu, J., T. J. Zhou, and Z. H. Jiang, 2020: Interannual variability of the summer wind energy over China: A comparison of multiple datasets. Wind Energy, 23, 1726-1738, doi:10.1002/we.2512.
- Yu, L. J., S. Y. Zhong, C. J. Sui, and B. Sun, 2020: Revisiting the trend in the occurrences of the "warm Arctic-cold Eurasian continent" temperature pattern. Atmospheric Chemistry and Physics, 20, 13753-13770, doi:10.5194/acp-20-13753-2020.
- Yuan, T. L., H. B. Yu, M. Chin, L. A. Remer, D. McGee, and A. Evan, 2020: Anthropogenic Decline of African Dust: Insights From the Holocene Records and Beyond. Geophysical Research Letters, 47, doi:10.1029/2020gl089711.
- Zhai, F. G., and Y. Z. Gu, 2020: Abyssal Circulation in the Philippine Sea. Journal of Ocean University of China, 19, 249-262, doi:10.1007/s11802-020-4241-7.
- Zhang, G., H. Murakami, T. R. Knutson, R. Mizuta, and K. Yoshida, 2020: Tropical cyclone motion in a changing climate. Science Advances, 6, doi:10.1126/sciadv.aaz7610.
- Zhang, H. Y., C. H. Wu, P. J. F. Yeh, and B. X. Hu, 2020: Global pattern of short-term concurrent hot and dry extremes and its relationship to large-scale climate indices. International Journal of Climatology, 40, 5906-5924, doi:10.1002/joc.6555.
- Zhang, J. E., B. S. Felzer, and T. J. Troy, 2020: Projected changes of carbon balance in mesic grassland ecosystems in response to warming and elevated CO2 using CMIP5 GCM results in the Central Great Plains, USA. Ecol Model, 434, doi:10.1016/j.ecolmodel.2020.109247.
- Zhang, L., B. L. Gan, C. Y. Wang, L. X. Wu, and W. J. Cai, 2021: Decadal coupling between storm tracks and sea surface temperature in the Southern Hemisphere midlatitudes. Climate Dynamics, 56, 783-798, doi:10.1007/s00382-020-05503-z.
- Zhang, L., B. L. Gan, H. Wang, L. X. Wu, and W. J. Cai, 2020: Essential Role of the Midlatitude South Atlantic Variability in Altering the Southern Hemisphere Summer Storm Tracks. Geophysical Research Letters, 47, doi:10.1029/2020gl087910.
- Zhang, L., and W. Q. Han, 2020: Barrier for the Eastward Propagation of Madden-Julian Oscillation Over the Maritime Continent: A Possible New Mechanism. Geophysical Research Letters, 47, doi:10.1029/2020gl090211.
- Zhang, L., W. Lau, W. Tao, and Z. Li, 2020: Large Wildfires in the Western United States Exacerbated by Tropospheric Drying Linked to a Multi-Decadal Trend in the Expansion of the Hadley Circulation. Geophysical Research Letters, 47, doi:10.1029/2020gl087911.
- Zhang, R. J., Y. Y. Guo, Z. P. Wen, and R. G. Wu, 2020: Distinct patterns of sea surface temperature anomaly in the South Indian Ocean during austral autumn. Climate Dynamics, 54, 2663-2682, doi:10.1007/s00382-020-05135-3.
- Zhang, Y., G. X. Mao, C. C. Chen, Z. H. Lu, Z. Luo, and W. T. Zhou, 2020: Population exposure to concurrent daytime and nighttime heatwaves in Huai River Basin, China. Sustainable Cities and Society, 61, doi:10.1016/j.scs.2020.102309.
- Zhang, Y., B. D. Qian, and G. Hong, 2020: A Long-Term, 1-km Resolution Daily Meteorological Dataset for Modeling and Mapping Permafrost in Canada. Atmosphere, 11, doi:10.3390/atmos11121363.
- Zhao, J. W., R. F. Zhan, Y. Q. Wang, S. P. Xie, and Q. Wu, 2020: Untangling impacts of global warming and Interdecadal Pacific Oscillation on long-term variability of North Pacific tropical cyclone track density. Science Advances, 6, doi:10.1126/sciadv.aba6813.
- Zhao, S. Y., T. J. Zhou, and X. L. Chen, 2020: Consistency of extreme temperature changes in China under a historical half-degree warming increment across different reanalysis and observational datasets. Climate Dynamics, 54, 2465-2479, doi:10.1007/s00382-020-05128-2.
- Zhen, Y. C., P. Tandeo, S. Leroux, S. Metref, T. Penduff, and J. Le Sommer, 2020: An Adaptive Optimal Interpolation Based on Analog Forecasting: Application to SSH in the Gulf of Mexico. Journal of Atmospheric and Oceanic Technology, 37, 1697-1711, doi:10.1175/jtech-d-20-0001.1.
- Alexandrov, G. G., 2020: Climatically Driven Minimum of Energy Demand for Heating in Cities at the Center of the European Part of Russia. Izvestiya Atmospheric and Oceanic Physics, 56, 613-617, doi:10.1134/s000143382006002x.
- Allchin, M. I., and S. J. Dery, 2020: The Climatological Context of Trends in the Onset of Northern Hemisphere Seasonal Snow Cover, 1972-2017. Journal of Geophysical Research-Atmospheres, 125, doi:10.1029/2019jd032367.
- Ballinger, T. J., and Coauthors, 2021: The role of blocking circulation and emerging open water feedbacks on Greenland cold-season air temperature variability over the last century. International Journal of Climatology, 41, E2778-E2800, doi:10.1002/joc.6879.
- Bonfils, C. J. W., B. D. Santer, J. C. Fyfe, K. Marvel, T. J. Phillips, and S. R. H. Zimmerman, 2020: Human influence on joint changes in temperature, rainfall and continental aridity. Nature Climate Change, 10, 726-+, doi:10.1038/s41558-020-0821-1.
- Boustead, B. M., M. D. Shulski, and S. D. Hilberg, 2020: The Long Winter of 1880/81. Bulletin of the American Meteorological Society, 101, E797-E813, doi:10.1175/bams-d-19-0014.1.
- Bronnimann, S., 2020: Synthetic weather diaries: concept and application to Swiss weather in 1816. Climate of the Past, 16, 1937-1952, doi:10.5194/cp-16-1937-2020.
- Bronnimann, S., and S. Nichol, 2020: Total column ozone in New Zealand and in the UK in the 1950s. Atmospheric Chemistry and Physics, 20, 14333-14346, doi:10.5194/acp-20-14333-2020.
- Brugnara, Y., L. Pfister, L. Villiger, C. Rohr, F. A. Isotta, and S. Bronnimann, 2020: Early instrumental meteorological observations in Switzerland: 1708-1873. Earth System Science Data, 12, 1179-1190, doi:10.5194/essd-12-1179-2020.
- Camuffo, D., 2020: Key problems in early wine-spirit thermometers and the "true Reaumur" thermometer. Climatic Change, 163, 1083-1102, doi:10.1007/s10584-020-02910-3.
- Capozzi, V., Y. Cotroneo, P. Castagno, C. De Vivo, and G. Budillon, 2020: Rescue and quality control of sub-daily meteorological data collected at Montevergine Observatory (Southern Apennines), 1884-1963. Earth System Science Data, 12, 1467-1487, doi:10.5194/essd-12-1467-2020.
- Cheval, S., and Coauthors, 2021: Enriching the historical meteorological information using Romanian language newspaper reports: A database from 1880 to 1900. International Journal of Climatology, 41, E548-E562, doi:10.1002/joc.6709.
- Craig, P. M., and E. Hawkins, 2020: Digitizing observations from the Met Office Daily Weather Reports for 1900-1910 using citizen scientist volunteers. Geoscience Data Journal, 7, 116-134, doi:10.1002/gdj3.93.
- Dasgupta, P., A. Metya, C. V. Naidu, M. Singh, and M. K. Roxy, 2020: Exploring the long-term changes in the Madden Julian Oscillation using machine learning. Scientific Reports, 10, doi:10.1038/s41598-020-75508-5.
- Dunn, R. J. H., D. M. Stanitski, N. Gobron, and K. M. Willett, 2020: GLOBAL CLIMATE. Bulletin of the American Meteorological Society, 101, S17-S127, doi:Fogt, R. L., C. P. Belak, J. M. Jones, L. C. Slivinski, and G. P. Compo, 2021: An assessment of early 20th century Antarctic pressure reconstructions using historical observations. International Journal of Climatology, 41, E672-E689, doi:10.1002/joc.6718.
- Franke, J., V. Valler, S. Bronnimann, R. Neukom, and F. Jaume-Santero, 2020: The importance of input data quality and quantity in climate field reconstructions - results from the assimilation of various tree-ring collections. Climate of the Past, 16, 1061-1074, doi:10.5194/cp-16-1061-2020.
- Gao, M. X., S. Y. Yang, and T. Li, 2020: The Spatio-Temporal Variation of Pacific Blocking Frequency within Winter Months and Its Relationship with Surface Air Temperature. Atmosphere, 11, doi:10.3390/atmos11090960.
- Gergis, J., L. Ashcroft, and P. Whetton, 2020: A historical perspective on Australian temperature extremes. Climate Dynamics, 55, 843-868, doi:10.1007/s00382-020-05298-z.
- Gos, M., P. Baranowski, J. Krzyszczak, A. Kieliszek, and K. Siwek, 2021: Dynamics of meteorological time series on the base of ground measurements and retrospective data fromMERRA-2 for Poland. International Journal of Climatology, 41, E1531-E1552, doi:10.1002/joc.6787.
- Hernandez, A., and Coauthors, 2020: Modes of climate variability: Synthesis and review of proxy-based reconstructions through the Holocene. Earth-Science Reviews, 209, doi:10.1016/j.earscirev.2020.103286.
- Hobbs, W. R., A. R. Klekociuk, and Y. H. Pan, 2020: Validation of reanalysis Southern Ocean atmosphere trends using sea ice data. Atmospheric Chemistry and Physics, 20, 14757-14768, doi:10.5194/acp-20-14757-2020.
- Ionita, M., V. Nagavciuc, and B. Guan, 2020: Rivers in the sky, flooding on the ground: the role of atmospheric rivers in inland flooding in central Europe. Hydrology and Earth System Sciences, 24, 5125-5147, doi:10.5194/hess-24-5125-2020.
- Ionita, M., V. Nagavciuc, R. Kumar, and O. Rakovec, 2020: On the curious case of the recent decade, mid-spring precipitation deficit in central Europe. Npj Climate and Atmospheric Science, 3, doi:10.1038/s41612-020-00153-8.
- Luo, X., B. Wang, A. G. Frazier, and T. W. Giambelluca, 2020: Distinguishing Variability Regimes of Hawaiian Summer Rainfall: Quasi-Biennial and Interdecadal Oscillations. Geophysical Research Letters, 47, doi:10.1029/2020gl091260.
- Mazzoglio, P., I. Butera, and P. Claps, 2020: I-2-RED: A Massive Update and Quality Control of the Italian Annual Extreme Rainfall Dataset. Water, 12, doi:10.3390/w12123308.
- Merrifield, A. L., L. Brunner, R. Lorenz, I. Medhaug, and R. Knutti, 2020: An investigation of weighting schemes suitable for incorporating large ensembles into multi-model ensembles. Earth System Dynamics, 11, 807-834, doi:10.5194/esd-11-807-2020.
- Murphy, C., and Coauthors, 2020: The forgotten drought of 1765-1768: Reconstructing and re-evaluating historical droughts in the British and Irish Isles. International Journal of Climatology, 40, 5329-5351, doi:10.1002/joc.6521.
- Murray, D., and Coauthors, 2020: Facility for Weather and Climate Assessments (FACTS) A Community Resource for Assessing Weather and Climate Variability. Bulletin of the American Meteorological Society, 101, E1214-E1224, doi:10.1175/bams-d-19-0224.1.
- Noone, S., and Coauthors: Progress towards a holistic land and marine surface meteorological database and a call for additional contributions. Geoscience Data Journal, doi:10.1002/gdj3.109.
- Parsons, L. A., M. K. Brennan, R. C. J. Wills, and C. Proistosescu, 2020: Magnitudes and Spatial Patterns of Interdecadal Temperature Variability in CMIP6. Geophysical Research Letters, 47, doi:10.1029/2019gl086588.
- Pena, J. C., and L. Schulte, 2020: Simulated and reconstructed atmospheric variability and their relation with large Pre-industrial summer floods in the Hasli-Aare catchment (Swiss Alps) since 1300 CE. Global and Planetary Change, 190, doi:10.1016/j.gloplacha.2020.103191.
- Philip, S. Y., S. F. Kew, K. van der Wiel, N. Wanders, and G. J. van Oldenborgh, 2020: Regional differentiation in climate change induced drought trends in the Netherlands. Environmental Research Letters, 15, doi:10.1088/1748-9326/ab97ca.
- Rajesh, P. V., and B. N. Goswami, 2020: Four-dimensional structure and sub-seasonal regulation of the Indian summer monsoon multi-decadal mode. Climate Dynamics, 55, 2645-2666, doi:10.1007/s00382-020-05407-y.
- Rimbu, N., G. Lohmann, M. Ionita, M. Czymzik, and A. Brauer, 2021: Interannual to millennial-scale variability of River Ammer floods and its relationship with solar forcing. International Journal of Climatology, 41, E644-E655, doi:10.1002/joc.6715.
- Robertson, F. R., and Coauthors, 2020: Uncertainties in Ocean Latent Heat Flux Variations over Recent Decades in Satellite-Based Estimates and Reduced Observation Reanalyses. J. Clim., 33, 8415-8437, doi:10.1175/jcli-d-19-0954.1.
- Sandonis, L., J. C. Gonzalez-Hidalgo, D. Pena-Angulo, and S. Begueria, 2020: Mean temperature evolution on the Spanish mainland 1916-2015. Climate Research, 82, 177-189, doi:10.3354/cr01627.
- Shonk, J. K. P., A. G. Turner, A. Chevuturi, L. J. Wilcox, A. J. Dittus, and E. Hawkins, 2020: Uncertainty in aerosol radiative forcing impacts the simulated global monsoon in the 20th century. Atmospheric Chemistry and Physics, 20, 14903-14915, doi:10.5194/acp-20-14903-2020.
- Song, S. Y., S. W. Yeh, and J. H. Park, 2020: Dissimilar characteristics associated with the 1976/1977 and 1998/1999 climate regime shifts in the North Pacific. Theoretical and Applied Climatology, 142, 1463-1470, doi:10.1007/s00704-020-03378-y.
- Tardif, J. C., M. W. Salzer, F. Conciatori, A. G. Bunn, and M. K. Hughes, 2020: Formation, structure and climatic significance of blue rings and frost rings in high elevation bristlecone pine (Pinus longaeva DK Bailey). Quaternary Science Reviews, 244, doi:10.1016/j.quascirev.2020.106516.
- Thapa, U. K., S. St George, and V. Trouet, 2020: Poleward Excursions by the Himalayan Subtropical Jet Over the Past Four Centuries. Geophysical Research Letters, 47, doi:10.1029/2020gl089631.
- Topal, D., I. G. Hatvani, and Z. Kern, 2020: Refining projected multidecadal hydroclimate uncertainty in East-Central Europe using CMIP5 and single-model large ensemble simulations. Theoretical and Applied Climatology, 142, 1147-1167, doi:10.1007/s00704-020-03361-7.
- Valler, V., Y. Brugnara, J. Franke, and S. Bronnimann, 2020: Assimilating monthly precipitation data in a paleoclimate data assimilation framework. Climate of the Past, 16, 1309-1323, doi:10.5194/cp-16-1309-2020.
- Wahl, E. R., A. Hoell, E. Zorita, E. Gille, and H. F. Diaz, 2020: A 450-Year Perspective on California Precipitation "Flips". J. Clim., 33, 10221-10237, doi:10.1175/jcli-d-19-0828.1.
- Wohland, J., D. Brayshaw, H. Bloomfield, and M. Wild, 2020: European multidecadal solar variability badly captured in all centennial reanalyses except CERA20C. Environmental Research Letters, 15, doi:10.1088/1748-9326/aba7e6.
- Zhang, Y., B. D. Qian, and G. Hong, 2020: A Long-Term, 1-km Resolution Daily Meteorological Dataset for Modeling and Mapping Permafrost in Canada. Atmosphere, 11, doi:10.3390/atmos11121363.
- Allen, K. J., and Coauthors, 2019: Tree-ring reconstructions of cool season temperature for far southeastern Australia, 1731-2007. Climate Dynamics, 53, 569-583, doi:10.1007/s00382-018-04602-2.
- Alvarez-Castro, M. C., D. Faranda, T. Noel, and P. Yiou, 2019: Recurrence Spectra of European Temperature in Historical Climate Simulations. Atmosphere, 10, doi:10.3390/atmos10040166.
- Alvarez-Garcia, F. J., M. J. OrtizBevia, W. Cabos, M. Tasambay-Salazar, and A. RuizdeElvira, 2019: Linear and nonlinear links of winter European precipitation to Northern Hemisphere circulation patterns. Climate Dynamics, 52, 6533-6555, doi:10.1007/s00382-018-4531-6.
- Amato, R., H. Steptoe, E. Buonomo, and R. Jones, 2019: High-Resolution History: Downscaling China's Climate from the 20CRv2c Reanalysis. Journal of Applied Meteorology and Climatology, 58, 2141-2157, doi:10.1175/jamc-d-19-0083.1.
- Anchukaitis, K. J., E. R. Cook, B. I. Cook, J. Pearl, R. D'Arrigo, and R. Wilson, 2019: Coupled Modes of North Atlantic Ocean-Atmosphere Variability and the Onset of the Little Ice Age. Geophysical Research Letters, 46, 12417-12426, doi:10.1029/2019gl084350.
- Anderson, B. T.: Empirical Evidence Linking the Pacific Decadal Precession to Kuroshio Extension Variability. Journal of Geophysical Research-Atmospheres, doi:10.1029/2019jd031163.
- Anderson, B. T., 2019: Empirical Evidence Linking the Pacific Decadal Precession to Kuroshio Extension Variability. Journal of Geophysical Research-Atmospheres, 124, 12845-12863, doi:10.1029/2019jd031163.
- Andreoli, R. V., and Coauthors, 2019: Effects of two different La Nina types on the South American rainfall. International Journal of Climatology, 39, 1415-1428, doi:10.1002/joc.5891.
- Antonov, A., G. Lohmann, M. Ionita, M. Dima, and L. Linsen, 2019: An interactive visual analysis tool for investigating teleconnections in climate simulations. Environmental Earth Sciences, 78, doi:10.1007/s12665-019-8295-z.
- Arazny, A., P. Wyszynski, and R. Przybylak, 2019: A comparison of bioclimatic conditions on Franz Josef Land (the Arctic) between the turn of the nineteenth to twentieth century and present day. Theoretical and Applied Climatology, 137, 2623-2638, doi:10.1007/s00704-018-02763-y.
- Ashcroft, L., D. J. Karoly, and A. J. Dowdy, 2019: Historical extreme rainfall events in southeastern Australia. Weather and Climate Extremes, 25, doi:10.1016/j.wace.2019.100210.
- Auger, J. D., P. A. Mayewski, K. A. Maasch, K. C. Schuenemann, A. M. Carleton, S. D. Birkel, and J. E. Saros, 2019: 2000 years of North Atlantic-Arctic climate. Quaternary Science Reviews, 216, 1-17, doi:10.1016/j.quascirev.2019.05.020.
- Babolcsai, G., and T. Hirsch, 2019: Teleconnection between mean sea level pressure in the North Atlantic for September, the AMO phase and mean temperature in Central Europe for December (1896-2015). Meteorological Applications, 26, 267-274, doi:10.1002/met.1760.
- Badaluta, C. A., A. Persoiu, M. Ionita, V. Nagavciuc, and P. I. Bistricean, 2019: Stable H and O isotope-based investigation of moisture sources and their role in river and groundwater recharge in the NE Carpathian Mountains, East-Central Europe. Isotopes in Environmental and Health Studies, 55, doi:10.1080/10256016.2019.1588895.
- Baduru, B., B. Paul, D. S. Banerjee, S. Sanikommu, and A. Paul, 2019: Ensemble based regional ocean data assimilation system for the Indian Ocean: Implementation and evaluation. Ocean Modelling, 143, doi:10.1016/j.ocemod.2019.101470.
- Baek, S. H., J. E. Smerdon, R. Seager, A. P. Williams, and B. I. Cook, 2019: Pacific Ocean Forcing and Atmospheric Variability Are the Dominant Causes of Spatially Widespread Droughts in the Contiguous United States. Journal of Geophysical Research-Atmospheres, 124, 2507-2524, doi:10.1029/2018jd029219.
- Baker, H. S., T. Woollings, C. E. Forest, and M. R. Allen, 2019: The Linear Sensitivity of the North Atlantic Oscillation and Eddy-Driven Jet to SSTs. J. Clim., 32, 6491-6511, doi:10.1175/jcli-d-19-0038.1.
- Ballesteros-Canovas, J. A., and Coauthors, 2019: On the extraordinary winter flood episode over the North Atlantic Basin in 1936. Annals of the New York Academy of Sciences, 1436, 206-216, doi:10.1111/nyas.13911.
- Baudouin, J. P., L. P. Caron, and M. Boudreault, 2019: Impact of reanalysis boundary conditions on downscaled Atlantic hurricane activity. Climate Dynamics, 52, 3709-3727, doi:10.1007/s00382-018-4352-7.
- Benestad, R. E., H. B. Erlandsen, A. Mezghani, and K. M. Parding, 2019: Geographical Distribution of Thermometers Gives the Appearance of Lower Historical Global Warming. Geophysical Research Letters, 46, 7654-7662, doi:10.1029/2019gl083474.
- Beniston, M., 2019: Modulation of extreme temperatures in Europe under extreme values of the North Atlantic Oscillation Index. Annals of the New York Academy of Sciences, 1436, 174-183, doi:10.1111/nyas.13636.
- Bertolacci, M., E. Cripps, O. Rosen, J. W. Lau, and S. Cripps, 2019: CLIMATE INFERENCE ON DAILY RAINFALL ACROSS THE AUSTRALIAN CONTINENT, 1876-2015. Annals of Applied Statistics, 13, 683-712, doi:10.1214/18-aoas1218.
- Bjorck, S., and Coauthors, 2019: A South Atlantic island record uncovers shifts in westerlies and hydroclimate during the last glacial. Climate of the Past, 15, 1939-1958, doi:10.5194/cp-15-1939-2019. Bokuchava, D. D., V. A. Semenov, and V. V. Popova, 2019: Features of the winter atmospheric circulation structure in the Northern Hemisphere from observations and 20th century reanalyses data. 25th International Symposium on Atmospheric and Ocean Optics: Atmospheric Physics, G. G. Matvienko, and O. A. Romanovskii, Eds.
- Bolles, K., M. Sweeney, and S. Forman, 2019: Meteorological catalysts of dust events and particle source dynamics of affected soils during the 1930s Dust Bowl drought, Southern High Plains, USA. Anthropocene, 27, doi:10.1016/j.ancene.2019.100216.
- Borchert, L. F., A. Duesterhus, S. Brune, W. A. Mueller, and J. Baehr, 2019: Forecast-Oriented Assessment of Decadal Hindcast Skill for North Atlantic SST. Geophysical Research Letters, 46, 11444-11454, doi:10.1029/2019gl084758.
- Borchert, L. F., A. Dusterhus, S. Brune, W. A. Muller, and J. Baehr, 2019: Forecast-Oriented Assessment of Decadal Hindcast Skill for North Atlantic SST. Geophysical Research Letters, 46, 11444-11454, doi:10.1029/2019gl084758.
- Bridgman, H., L. Ashcroft, K. Thornton, G. Di Gravio, and W. Oates, 2019: Meteorological observations for Eversleigh Station, near Armidale, New South Wales, Australia: 1877-1922. Geoscience Data Journal, 6, 174-188, doi:10.1002/gdj3.80.
- Bronnimann, S., and Coauthors, 2019: Unlocking Pre-1850 Instrumental Meteorological Records: A Global Inventory. Bulletin of the American Meteorological Society, 100, ES389-ES413, doi:10.1175/bams-d-19-0040.1.
- Bronnimann, S., and Coauthors, 2019: Last phase of the Little Ice Age forced by volcanic eruptions. Nature Geoscience, 12, 650-+, doi:10.1038/s41561-019-0402-y.
- Bronnimann, S., L. Frigerio, M. Schwander, M. Rohrer, P. Stucki, and J. Franke, 2019: Causes of increased flood frequency in central Europe in the 19th century. Climate of the Past, 15, 1395-1409, doi:10.5194/cp-15-1395-2019.
- Bronnimann, S., O. Martius, C. Rohr, D. N. Bresch, and K. H. E. Lin, 2019: Historical weather data for climate risk assessment. Annals of the New York Academy of Sciences, 1436, 121-137, doi:10.1111/nyas.13966.
- Bronnimann, S., and J. Wintzer, 2019: Climate data empathy. Wiley Interdisciplinary Reviews-Climate Change, 10, doi:10.1002/wcc.559.
- Bryan, S. P., K. A. Hughen, K. B. Karnauskas, and J. T. Farrar, 2019: Two Hundred Fifty Years of Reconstructed South Asian Summer Monsoon Intensity and Decadal-Scale Variability. Geophysical Research Letters, 46, 3927-3935, doi:10.1029/2018gl081593.
- Buckley, B. M., C. C. Ummenhofer, R. D. D'Arrigo, K. G. Hansen, L. H. Truong, C. N. Le, and D. K. Stahle, 2019: Interdecadal Pacific Oscillation reconstructed from trans-Pacific tree rings: 1350-2004 CE. Climate Dynamics, 53, 3181-3196, doi:10.1007/s00382-019-04694-4.
- Burgdorf, A. M., S. Bronnimann, and J. Franke, 2019: Two types of North American droughts related to different atmospheric circulation patterns. Climate of the Past, 15, 2053-2065, doi:10.5194/cp-15-2053-2019.
- Cagigal, L., and Coauthors, 2020: Historical and future storm surge around New Zealand: From the 19th century to the end of the 21st century. International Journal of Climatology, 40, 1512-1525, doi:10.1002/joc.6283.
- Cai, J. X., J. J. Xu, Z. Y. Guan, and A. M. Powell, 2019: Interdecadal variability of El Nino onset and its impact on monsoon systems over areas encircling the Pacific Ocean. Climate Dynamics, 52, 7173-7188, doi:10.1007/s00382-016-3377-z.
- Caillouet, L., J. P. Vidal, E. Sauquet, B. Graff, and J. M. Soubeyroux, 2019: SCOPE Climate: a 142-year daily high-resolution ensemble meteorological reconstruction dataset over France. Earth System Science Data, 11, 241-260, doi:10.5194/essd-11-241-2019.
- Camargo, S. J., and Coauthors, 2019: TROPICAL CYCLONE PREDICTION ON SUBSEASONAL TIME-SCALES. Tropical Cyclone Research and Review, 8, 150-165, doi:10.6057/2019tcrr03.04.
- Cao, D. D., Q. G. Wu, A. X. Hu, Y. H. Yao, S. Z. Liu, S. R. Schroeder, and F. C. Yang, 2019: Linear and nonlinear winter atmospheric responses to extreme phases of low frequency Pacific sea surface temperature variability. Climate Dynamics, 52, 49-68, doi:10.1007/s00382-018-4127-1.
- Castruccio, F. S., Y. Ruprich-Robert, S. G. Yeager, G. Danabasoglu, R. Msadek, and T. L. Delworth, 2019: Modulation of Arctic Sea Ice Loss by Atmospheric Teleconnections from Atlantic Multidecadal Variability. J. Clim., 32, 1419-1441, doi:10.1175/jcli-d-18-0307.1.
- Cauquoin, A., C. Risi, and E. Vignon, 2019: Importance of the advection scheme for the simulation of water isotopes over Antarctica by atmospheric general circulation models: A case study for present-day and Last Glacial Maximum with LMDZ-iso. Earth and Planetary Science Letters, 524, doi:10.1016/j.epsl.2019.115731.
- Cavanaugh, K. C., and Coauthors, 2019: Climate-driven regime shifts in a mangrove-salt marsh ecotone over the past 250 years. Proceedings of the National Academy of Sciences of the United States of America, 116, 21602-21608, doi:10.1073/pnas.1902181116.
- Centurioni, L. R., and Coauthors, 2019: Global in situ Observations of Essential Climate and Ocean Variables at the Air-Sea Interface. Frontiers in Marine Science, 6, doi:10.3389/fmars.2019.00419.
- Chafik, L., J. E. O. Nilsen, S. Dangendorf, G. Reverdin, and T. Frederikse, 2019: North Atlantic Ocean Circulation and Decadal Sea Level Change During the Altimetry Era. Scientific Reports, 9, doi:10.1038/s41598-018-37603-6.
- Champagne, O., M. A. Arain, and P. Coulibaly, 2019: Atmospheric circulation amplifies shift of winter streamflow in southern Ontario. Journal of Hydrology, 578, doi:10.1016/j.jhydrol.2019.124051.
- Champagne, O., B. Pohl, S. McKenzie, J. F. Buoncristiani, E. Bernard, D. Joly, and F. Tolle, 2019: Atmospheric circulation modulates the spatial variability of temperature in the Atlantic-Arctic region. International Journal of Climatology, 39, 3619-3638, doi:10.1002/joc.6044.
- Chan, D., E. C. Kent, D. I. Berry, and P. Huybers, 2019: Correcting datasets leads to more homogeneous early-twentieth-century sea surface warming. Nature, 571, 393-+, doi:10.1038/s41586-019-1349-2.
- Chang, K. Y., W. J. Riley, E. L. Brodie, C. K. McCalley, P. M. Crill, and R. F. Grant, 2019: Methane Production Pathway Regulated Proximally by Substrate Availability and Distally by Temperature in a High-Latitude Mire Complex. Journal of Geophysical Research-Biogeosciences, 124, 3057-3074, doi:10.1029/2019jg005355.
- Chang, K. Y., W. J. Riley, P. M. Crill, R. F. Grant, V. I. Rich, and S. R. Saleska, 2019: Large carbon cycle sensitivities to climate across a permafrost thaw gradient in subarctic Sweden. Cryosphere, 13, 647-663, doi:10.5194/tc-13-647-2019.
- Changnon, D., and V. A. Gensini, 2019: Changing Spatiotemporal Patterns of 5-and 10-Day Illinois Heavy Precipitation Amounts, 1900-2018. Journal of Applied Meteorology and Climatology, 58, 1523-1533, doi:10.1175/jamc-d-18-0335.1.
- Chatterjee, N., 2020: Soil erosion assessment in a humid, Eastern Himalayan watershed undergoing rapid land use changes, using RUSLE, GIS and high-resolution satellite imagery. Modeling Earth Systems and Environment, 6, 533-543, doi:10.1007/s40808-019-00700-0.
- Chen, Y. J., Y. T. Hwang, M. D. Zelinka, and C. Zhou, 2019: Distinct Patterns of Cloud Changes Associated with Decadal Variability and Their Contribution to Observed Cloud Cover Trends. J. Clim., 32, 7281-7301, doi:10.1175/jcli-d-18-0443.1. Cherenkova, E. A., and E. A. Dolgova, 2019: Multidecadal climate variability in the north of the Eastern European Plain and the tree-ring growth response. 25th International Symposium on Atmospheric and Ocean Optics: Atmospheric Physics, G. G. Matvienko, and O. A. Romanovskii, Eds.
- Chiodo, G., J. Oehrlein, L. M. Polvani, J. C. Fyfe, and A. K. Smith, 2019: Insignificant influence of the 11-year solar cycle on the North Atlantic Oscillation. Nature Geoscience, 12, 94-+, doi:10.1038/s41561-018-0293-3.
- Choudhary, A., A. P. Dimri, and H. Paeth, 2019: Added value of CORDEX-SA experiments in simulating summer monsoon precipitation over India. International Journal of Climatology, 39, 2156-2172, doi:10.1002/joc.5942.
- Chung, C. T. Y., S. B. Power, A. Sullivan, and F. Delage, 2019: The role of the South Pacific in modulating Tropical Pacific variability. Scientific Reports, 9, doi:10.1038/s41598-019-52805-2.
- Chung, E. S., A. Timmermann, B. J. Soden, K. J. Ha, L. Shi, and V. O. John, 2019: Reconciling opposing Walker circulation trends in observations and model projections. Nature Climate Change, 9, 405-+, doi:10.1038/s41558-019-0446-4.
- Churakov, M., C. J. Villabona-Arenas, M. U. G. Kraemer, H. Salje, and S. Cauchemez, 2019: Spatio-temporal dynamics of dengue in Brazil: Seasonal travelling waves and determinants of regional synchrony. Plos Neglected Tropical Diseases, 13, doi:10.1371/journal.pntd.0007012.
- Clark, L., and R. L. Fogt, 2019: Southern Hemisphere Pressure Relationships during the 20th Century-Implications for Climate Reconstructions and Model Evaluation. Geosciences, 9, doi:10.3390/geosciences9100413.
- Clifford, H. M., and Coauthors: A 2000 Year Saharan Dust Event Proxy Record from an Ice Core in the European Alps. Journal of Geophysical Research-Atmospheres, doi:10.1029/2019jd030725.
- Clifford, H. M., and Coauthors, 2019: A 2000 Year Saharan Dust Event Proxy Record from an Ice Core in the European Alps. Journal of Geophysical Research-Atmospheres, 124, 12882-12900, doi:10.1029/2019jd030725.
- Coburn, J. J., 2019: Assessing Wind Data from Reanalyses for the Upper Midwest. Journal of Applied Meteorology and Climatology, 58, 429-446, doi:10.1175/jamc-d-18-0164.1.
- Cordeira, J. M., J. Stock, M. D. Dettinger, A. M. Young, J. F. Kalansky, and F. M. Ralph, 2019: A 142-Year Climatology of Northern California Landslides and Atmospheric Rivers. Bulletin of the American Meteorological Society, 100, 1499-1509, doi:10.1175/bams-d-18-0158.1.
- Cronin, M. F., and Coauthors, 2019: Air-Sea Fluxes With a Focus on Heat and Momentum. Frontiers in Marine Science, 6, doi:10.3389/fmars.2019.00430.
- Cui, J. X., L. Wang, T. Li, and B. Wu, 2020: Can reanalysis products with only surface variables assimilated capture Madden-Julian oscillation characteristics? International Journal of Climatology, 40, 1279-1293, doi:10.1002/joc.6270.
- Dandi, R. A., J. S. Chowdary, P. A. Pillai, N. S. S. Sidhan, K. Koteswararao, and S. Ramakrishna, 2020: Impact of El Nino Modoki on Indian summer monsoon rainfall: Role of western north Pacific circulation in observations and CMIP5 models. International Journal of Climatology, 40, 2117-2133, doi:10.1002/joc.6322.
- Dangendorf, S., C. Hay, F. M. Calafat, M. Marcos, C. G. Piecuch, K. Berk, and J. Jensen, 2019: Persistent acceleration in global sea-level rise since the 1960s. Nature Climate Change, 9, 705-+, doi:10.1038/s41558-019-0531-8.
- de Lima, I. P., and S. Lovejoy, 2019: Analysis of fluctuations in precipitation in macrotime. Ribagua-Revista Iberoamericana Del Agua, 6, 101-110, doi:10.1080/23863781.2019.1642602.
- De Luca, P., C. Harpham, R. L. Wilby, J. K. Hillier, C. L. E. Franzke, and G. C. Leckebusch, 2019: Past and Projected Weather Pattern Persistence with Associated Multi-Hazards in the British Isles. Atmosphere, 10, doi:10.3390/atmos10100577.
- Delaygue, G., S. Bronnimann, P. D. Jones, J. Blanchet, and M. Schwander, 2019: Reconstruction of Lamb weather type series back to the eighteenth century. Climate Dynamics, 52, 6131-6148, doi:10.1007/s00382-018-4506-7.
- Devers, A., J. P. Vidal, C. Lauvernet, B. Graff, and O. Vannier, 2020: A framework for high-resolution meteorological surface reanalysis through offline data assimilation in an ensemble of downscaled reconstructions. Quarterly Journal of the Royal Meteorological Society, 146, 153-173, doi:10.1002/qj.3663.
- Dieppois, B., and Coauthors, 2019: Southern African summer-rainfall variability, and its teleconnections, on interannual to interdecadal timescales in CMIP5 models. Climate Dynamics, 53, 3505-3527, doi:10.1007/s00382-019-04720-5.
- Dimri, A. P., 2019: Comparison of regional and seasonal changes and trends in daily surface temperature extremes over India and its subregions. Theoretical and Applied Climatology, 136, 265-286, doi:10.1007/s00704-018-2486-5.
- Dinis, L., C. Begin, M. M. Savard, J. Marion, P. Brigode, and C. Alvarez, 2019: Tree-ring stable isotopes for regional discharge reconstruction in eastern Labrador and teleconnection with the Arctic Oscillation. Climate Dynamics, 53, 3625-3640, doi:10.1007/s00382-019-04731-2.
- Domeisen, D. I. V., 2019: Estimating the Frequency of Sudden Stratospheric Warming Events From Surface Observations of the North Atlantic Oscillation. Journal of Geophysical Research-Atmospheres, 124, 3180-3194, doi:10.1029/2018jd030077.
- Douville, H., A. Ribes, and S. Tyteca, 2019: Breakdown of NAO reproducibility into internal versus externally-forced components: a two-tier pilot study. Climate Dynamics, 52, 29-48, doi:10.1007/s00382-018-4141-3.
- Driver, P., B. Abiodun, and C. J. C. Reason, 2019: Modelling the precipitation response over southern Africa to the 2009-2010 El Nino using a stretched grid global atmospheric model. Climate Dynamics, 52, 3929-3949, doi:10.1007/s00382-018-4362-5.
- Duan, J., Y. L. Li, F. Wang, and Z. H. Chen, 2019: Decadal Variations of the Mindanao Current During 1960-2010. Journal of Geophysical Research-Oceans, 124, 2660-2678, doi:10.1029/2019jc014975.
- Etourneau, J., and Coauthors, 2019: Ocean temperature impact on ice shelf extent in the eastern Antarctic Peninsula. Nature Communications, 10, doi:10.1038/s41467-018-08195-6. Evgeniev, R., and K. Malcheva, 2019: Long-Term Air Temperature Variations in Some Urban Areas of Sofia Valley in the Context of Climate Change. 10th Jubilee Conference of the Balkan Physical Union, T. M. Mishonov, and A. M. Varonov, Eds.
- Fang, M., and X. Li, 2019: An Artificial Neural Networks-Based Tree Ring Width Proxy System Model for Paleoclimate Data Assimilation. Journal of Advances in Modeling Earth Systems, 11, 892-904, doi:10.1029/2018ms001525.
- Faranda, D., M. C. Alvarez-Castro, G. Messori, D. Rodrigues, and P. Yiou, 2019: The hammam effect or how a warm ocean enhances large scale atmospheric predictability. Nature Communications, 10, doi:10.1038/s41467-019-09305-8.
- Feng, J., J. P. Li, J. L. Zhu, Y. Li, and F. Li, 2019: The contrasting response of Hadley circulation to different meridional structure of sea surface temperature in CMIP5. Theoretical and Applied Climatology, 135, 633-647, doi:10.1007/s00704-018-2393-9.
- Foley, A. M., 2019: Long-term trends in large-scale circulation behaviour and wind storms for North Atlantic islands: a multi-data analysis using ERA-20C and meteorological station data. Climatic Change, 155, 323-338, doi:10.1007/s10584-019-02467-w.
- Freeman, E., and Coauthors, 2019: The International Comprehensive Ocean-Atmosphere Data Set - Meeting Users Needs and Future Priorities. Frontiers in Marine Science, 6, doi:10.3389/fmars.2019.00435.
- Gampe, D., J. Schmid, and R. Ludwig, 2019: Impact of Reference Dataset Selection on RCM Evaluation, Bias Correction, and Resulting Climate Change Signals of Precipitation. Journal of Hydrometeorology, 20, 1813-1828, doi:10.1175/jhm-d-18-0108.1.
- Gao, M. N., J. Yang, D. Y. Gong, P. J. Shi, Z. G. Han, and S. J. Kim, 2019: Footprints of Atlantic Multidecadal Oscillation in the Low-Frequency Variation of Extreme High Temperature in the Northern Hemisphere. J. Clim., 32, 791-802, doi:10.1175/jcli-d-18-0446.1.
- Geng, T., W. J. Cai, L. X. Wu, and Y. Yang, 2019: Atmospheric Convection Dominates Genesis of ENSO Asymmetry. Geophysical Research Letters, 46, 8387-8396, doi:10.1029/2019gl083213.
- Geng, T., Y. Yang, and L. X. Wu, 2019: On the Mechanisms of Pacific Decadal Oscillation Modulation in a Warming Climate. J. Clim., 32, 1443-1459, doi:10.1175/jcli-d-18-0337.1.
- Ghiggi, G., V. Humphrey, S. I. Seneviratne, and L. Gudmundsson, 2019: GRUN: an observation-based global gridded runoff dataset from 1902 to 2014. Earth System Science Data, 11, 1655-1674, doi:10.5194/essd-11-1655-2019.
- Ghosh, R., W. A. Muller, A. Eichhorn, J. Baehr, and J. Bader, 2019: Atmospheric pathway between Atlantic multidecadal variability and European summer temperature in the atmospheric general circulation model ECHAM6. Climate Dynamics, 53, 209-224, doi:10.1007/s00382-018-4578-4.
- Gil-Guirado, S., and A. Perez-Morales, 2019: Climatic variability and temperature and rainfall patterns in Murcia (1863-2017). Climate analysis techniques in the context of global change. Investigaciones Geograficas-Spain, 27-54, doi:10.14198/ingeo2019.71.02.
- Gomez-Delgado, F. D., D. Gallego, C. Pena-Ortiz, I. Vega, P. Ribera, and R. Garcia-Herrera, 2019: Long term variability of the northerly winds over the Eastern Mediterranean as seen from historical wind observations. Global and Planetary Change, 172, 355-364, doi:10.1016/j.gloplacha.2018.10.008.
- Graf, M., S. C. Scherrer, C. Schwierz, M. Begert, O. Martius, C. C. Raible, and S. Bronnimann, 2019: Near-surface mean wind in Switzerland: Climatology, climate model evaluation and future scenarios. International Journal of Climatology, 39, 4798-4810, doi:10.1002/joc.6108.
- Graham, E., and J. D. C. Webb, 2019: The very deep cold pool of 27 February-1 March 2018-historical precedents and perspective. Weather, 74, 85-91, doi:10.1002/wea.3471.
- Grossiord, C., and Coauthors, 2019: Precipitation mediates sap flux sensitivity to evaporative demand in the neotropics. Oecologia, 191, 519-530, doi:10.1007/s00442-019-04513-x.
- Gudlaugsdottir, H., J. Sjolte, A. E. Sveinbjornsdottir, M. Werner, and H. C. Steen-Larsen, 2019: North Atlantic weather regimes in delta O-18 of winter precipitation: isotopic fingerprint of the response in the atmospheric circulation after volcanic eruptions. Tellus Series B-Chemical and Physical Meteorology, 71, doi:10.1080/16000889.2019.1633848.
- Guo, R. X., C. Deser, L. Terray, and F. Lehner, 2019: Human Influence on Winter Precipitation Trends (1921-2015) over North America and Eurasia Revealed by Dynamical Adjustment. Geophysical Research Letters, 46, 3426-3434, doi:10.1029/2018gl081316.
- Harrington, L. J., F. E. L. Otto, T. Cowan, and G. C. Hegerl, 2019: Circulation analogues and uncertainty in the time-evolution of extreme event probabilities: evidence from the 1947 Central European heatwave. Climate Dynamics, 53, 2229-2247, doi:10.1007/s00382-019-04820-2.
- Hartten, L. M., P. E. Johnston, V. M. R. Castro, and P. S. E. Perez, 2019: Postdeployment Calibration of a Tropical UHF Profiling Radar via Surface- and Satellite-Based Methods. Journal of Atmospheric and Oceanic Technology, 36, 1729-1751, doi:10.1175/jtech-d-18-0020.1.
- Harvey, T., J. A. Renwick, A. M. Lorrey, and A. Ngari, 2019: The Representation of the South Pacific Convergence Zone in the Twentieth Century Reanalysis. Monthly Weather Review, 147, 841-851, doi:10.1175/mwr-d-18-0237.1.
- Haslinger, K., M. Hofstatter, C. Kroisleitner, W. Schoner, G. Laaha, F. Holawe, and G. Bloschl: Disentangling Drivers of Meteorological Droughts in the European Greater Alpine Region During the Last Two Centuries. Journal of Geophysical Research-Atmospheres, doi:10.1029/2018jd029527.
- Haslinger, K., M. Hofstatter, C. Kroisleitner, W. Schoner, G. Laaha, F. Holawe, and G. Bloschl, 2019: Disentangling Drivers of Meteorological Droughts in the European Greater Alpine Region During the Last Two Centuries. Journal of Geophysical Research-Atmospheres, 124, 12404-12425, doi:10.1029/2018jd029527.
- Hawkins, E., S. Burt, P. Brohan, M. Lockwood, H. Richardson, M. Roy, and S. Thomas, 2019: Hourly weather observations from the Scottish Highlands (1883-1904) rescued by volunteer citizen scientists. Geoscience Data Journal, 6, 160-173, doi:10.1002/gdj3.79.
- Hawkins, E., S. Burt, P. Brohan, M. Lockwood, H. Richardson, M. Roy, and S. Thomas, 2019: Hourly weather observations from the Scottish Highlands (1883-1904) rescued by volunteer citizen scientists. Geoscience Data Journal, 6, 160-173, doi:10.1002/gdj3.79.
- He, J., and Coauthors, 2019: Development and Evaluation of an Ensemble-Based Data Assimilation System for Regional Reanalysis Over the Tibetan Plateau and Surrounding Regions. Journal of Advances in Modeling Earth Systems, 11, 2503-2522, doi:10.1029/2019ms001665.
- Hegerl, G. C., and Coauthors, 2019: Causes of climate change over the historical record. Environmental Research Letters, 14, doi:10.1088/1748-9326/ab4557.
- Hendry, A., and Coauthors, 2019: Assessing the characteristics and drivers of compound flooding events around the UK coast. Hydrology and Earth System Sciences, 23, 3117-3139, doi:10.5194/hess-23-3117-2019.
- Henneman, L. R. F., C. Choirat, C. Ivey, K. Cummiskey, and C. M. Zigler, 2019: Characterizing population exposure to coal emissions sources in the United States using the HyADS model. Atmospheric Environment, 203, 271-280, doi:10.1016/j.atmosenv.2019.01.043.
- Henneman, L. R. F., L. J. Mickley, and C. M. Zigler, 2019: Air pollution accountability of energy transitions: the relative importance of point source emissions and wind fields in exposure changes. Environmental Research Letters, 14, doi:10.1088/1748-9326/ab4861.
- Hidalgo, P., and D. Gallego, 2019: A historical climatology of the easterly winds in the strait of Gibraltar. Atmosfera, 32, 181-195, doi:10.20937/atm.2019.32.03.02.
- Hinrichs, I., and Coauthors, 2019: The Baltic and North Seas Climatology (BNSC) - A Comprehensive, Observation-Based Data Product of Atmospheric and Hydrographic Parameters. Frontiers in Earth Science, 7, doi:10.3389/feart.2019.00158.
- Hitchcock, P., 2019: On the value of reanalyses prior to 1979 for dynamical studies of stratosphere-troposphere coupling. Atmospheric Chemistry and Physics, 19, 2749-2764, doi:10.5194/acp-19-2749-2019.
- Horton, P., and S. Bronnimann, 2019: Impact of global atmospheric reanalyses on statistical precipitation downscaling. Climate Dynamics, 52, 5189-5211, doi:10.1007/s00382-018-4442-6.
- Howard, I. M., D. W. Stahle, and S. Feng, 2019: Separate tree-ring reconstructions of spring and summer moisture in the northern and southern Great Plains. Climate Dynamics, 52, 5877-5897, doi:10.1007/s00382-018-4485-8.
- Hua, T., E. Zorita, X. M. Wang, N. L. Wang, and C. X. Zhang, 2019: Precipitation variability in the north fringe of East Asian Summer Monsoon during the past millennium and its possible driving factors. Climate Dynamics, 53, 2587-2602, doi:10.1007/s00382-019-04643-1.
- Hua, W. J., L. M. Zhou, S. E. Nicholson, H. S. Chen, and M. H. Qin, 2019: Assessing reanalysis data for understanding rainfall climatology and variability over Central Equatorial Africa. Climate Dynamics, 53, 651-669, doi:10.1007/s00382-018-04604-0.
- Huai, B. J., Y. T. Wang, M. H. Ding, J. L. Zhang, and X. Dong, 2019: An assessment of recent global atmospheric reanalyses for Antarctic near surface air temperature. Atmospheric Research, 226, 181-191, doi:10.1016/j.atmosres.2019.04.029.
- Huang, D. Q., A. Dai, B. Yang, P. W. Yan, J. Zhu, and Y. C. Zhang, 2019: Contributions of Different Combinations of the IPO and AMO to Recent Changes in Winter East Asian Jets. J. Clim., 32, 1607-1626, doi:10.1175/jcli-d-18-0218.1.
- Huang, R. P., S. F. Chen, W. Chen, P. Hu, and B. Yu, 2019: Recent Strengthening of the Regional Hadley Circulation over the Western Pacific during Boreal Spring. Advances in Atmospheric Sciences, 36, 1251-1264, doi:10.1007/s00376-019-9004-2.
- Huang, X., T. J. Zhou, W. X. Zhang, J. Jiang, P. X. Li, and Y. Zhao, 2019: Northern Hemisphere land monsoon precipitation changes in the twentieth century revealed by multiple reanalysis datasets. Climate Dynamics, 53, 7131-7149, doi:10.1007/s00382-019-04982-z.
- Huang, Y., T. Li, and B. Wu, 2019: Why SST trend in North Pacific is peculiarly negative against warming trend elsewhere since 1958. Climate Dynamics, 52, 4447-4461, doi:10.1007/s00382-018-4389-7.
- Huang, Y., B. Wu, T. Li, T. J. Zhou, and B. Liu, 2019: Interdecadal Indian Ocean Basin Mode Driven by Interdecadal Pacific Oscillation: A Season-Dependent Growth Mechanism. J. Clim., 32, 2057-2073, doi:10.1175/jcli-d-18-0452.1.
- Hudson, A. R., R. Alfaro-Sanchez, F. Babst, S. Belmecheri, D. J. P. Moore, and V. Trouet, 2019: Seasonal and synoptic climatic drivers of tree growth in the Bighorn Mountains, WY, USA (1654-1983 CE). Dendrochronologia, 58, doi:10.1016/j.dendro.2019.125633.
- Humphrey, V., and L. Gudmundsson, 2019: GRACE-REC: a reconstruction of climate-driven water storage changes over the last century. Earth System Science Data, 11, 1153-1170, doi:10.5194/essd-11-1153-2019.
- Hwang, S. O., J. Park, and H. M. Kim, 2019: Effect of hydrometeor species on very-short-range simulations of precipitation using ERAS. Atmospheric Research, 218, 245-256, doi:10.1016/j.atmosres.2018.12.008.
- Imfeld, N., and Coauthors, 2019: Summertime precipitation deficits in the southern Peruvian highlands since 1964. International Journal of Climatology, 39, 4497-4513, doi:10.1002/joc.6087.
- Ito, T., M. C. Long, C. Deutsch, S. Minobe, and D. X. Sun, 2019: Mechanisms of Low-Frequency Oxygen Variability in the North Pacific. Global Biogeochemical Cycles, 33, 110-124, doi:10.1029/2018gb005987.
- Izumo, T., M. Lengaigne, J. Vialard, I. Suresh, and Y. Planton, 2019: On the physical interpretation of the lead relation between Warm Water Volume and the El Nino Southern Oscillation. Climate Dynamics, 52, 2923-2942, doi:10.1007/s00382-018-4313-1.
- Jiang, J., and T. J. Zhou, 2019: Global Monsoon Responses to Decadal Sea Surface Temperature Variations during the Twentieth Century: Evidence from AGCM Simulations. J. Clim., 32, 7675-7695, doi:10.1175/jcli-d-18-0890.1.
- Jin, C. H., B. Wang, J. Liu, L. Ning, and M. Yan, 2019: Decadal variability of northern Asian winter monsoon shaped by the 11-year solar cycle. Climate Dynamics, 53, 6559-6568, doi:10.1007/s00382-019-04945-4.
- Joshi, M. K., and K. J. Ha, 2019: Fidelity of CMIP5-simulated teleconnection between Atlantic multidecadal oscillation and Indian summer monsoon rainfall. Climate Dynamics, 52, 4157-4176, doi:10.1007/s00382-018-4376-z.
- Joyce, T. M., Y. O. Kwon, H. Seo, and C. C. Ummenhofer, 2019: Meridional Gulf Stream Shifts Can Influence Wintertime Variability in the North Atlantic Storm Track and Greenland Blocking. Geophysical Research Letters, 46, 1702-1708, doi:10.1029/2018gl081087.
- Kamarainen, M., P. Uotila, A. Y. Karpechko, O. Hyvarinen, I. Lehtonen, and J. Raisanen, 2019: Statistical Learning Methods as a Basis for Skillful Seasonal Temperature Forecasts in Europe. J. Clim., 32, 5363-5379, doi:10.1175/jcli-d-18-0765.1.
- Karmalkar, A. V., D. M. H. Sexton, J. M. Murphy, B. B. Booth, J. W. Rostron, and D. J. McNeall, 2019: Finding plausible and diverse variants of a climate model. Part II: development and validation of methodology. Climate Dynamics, 53, 847-877, doi:10.1007/s00382-019-04617-3.
- Kayano, M. T., R. V. Andreoli, and R. A. F. de Souza, 2019: El Nino-Southern Oscillation related teleconnections over South America under distinct Atlantic Multidecadal Oscillation and Pacific Interdecadal Oscillation backgrounds: La Nina. International Journal of Climatology, 39, 1359-1372, doi:10.1002/joc.5886.
- Kayano, M. T., R. V. Andreoli, and R. A. F. de Souza, 2020: Pacific and Atlantic multidecadal variability relations to the El Nino events and their effects on the South American rainfall. International Journal of Climatology, 40, 2183-2200, doi:10.1002/joc.6326.
- Kelemen, F. D., C. Primo, H. Feldmann, and B. Ahrens, 2019: Added Value of Atmosphere-Ocean Coupling in a Century-Long Regional Climate Simulation. Atmosphere, 10, doi:10.3390/atmos10090537.
- Kelley, J. D., D. M. Schultz, R. S. Schumacher, and D. R. Durran, 2019: Can Mountain Waves Contribute to Damaging Winds Far Away from the Lee Slope? Weather Forecast, 34, 2045-2065, doi:10.1175/waf-d-18-0207.1.
- Kennedy, A., A. Trellinger, T. Grafenauer, and G. Gust, 2019: A Climatology of Atmospheric Patterns Associated with Red River Valley Blizzards. Climate, 7, doi:10.3390/cli7050066.
- Kennedy, J. J., N. A. Rayner, C. P. Atkinson, and R. E. Killick, 2019: An Ensemble Data Set of Sea Surface Temperature Change From 1850: The Met Office Hadley Centre HadSST.4.0.0.0 Data Set. Journal of Geophysical Research-Atmospheres, 124, 7719-7763, doi:10.1029/2018jd029867.
- Kikuchi, K., 2020: Extension of the bimodal intraseasonal oscillation index using JRA-55 reanalysis. Climate Dynamics, 54, 919-933, doi:10.1007/s00382-019-05037-z.
- Kim, D. I., and D. W. Han, 2019: Comparative study on long term climate data sources over South Korea. Journal of Water and Climate Change, 10, 504-523, doi:10.2166/wcc.2018.032.
- Kim, D. I., and D. W. Han, 2019: Evaluation of ERA-20cm reanalysis dataset over South Korea. Journal of Hydro-Environment Research, 23, 10-24, doi:10.1016/j.jher.2019.01.004.
- Kim, D. I., H. H. Kwon, and D. W. Han, 2019: Bias correction of daily precipitation over South Korea from the long-term reanalysis using a composite Gamma-Pareto distribution approach. Hydrology Research, 50, 1138-1161, doi:10.2166/nh.2019.127.
- King, A. D., A. H. Butler, M. Jucker, N. O. Earl, and I. Rudeva, 2019: Observed Relationships Between Sudden Stratospheric Warmings and European Climate Extremes. Journal of Geophysical Research-Atmospheres, 124, 13943-13961, doi:10.1029/2019jd030480.
- King, A. T., and A. D. Kennedy, 2019: North American Supercell Environments in Atmospheric Reanalyses and RUC-2. Journal of Applied Meteorology and Climatology, 58, 71-92, doi:10.1175/jamc-d-18-0015.1.
- Klotzbach, P., S. Abhik, H. H. Hendon, M. Bell, C. Lucas, A. G. Marshall, and E. C. J. Oliver, 2019: On the emerging relationship between the stratospheric Quasi-Biennial oscillation and the Madden-Julian oscillation. Scientific Reports, 9, doi:10.1038/s41598-019-40034-6.
- Knighton, J., G. Pleiss, E. Carter, S. Lyon, M. T. Walter, and S. Steinschneider, 2019: Potential Predictability of Regional Precipitation and Discharge Extremes Using Synoptic-Scale Climate Information via Machine Learning: An Evaluation for the Eastern Continental United States. Journal of Hydrometeorology, 20, 883-900, doi:10.1175/jhm-d-18-0196.1.
- Kolstad, E. W., and J. A. Screen, 2019: Nonstationary Relationship Between Autumn Arctic Sea Ice and the Winter North Atlantic Oscillation. Geophysical Research Letters, 46, 7583-7591, doi:10.1029/2019gl083059.
- Krakauer, N. Y., T. Lakhankar, and G. H. Dars, 2019: Precipitation Trends over the Indus Basin. Climate, 7, doi:10.3390/cli7100116.
- Krueger, O., F. Feser, and R. Weisse, 2019: Northeast Atlantic Storm Activity and Its Uncertainty from the Late Nineteenth to the Twenty-First Century. J. Clim., 32, 1919-1931, doi:10.1175/jcli-d-18-0505.1.
- L?bbecke, J. F., D. Rudloff, and L. Stramma, 2019: Stand-Alone Eastern Pacific Coastal Warming Events. Geophysical Research Letters, 46, 12360-12367, doi:10.1029/2019gl084479.
- Labbe, T., C. Pfister, S. Bronnimann, D. Rousseau, J. Franke, and B. Bois, 2019: The longest homogeneous series of grape harvest dates, Beaune 1354-2018. and its significance for the understanding of past and present climate. Climate of the Past, 15, 1485-1501, doi:10.5194/cp-15-1485-2019.
- Lague, M. M., G. B. Bonan, and A. L. S. Swann, 2019: Separating the Impact of Individual Land Surface Properties on the Terrestrial Surface Energy Budget in both the Coupled and Uncoupled Land-Atmosphere System. J. Clim., 32, 5725-5744, doi:10.1175/jcli-d-18-0812.1.
- Lawal, K. A., B. J. Abiodun, D. A. Stone, E. Olaniyan, and M. F. Wehner, 2019: Capability of CAM5.1 in simulating maximum air temperature patterns over West Africa during boreal spring. Modeling Earth Systems and Environment, 5, 1815-1838, doi:10.1007/s40808-019-00639-2.
- Lawrence, D. M., and Coauthors, 2019: The Community Land Model Version 5: Description of New Features, Benchmarking, and Impact of Forcing Uncertainty. Journal of Advances in Modeling Earth Systems, 11, 4245-4287, doi:10.1029/2018ms001583.
- Lee, J., K. R. Sperber, P. J. Gleckler, C. J. W. Bonfils, and K. E. Taylor, 2019: Quantifying the agreement between observed and simulated extratropical modes of interannual variability. Climate Dynamics, 52, 4057-4089, doi:10.1007/s00382-018-4355-4.
- Levizzani, V., and E. Cattani, 2019: Satellite Remote Sensing of Precipitation and the Terrestrial Water Cycle in a Changing Climate. Remote Sensing, 11, doi:10.3390/rs11192301.
- Li, J., R. Q. Ding, Z. W. Wu, Q. J. Zhong, B. S. Li, and J. P. Li, 2019: Inter-decadal change in potential predictability of the East Asian summer monsoon. Theoretical and Applied Climatology, 136, 403-415, doi:10.1007/s00704-018-2482-9.
- Li, Q., T. Yang, F. Y. Zhang, Z. M. Qi, and L. H. Li, 2019: Snow depth reconstruction over last century: Trend and distribution in the Tianshan Mountains, China. Global and Planetary Change, 173, 73-82, doi:10.1016/j.gloplacha.2018.12.008.
- Li, S. H., and Coauthors, 2019: Reducing climate model biases by exploring parameter space with large ensembles of climate model simulations and statistical emulation. Geoscientific Model Development, 12, 3017-3043, doi:10.5194/gmd-12-3017-2019.
- Li, Y., and Coauthors, 2019: Long-Term Trend of the Tropical Pacific Trade Winds Under Global Warming and Its Causes. Journal of Geophysical Research-Oceans, 124, 2626-2640, doi:10.1029/2018jc014603.
- Lima, L. N., L. P. Pezzi, S. G. Penny, and C. A. S. Tanajura, 2019: An Investigation of Ocean Model Uncertainties Through Ensemble Forecast Experiments in the Southwest Atlantic Ocean. Journal of Geophysical Research-Oceans, 124, 432-452, doi:10.1029/2018jc013919.
- Lin, J. L., and T. T. Qian, 2019: Switch Between El Nino and La Nina is Caused by Subsurface Ocean Waves Likely Driven by Lunar Tidal Forcing. Scientific Reports, 9, doi:10.1038/s41598-019-49678-w.
- Liu, J. P., H. L. Ren, W. J. Li, and J. Q. Zuo, 2019: Diagnosing the leading mode of interdecadal covariability between the Indian Ocean sea surface temperature and summer precipitation in southern China. Theoretical and Applied Climatology, 135, 1295-1306, doi:10.1007/s00704-018-2430-8.
- Liu, Y., C. X. Fang, Q. Li, H. M. Song, W. Y. Ta, G. J. Zhao, and C. F. Sun, 2019: Tree-ring delta O-18 based PDSI reconstruction in the Mt. Tianmu region since 1618 AD and its connection to the East Asian summer monsoon. Ecological Indicators, 104, 636-647, doi:10.1016/j.ecolind.2019.05.043.
- Liu, Y. Z., T. B. Shao, S. Hua, Q. Z. Zhu, and R. Luo: Association of anthropogenic aerosols with subtropical drought in East Asia. International Journal of Climatology, doi:10.1002/joc.6410.
- Loughran, T. F., A. J. Pitman, and S. E. Perkins-Kirkpatrick, 2019: The El Nino-Southern Oscillation's effect on summer heatwave development mechanisms in Australia. Climate Dynamics, 52, 6279-6300, doi:10.1007/s00382-018-4511-x.
- Lucio-Eceiza, E. E., J. F. Gonzalez-Rouco, E. Garcia-Bustamante, J. Navarro, and H. Beltrami, 2019: Multidecadal to centennial surface wintertime wind variability over Northeastern North America via statistical downscaling. Climate Dynamics, 53, 41-66, doi:10.1007/s00382-018-4569-5.
- Luo, M., J. M. Feng, Z. F. Xu, Y. L. Wang, and L. Dan, 2019: Evaluating the performance of five twentieth-century reanalysis datasets in reproducing the severe drought in northern China during the 1920s-1930s. Theoretical and Applied Climatology, 137, 187-199, doi:10.1007/s00704-018-2591-5.
- Magee, A. D., and D. C. Verdon-Kidd, 2019: Historical Variability of Southwest Pacific Tropical Cyclone Counts Since 1855. Geophysical Research Letters, 46, 6936-6945, doi:10.1029/2019gl082900.
- Mao, G. Q., and J. G. Liu, 2019: WAYS v1: a hydrological model for root zone water storage simulation on a global scale. Geoscientific Model Development, 12, 5267-5289, doi:10.5194/gmd-12-5267-2019.
- McCabe, G. J., and D. M. Wolock, 2019: Hydroclimatology of the Mississippi River Basin. Journal of the American Water Resources Association, 55, 1053-1064, doi:10.1111/1752-1688.12749.
- Medvedev, I., and E. Kulikov, 2019: Low-Frequency Baltic Sea Level Spectrum. Frontiers in Earth Science, 7, doi:10.3389/feart.2019.00284.
- Mellado-Cano, J., D. Barriopedro, R. Garcia-Herrera, and R. M. Trigo, 2020: New observational insights into the atmospheric circulation over the Euro-Atlantic sector since 1685. Climate Dynamics, 54, 823-841, doi:10.1007/s00382-019-05029-z.
- Menard, C. B., and Coauthors, 2019: Meteorological and evaluation datasets for snow modelling at 10 reference sites: description of in situ and bias-corrected reanalysis data. Earth System Science Data, 11, 865-880, doi:10.5194/essd-11-865-2019.
- Menezes, V. V., and M. L. Vianna, 2019: Quasi-biennial Rossby and Kelvin waves in the South Indian Ocean: Tropical and subtropical modes and the Indian Ocean Dipole. Deep-Sea Research Part Ii-Topical Studies in Oceanography, 166, 43-63, doi:10.1016/j.dsr2.2019.05.002.
- Meng, X. Y., X. S. Zhang, M. X. Yang, H. Wang, J. Chen, Z. H. Pan, and Y. P. Wu, 2019: Application and Evaluation of the China Meteorological Assimilation Driving Datasets for the SWAT Model (CMADS) in Poorly Gauged Regions in Western China. Water, 11, doi:10.3390/w11102171.
- Messori, G., P. Davini, M. C. Alvarez-Castro, F. S. R. Pausata, P. Yiou, and R. Caballero, 2019: On the low-frequency variability of wintertime Euro-Atlantic planetary wave-breaking. Climate Dynamics, 52, 2431-2450, doi:10.1007/s00382-018-4373-2.
- Miller, D. K., C. F. Miniat, R. M. Wooten, and A. P. Barros, 2019: An Expanded Investigation of Atmospheric Rivers in the Southern Appalachian Mountains and Their Connection to Landslides. Atmosphere, 10, doi:10.3390/atmos10020071.
- Mittaz, J., C. J. Merchant, and E. R. Woolliams, 2019: Applying principles of metrology to historical Earth observations from satellites. Metrologia, 56, doi:10.1088/1681-7575/ab1705.
- Muller, C., and Coauthors, 2019: The Global Gridded Crop Model Intercomparison phase 1 simulation dataset. Scientific Data, 6, doi:10.1038/s41597-019-0023-8.
- Nagavciuc, V., M. Ionita, A. Persoiu, I. Popa, N. J. Loader, and D. McCarroll, 2019: Stable oxygen isotopes in Romanian oak tree rings record summer droughts and associated large-scale circulation patterns over Europe. Climate Dynamics, 52, 6557-6568, doi:10.1007/s00382-018-4530-7.
- Nagavciuc, V., Z. Kern, M. Ionita, C. Hartl, O. Konter, J. Esper, and I. Popa, 2020: Climate signals in carbon and oxygen isotope ratios of Pinus cembra tree-ring cellulose from the Calimani Mountains, Romania. International Journal of Climatology, 40, 2539-2556, doi:10.1002/joc.6349.
- Nikiel, C. A., and E. A. B. Eltahir, 2019: Summer Climate Change in the Midwest and Great Plains due to Agricultural Development during the Twentieth Century. J. Clim., 32, 5583-5599, doi:10.1175/jcli-d-19-0096.1.
- Nogueira, M., 2019: The multi-scale structure of atmospheric energetic constraints on globally averaged precipitation. Earth System Dynamics, 10, 219-232, doi:10.5194/esd-10-219-2019.
- Nogueira, M., 2019: The sensitivity of the atmospheric branch of the global water cycle to temperature fluctuations at synoptic to decadal time-scales in different satellite- and model-based products. Climate Dynamics, 52, 617-636, doi:10.1007/s00382-018-4153-z.
- O'Brien, J. P., T. A. O'Brien, C. M. Patricola, and S. Y. S. Wang, 2019: Metrics for understanding large-scale controls of multivariate temperature and precipitation variability. Climate Dynamics, 53, 3805-3823, doi:10.1007/s00382-019-04749-6.
- O'Reilly, C. H., T. Woollings, L. Zanna, and A. Weisheimer, 2019: An Interdecadal Shift of the Extratropical Teleconnection From the Tropical Pacific During Boreal Summer. Geophysical Research Letters, 46, 13379-13388, doi:10.1029/2019gl084079.
- Okazaki, A., and K. Yoshimura, 2019: Global Evaluation of Proxy System Models for Stable Water Isotopes With Realistic Atmospheric Forcing. Journal of Geophysical Research-Atmospheres, 124, 8972-8993, doi:10.1029/2018jd029463.
- Paeth, H., J. M. Li, F. Pollinger, W. A. Muller, H. Pohlmann, H. Feldmann, and H. J. Panitz, 2019: An effective drift correction for dynamical downscaling of decadal global climate predictions. Climate Dynamics, 52, 1343-1357, doi:10.1007/s00382-018-4195-2.
- Park, J. H., and T. Li, 2019: Interdecadal modulation of El Nino-tropical North Atlantic teleconnection by the Atlantic multi-decadal oscillation. Climate Dynamics, 52, 5345-5360, doi:10.1007/s00382-018-4452-4.
- Parker, T., T. Woollings, A. Weisheimer, C. O'Reilly, L. Baker, and L. Shaffrey, 2019: Seasonal Predictability of the Winter North Atlantic Oscillation From a Jet Stream Perspective. Geophysical Research Letters, 46, 10159-10167, doi:10.1029/2019gl084402.
- Parsons, L. A., and S. Coats, 2019: Ocean-Atmosphere Trajectories of Extended Drought in Southwestern North America. Journal of Geophysical Research-Atmospheres, 124, 8953-8971, doi:10.1029/2019jd030424.
- Parsons, L. A., and G. J. Hakim, 2019: Local Regions Associated With Interdecadal Global Temperature Variability in the Last Millennium Reanalysis and CMIP5 Models. Journal of Geophysical Research-Atmospheres, 124, 9905-9917, doi:10.1029/2019jd030426.
- Penny, S. G., and Coauthors, 2019: Observational Needs for Improving Ocean and Coupled Reanalysis, S2S Prediction, and Decadal Prediction. Frontiers in Marine Science, 6, doi:10.3389/fmars.2019.00391.
- Pepler, A., A. Dowdy, and P. Hope, 2019: A global climatology of surface anticyclones, their variability, associated drivers and long-term trends. Climate Dynamics, 52, 5397-5412, doi:10.1007/s00382-018-4451-5.
- Pepler, A., P. Hope, and A. Dowdy, 2019: Long-term changes in southern Australian anticyclones and their impacts. Climate Dynamics, 53, 4701-4714, doi:10.1007/s00382-019-04819-9.
- Pfister, L., and Coauthors, 2019: Early instrumental meteorological measurements in Switzerland. Climate of the Past, 15, 1345-1361, doi:10.5194/cp-15-1345-2019.
- Picas, J., S. Grab, and R. Allan, 2019: A 19th century daily surface pressure series for the Southwestern Cape region of South Africa: 1834-1899. International Journal of Climatology, 39, 1404-1414, doi:10.1002/joc.5890.
- Piecuch, C. G., F. M. Calafat, S. Dangendorf, and G. Jord, 2019: The Ability of Barotropic Models to Simulate Historical Mean Sea Level Changes from Coastal Tide Gauge Data. Surv Geophys, 40, 1399-1435, doi:10.1007/s10712-019-09537-9.
- Piecuch, C. G., S. Dangendorf, G. G. Gawarkiewicz, C. M. Little, R. M. Ponte, and J. Y. Yang, 2019: How is New England Coastal Sea Level Related to the Atlantic Meridional Overturning Circulation at 26 degrees N? Geophysical Research Letters, 46, 5351-5360, doi:10.1029/2019gl083073.
- Porter, S. E., E. Mosley-Thompson, and L. G. Thompson, 2019: Ice Core delta O-18 Record Linked to Western Arctic Sea Ice Variability. Journal of Geophysical Research-Atmospheres, 124, 10784-10801, doi:10.1029/2019jd031023.
- Pourasghar, F., E. C. J. Oliver, and N. J. Holbrook, 2019: Modulation of wet-season rainfall over Iran by the Madden-Julian Oscillation, Indian Ocean Dipole and El Nino-Southern Oscillation. International Journal of Climatology, 39, 4029-4040, doi:10.1002/joc.6057.
- Previdi, M., and A. M. Fiore, 2019: The Importance of Sampling Variability in Assessments of ENSO-PM2.5 Relationships: A Case Study for the South Central United States. Geophysical Research Letters, 46, 6878-6884, doi:10.1029/2019gl082250.
- Primo, C., F. D. Kelemen, H. Feldmann, N. Akhtar, and B. Ahrens, 2019: A regional atmosphere-ocean climate system model (CCLMv5.0clm7-NEMOv3.3-NEMOv3.6) over Europe including three marginal seas: on its stability and performance. Geoscientific Model Development, 12, 5077-5095, doi:10.5194/gmd-12-5077-2019.
- Qin, M. H., A. G. Dai, D. L. Li, and W. J. Hua, 2020: Understanding the inter-decadal variability of autumn precipitation over North Central China using model simulations. International Journal of Climatology, 40, 874-886, doi:10.1002/joc.6245.
- Rao, J., Y. Y. Yu, D. Guo, C. H. Shi, D. Chen, and D. Z. Hu, 2019: Evaluating the Brewer-Dobson circulation and its responses to ENSO, QBO, and the solar cycle in different reanalyses. Earth and Planetary Physics, 3, 166-181, doi:10.26464/epp2019012.
- Reason, C. J. C., 2019: Low-frequency variability in the Botswana High and southern African regional climate. Theoretical and Applied Climatology, 137, 1321-1334, doi:10.1007/s00704-018-2661-8.
- Renard, B., and M. Thyer, 2019: Revealing Hidden Climate Indices from the Occurrence of Hydrologic Extremes. Water Resources Research, 55, 7662-7681, doi:10.1029/2019wr024951.
- Rodriguez-Diaz, L., I. Alvarez, M. Gomez-Gesteira, and F. Santos, 2019: Changes in the probability of larvae crossing the North Atlantic during the 20th century. Marine and Freshwater Research, 70, 1150-1168, doi:10.1071/mf18046.
- Rohrer, M., S. Bronnimann, O. Martius, C. C. Raible, and M. Wild, 2019: Decadal variations of blocking and storm tracks in centennial reanalyses. Tellus Series a-Dynamic Meteorology and Oceanography, 71, doi:10.1080/16000870.2019.1586236.
- Rueda, A., L. Cagigal, J. A. A. Antolinez, J. C. Albuquerque, S. Castanedo, G. Coco, and F. J. Mendez, 2019: Marine climate variability based on weather patterns for a complicated island setting: The New Zealand case. International Journal of Climatology, 39, 1777-1786, doi:10.1002/joc.5912.
- Rustemeier, E., M. Ziese, A. Meyer-Christoffer, U. Schneider, P. Finger, and A. Becker, 2019: Uncertainty Assessment of the ERA-20C Reanalysis Based on the Monthly In Situ Precipitation Analysis of the Global Precipitation Climatology Centre. Journal of Hydrometeorology, 20, 231-250, doi:10.1175/jhm-d-17-0239.1.
- Sachindra, D. A., K. Ahmed, M. M. Rashid, V. Sehgal, S. Shahid, and B. J. C. Perera, 2019: Pros and cons of using wavelets in conjunction with genetic programming and generalised linear models in statistical downscaling of precipitation. Theoretical and Applied Climatology, 138, 617-638, doi:10.1007/s00704-019-02848-2.
- Sanchez-Garcia, C., L. Schulte, F. Carvalho, and J. C. Pena, 2019: A 500-year flood history of the arid environments of southeastern Spain. The case of the Almanzora River. Global and Planetary Change, 181, doi:10.1016/j.gloplacha.2019.102987.
- Sanikommu, S., D. S. Banerjee, B. Baduru, B. Paul, A. Paul, K. Chakraborty, and I. Hoteit, 2019: Impact of dynamical representational errors on an Indian Ocean ensemble data assimilation system. Quarterly Journal of the Royal Meteorological Society, 145, 3680-3691, doi:10.1002/qj.3649.
- Scher, S., and G. Messori, 2019: Weather and climate forecasting with neural networks: using general circulation models (GCMs) with different complexity as a study ground. Geoscientific Model Development, 12, 2797-2809, doi:10.5194/gmd-12-2797-2019.
- Scherrer, S. C., and M. Begert, 2019: Effects of large-scale atmospheric flow and sunshine duration on the evolution of minimum and maximum temperature in Switzerland. Theoretical and Applied Climatology, 138, 227-235, doi:10.1007/s00704-019-02823-x.
- Schlef, K. E., H. Moradkhani, and U. Lall, 2019: Atmospheric Circulation Patterns Associated with Extreme United States Floods Identified via Machine Learning. Scientific Reports, 9, doi:10.1038/s41598-019-43496-w.
- Schneider, L., and Coauthors, 2019: The impact of proxy selection strategies on a millennium-long ensemble of hydroclimatic records in Monsoon Asia. Quaternary Science Reviews, 223, doi:10.1016/j.quascirev.2019.105917.
- Schulte, J. A., and S. Lee, 2019: Long Island Sound temperature variability and its associations with the ridge-trough dipole and tropical modes of sea surface temperature variability. Ocean Science, 15, 161-178, doi:10.5194/os-15-161-2019.
- Schulte, L., and Coauthors, 2019: Integration of multi-archive datasets for the development of a four-dimensional paleoflood model of alpine catchments. Global and Planetary Change, 180, 66-88, doi:10.1016/j.gloplacha.2019.05.011.
- Schweiger, A. J., K. R. Wood, and J. L. Zhang, 2019: Arctic Sea Ice Volume Variability over 1901-2010: A Model-Based Reconstruction. J. Clim., 32, 4731-4752, doi:10.1175/jcli-d-19-0008.1.
- Seager, R., M. Cane, N. Henderson, D. E. Lee, R. Abernathey, and H. H. Zhang, 2019: Strengthening tropical Pacific zonal sea surface temperature gradient consistent with rising greenhouse gases. Nature Climate Change, 9, 517-+, doi:10.1038/s41558-019-0505-x.
- Serykh, I. V., and D. M. Sonechkin, 2019: Nonchaotic and globally synchronized short-term climatic variations and their origin. Theoretical and Applied Climatology, 137, 2639-2656, doi:10.1007/s00704-018-02761-0.
- Serykh, I. V., D. M. Sonechkin, V. I. Byshev, V. G. Neiman, and Y. A. Romanov, 2019: Global Atmospheric Oscillation: An Integrity of ENSO and Extratropical Teleconnections. Pure and Applied Geophysics, 176, 3737-3755, doi:10.1007/s00024-019-02182-8. Serykh, I. V., D. M. Sonechkin, N. V. Vakulenko, and Iop, 2019: Interannual globally synchronized variations in the climate system and their predictability. Turbulence, Atmosphere and Climate Dynamics.
- Shi, C. M., and Coauthors, 2019: Summer Temperature over the Tibetan Plateau Modulated by Atlantic Multidecadal Variability. J. Clim., 32, 4055-4067, doi:10.1175/jcli-d-17-0858.1.
- Sidibe, M., and Coauthors, 2019: Interannual to Multi-decadal streamflow variability in West and Central Africa: Interactions with catchment properties and large-scale climate variability. Global and Planetary Change, 177, 141-156, doi:10.1016/j.gloplacha.2019.04.003.
- Sieber, R., and V. Slonosky, 2019: Developing a Flexible Platform for Crowdsourcing Historical Weather Records. Historical Methods, 52, 164-177, doi:10.1080/01615440.2018.1558138.
- Sim, T. G., G. T. Swindles, P. J. Morris, M. Galka, D. Mullan, and J. M. Galloway, 2019: Pathways for Ecological Change in Canadian High Arctic Wetlands Under Rapid Twentieth Century Warming. Geophysical Research Letters, 46, 4726-4737, doi:10.1029/2019gl082611.
- Sinclair, H. D., F. M. Stuart, S. M. Mudd, L. McCann, and Z. Tao, 2019: Detrital cosmogenic Ne-21 records decoupling of source-to-sink signals by sediment storage and recycling in Miocene to present rivers of the Great Plains, Nebraska, USA. Geology, 47, 3-6, doi:10.1130/g45391.1.
- Slivinski, L. C., and Coauthors, 2019: Towards a more reliable historical reanalysis: Improvements for version 3 of the Twentieth Century Reanalysis system. Quarterly Journal of the Royal Meteorological Society, 145, 2876-2908, doi:10.1002/qj.3598.
- Smith, K. A., and Coauthors, 2019: A multi-objective ensemble approach to hydrological modelling in the UK: an application to historic drought reconstruction. Hydrology and Earth System Sciences, 23, 3247-3268, doi:10.5194/hess-23-3247-2019.
- Smith, S. R., and Coauthors, 2019: Ship-Based Contributions to Global Ocean, Weather, and Climate Observing Systems. Frontiers in Marine Science, 6, doi:10.3389/fmars.2019.00434.
- Song, B., X. F. Zhi, M. T. Pan, M. Y. Hou, C. F. He, and K. Fraedrich, 2019: Turbulent Heat Flux Reconstruction in the North Pacific from 1921 to 2014. Journal of the Meteorological Society of Japan, 97, 893-911, doi:10.2151/jmsj.2019-050.
- Soulard, N., H. Lin, and B. Yu, 2019: The changing relationship between ENSO and its extratropical response patterns. Scientific Reports, 9, doi:10.1038/s41598-019-42922-3.
- Srinivas, G., J. S. Chowdary, C. Gnanaseelan, A. Parekh, R. Dandi, K. Prasad, and C. V. Naidu, 2019: Impact of differences in the decaying phase of El Nino on South and East Asia summer monsoon in CMIP5 models. International Journal of Climatology, 39, 5503-5521, doi:10.1002/joc.6168.
- Stone, D. A., and Coauthors, 2019: Experiment design of the International CLIVAR C20C+ Detection and Attribution project. Weather and Climate Extremes, 24, doi:10.1016/j.wace.2019.100206.
- Storto, A., and Coauthors, 2019: Ocean Reanalyses: Recent Advances and Unsolved Challenges. Frontiers in Marine Science, 6, doi:10.3389/fmars.2019.00418.
- Strock, K. E., J. E. Saros, S. McGowan, M. B. Edlund, and D. R. Engstrom, 2019: Response of boreal lakes to changing wind strength: Coherent physical changes across two large lakes but varying effects on primary producers over the 20(th) century. Limnology and Oceanography, 64, 2237-2251, doi:10.1002/lno.11181.
- Stryhal, J., and R. Huth, 2019: Classifications of winter atmospheric circulation patterns: validation of CMIP5 GCMs over Europe and the North Atlantic. Climate Dynamics, 52, 3575-3598, doi:10.1007/s00382-018-4344-7.
- Stryhal, J., and R. Huth, 2019: Trends in winter circulation over the British Isles and central Europe in twenty-first century projections by 25 CMIP5 GCMs. Climate Dynamics, 52, 1063-1075, doi:10.1007/s00382-018-4178-3.
- Sun, C., and Coauthors, 2019: Spring Aleutian Low Weakening and Surface Cooling Trend in Northwest North America During Recent Decades. Journal of Geophysical Research-Atmospheres, 124, 12078-12092, doi:10.1029/2019jd031405.
- Sun, C., and Coauthors, 2019: Recent Acceleration of Arabian Sea Warming Induced by the Atlantic-Western Pacific Trans-basin Multidecadal Variability. Geophysical Research Letters, 46, 1662-1671, doi:10.1029/2018gl081175.
- Sung, M. K., H. Y. Jang, B. M. Kim, S. W. Yeh, Y. S. Choi, and C. Yoo, 2019: Tropical influence on the North Pacific Oscillation drives winter extremes in North America. Nature Climate Change, 9, 413-+, doi:10.1038/s41558-019-0461-5.
- Swenson, S. C., M. Clark, Y. Fan, D. M. Lawrence, and J. Perket, 2019: Representing Intrahillslope Lateral Subsurface Flow in the Community Land Model. Journal of Advances in Modeling Earth Systems, 11, 4044-4065, doi:10.1029/2019ms001833.
- Swindles, G. T., and Coauthors, 2019: Widespread drying of European peatlands in recent centuries. Nature Geoscience, 12, 922-+, doi:10.1038/s41561-019-0462-z. Tabari, H., and P. Willems, 2019: Anomalous Extreme Rainfall Variability Over Europe - Interaction Between Climate Variability and Climate Change. New Trends in Urban Drainage Modelling, Udm 2018, G. Mannina, Ed., 375-379.
- Takahashi, K., and A. G. Martinez, 2019: The very strong coastal El Nino in 1925 in the far-eastern Pacific. Climate Dynamics, 52, 7389-7415, doi:10.1007/s00382-017-3702-1.
- Tan, X. Z., S. Chen, T. Y. Gan, B. J. Liu, and X. H. Chen, 2019: Dynamic and thermodynamic changes conducive to the increased occurrence of extreme spring fire weather over western Canada under possible anthropogenic climate change. Agricultural and Forest Meteorology, 265, 269-279, doi:10.1016/j.agrformet.2018.11.026.
- Tardif, R., and Coauthors, 2019: Last Millennium Reanalysis with an expanded proxy database and seasonal proxy modeling. Climate of the Past, 15, 1251-1273, doi:10.5194/cp-15-1251-2019.
- Tian, Z. P., and D. B. Jiang, 2020: Weakening and eastward shift of the tropical Pacific Walker circulation during the Last Glacial Maximum. Boreas, 49, 200-210, doi:10.1111/bor.12417.
- Tokinaga, H., I. Richter, and Y. Kosaka, 2019: ENSO Influence on the Atlantic Nino, Revisited: Multi-Year versus Single-Year ENSO Events. J. Clim., 32, 4585-4600, doi:10.1175/jcli-d-18-0683.1.
- Toreti, A., and Coauthors, 2019: Using reanalysis in crop monitoring and forecasting systems. Agricultural Systems, 168, 144-153, doi:10.1016/j.agsy.2018.07.001.
- Toride, K., Y. Iseri, A. Duren, J. F. England, and M. L. Kavvas, 2019: Evaluation of physical parameterizations for atmospheric river induced precipitation and application to long-term reconstruction based on three reanalysis datasets in Western Oregon. Science of the Total Environment, 658, 570-581, doi:10.1016/j.scitotenv.2018.12.214.
- Varino, F., P. Arbogast, B. Joly, G. Riviere, M. L. Fandeur, H. Bovy, and J. B. Granier, 2019: Northern Hemisphere extratropical winter cyclones variability over the 20th century derived from ERA-20C reanalysis. Climate Dynamics, 52, 1027-1048, doi:10.1007/s00382-018-4176-5.
- Veerman, M. A., and C. C. van Heerwaarden, 2019: Trends in and closure of the atmospheric angular momentum budget in the 20th century in ERA-20C. Quarterly Journal of the Royal Meteorological Society, 145, 2990-3003, doi:10.1002/qj.3600.
- Veiga, S. F., and Coauthors, 2019: The Brazilian Earth System Model ocean-atmosphere (BESM-OA) version 2.5: evaluation of its CMIP5 historical simulation. Geoscientific Model Development, 12, 1613-1642, doi:10.5194/gmd-12-1613-2019.
- Vera, C. S., L. B. Diaz, and R. I. Saurral, 2019: Influence of Anthropogenically-Forced Global Warming and Natural Climate Variability in the Rainfall Changes Observed Over the South American Altiplano. Frontiers in Environmental Science, 7, doi:10.3389/fenvs.2019.00087.
- Wahl, E. R., E. Zorita, V. Trouet, and A. H. Taylor, 2019: Jet stream dynamics, hydroclimate, and fire in California from 1600 CE to present. Proceedings of the National Academy of Sciences of the United States of America, 116, 5393-5398, doi:10.1073/pnas.1815292116.
- Wanamaker, A. D., and Coauthors, 2019: Pacific climate influences on ocean conditions and extreme shell growth events in the Northwestern Atlantic (Gulf of Maine). Climate Dynamics, 52, 6339-6356, doi:10.1007/s00382-018-4513-8.
- Wang, L. H., and Coauthors, 2019: Contributions of climate change and groundwater extraction to soil moisture trends. Earth System Dynamics, 10, 599-615, doi:10.5194/esd-10-599-2019.
- Wang, X., C. Y. Guan, R. X. Huang, W. Tan, and L. Wang, 2019: The roles of tropical and subtropical wind stress anomalies in the El Nino Modoki onset. Climate Dynamics, 52, 6585-6597, doi:10.1007/s00382-018-4534-3.
- Wang, Y. H., C. He, and T. Li, 2019: Decadal change in the relationship between East Asian spring circulation and ENSO: Is it modulated by Pacific Decadal Oscillation? International Journal of Climatology, 39, 172-187, doi:10.1002/joc.5793.
- Wang, Y. T., S. G. Hou, M. H. Ding, and W. J. Sun, 2020: On the performance of twentieth century reanalysis products for Antarctic snow accumulation. Climate Dynamics, 54, 435-455, doi:10.1007/s00382-019-05008-4.
- Wang, Z. L., L. Lin, M. L. Yang, and Z. Guo, 2019: The Role of Anthropogenic Aerosol Forcing in Interdecadal Variations of Summertime Upper-Tropospheric Temperature Over East Asia. Earths Future, 7, 136-150, doi:10.1029/2018ef001052.
- Wen, C. H., A. Kumar, and Y. Xue, 2019: Uncertainties in reanalysis surface wind stress and their relationship with observing systems. Climate Dynamics, 52, 3061-3078, doi:10.1007/s00382-018-4310-4.
- Werner, A. T., M. A. Schnorbus, R. R. Shrestha, A. J. Cannon, F. W. Zwiers, G. Dayon, and F. Anslow, 2019: A long-term, temporally consistent, gridded daily meteorological dataset for northwestern North America. Scientific Data, 6, doi:10.1038/sdata.2018.299.
- Wills, R. C. J., K. C. Armour, D. S. Battisti, and D. L. Hartmann, 2019: Ocean-Atmosphere Dynamical Coupling Fundamental to the Atlantic Multidecadal Oscillation. J. Clim., 32, 251-272, doi:10.1175/jcli-d-18-0269.1.
- Wohland, J., N. E. Omrani, N. Keenlyside, and D. Witthaut, 2019: Significant multidecadal variability in German wind energy generation. Wind Energy Science, 4, 515-526, doi:10.5194/wes-4-515-2019.
- Wohland, J., N. E. Omrani, D. Witthaut, and N. S. Keenlyside, 2019: Inconsistent Wind Speed Trends in Current Twentieth Century Reanalyses. Journal of Geophysical Research-Atmospheres, 124, 1931-1940, doi:10.1029/2018jd030083.
- Wongchuig, S. C., R. C. D. de Paiva, V. Siqueira, and W. Collischonn, 2019: Hydrological reanalysis across the 20th century: A case study of the Amazon Basin. Journal of Hydrology, 570, 755-773, doi:10.1016/j.jhydrol.2019.01.025.
- Woodworth, P. L., and Coauthors, 2019: Forcing Factors Affecting Sea Level Changes at the Coast. Surv Geophys, 40, 1351-1397, doi:10.1007/s10712-019-09531-1.
- Wu, B., T. J. Zhou, C. Li, W. A. Muller, and J. S. Lin, 2019: Improved decadal prediction of Northern-Hemisphere summer land temperature. Climate Dynamics, 53, 1357-1369, doi:10.1007/s00382-019-04658-8.
- Wu, R. G., T. You, and K. M. Hu, 2019: What Formed the North-South Contrasting Pattern of Summer Rainfall Changes over Eastern China? Current Climate Change Reports, 5, 47-62, doi:10.1007/s40641-019-00124-z.
- Wu, X., Y. M. Okumura, and P. N. DiNezio, 2019: What Controls the Duration of El Nino and La Nina Events? J. Clim., 32, 5941-5965, doi:10.1175/jcli-d-18-0681.1.
- Xia, Y. L., and Coauthors, 2019: Regional and Global Land Data Assimilation Systems: Innovations, Challenges, and Prospects. Journal of Meteorological Research, 33, 159-189, doi:10.1007/s13351-019-8172-4.
- Xiao, F. A., D. X. Wang, L. L. Zeng, Q. Y. Liu, and W. Zhou, 2019: Contrasting changes in the sea surface temperature and upper ocean heat content in the South China Sea during recent decades. Climate Dynamics, 53, 1597-1612, doi:10.1007/s00382-019-04697-1.
- Xie, T. J., J. P. Li, C. Sun, R. Q. Ding, K. C. Wang, C. F. Zhao, and J. Feng, 2019: NAO implicated as a predictor of the surface air temperature multidecadal variability over East Asia. Climate Dynamics, 53, 895-905, doi:10.1007/s00382-019-04624-4.
- Xie, W., G. Z. Fan, R. Q. Ding, J. P. Li, B. S. Li, J. H. Qin, and X. J. Zhou, 2019: Interdecadal change in the lagged relationship between the Victoria mode and ENSO. Atmospheric and Oceanic Science Letters, 12, 294-301, doi:10.1080/16742834.2019.1620081.
- Yang, C. X., A. Storto, and S. Masina, 2019: Quantifying the effects of observational constraints and uncertainty in atmospheric forcing on historical ocean reanalyses. Climate Dynamics, 52, 3321-3342, doi:10.1007/s00382-018-4331-z.
- Yang, E. G., and H. M. Kim, 2019: Evaluation of Short-Range Precipitation Reforecasts from East Asia Regional Reanalysis. Journal of Hydrometeorology, 20, 319-337, doi:10.1175/jhm-d-18-0068.1.
- Yang, M. H., R. T. Zuo, L. Q. Wang, F. L. Hu, C. Wang, and W. Ge, 2019: An experiment to improve the capability of the regional climate model RegCM4.5 to simulate the land surface climate in dense vegetation areas. Journal of Earth System Science, 128, doi:10.1007/s12040-019-1211-9.
- Yang, R. W., and J. Wang, 2019: Interannual variability of the seesaw mode of the interface between the Indian and East Asian summer monsoons. Climate Dynamics, 53, 2683-2695, doi:10.1007/s00382-019-04650-2.
- Yang, Y., T. Y. Gan, and X. Z. Tan, 2019: Spatiotemporal Changes in Precipitation Extremes over Canada and Their Teleconnections to Large-Scale Climate Patterns. Journal of Hydrometeorology, 20, 275-296, doi:10.1175/jhm-d-18-0004.1.
- Yu, B., and H. Lin, 2019: Modification of the wintertime Pacific-North American pattern related North American climate anomalies by the Asian-Bering-North American teleconnection. Climate Dynamics, 53, 313-328, doi:10.1007/s00382-018-4586-4.
- Yu, B., H. Lin, and N. Soulard, 2019: A Comparison of North American Surface Temperature and Temperature Extreme Anomalies in Association with Various Atmospheric Teleconnection Patterns. Atmosphere, 10, doi:10.3390/atmos10040172.
- Yu, J., T. J. Zhou, Z. H. Jiang, and L. W. Zou, 2019: Evaluation of Near-Surface Wind Speed Changes during 1979 to 2011 over China Based on Five Reanalysis Datasets. Atmosphere, 10, doi:10.3390/atmos10120804. Yu, L. S., 2019: Global Air-Sea Fluxes of Heat, Fresh Water, and Momentum: Energy Budget Closure and Unanswered Questions. Annual Review of Marine Science, Vol 11, C. A. Carlson, and S. J. Giovannoni, Eds., 227-248.
- Zanchettin, D., T. Toniazzo, C. Taricco, S. Rubinetti, A. Rubino, and N. Tartaglione, 2019: Atlantic origin of asynchronous European interdecadal hydroclimate variability. Scientific Reports, 9, doi:10.1038/s41598-019-47428-6.
- Zhang, L., W. Q. Han, K. B. Karnauskas, G. A. Meehl, A. X. Hu, N. Rosenbloom, and T. Shinoda, 2019: Indian Ocean Warming Trend Reduces Pacific Warming Response to Anthropogenic Greenhouse Gases: An Interbasin Thermostat Mechanism. Geophysical Research Letters, 46, 10882-10890, doi:10.1029/2019gl084088.
- Zhang, L. P., T. L. Delworth, W. Cooke, and X. S. Yang, 2019: Natural variability of Southern Ocean convection as a driver of observed climate trends. Nature Climate Change, 9, 59-+, doi:10.1038/s41558-018-0350-3.
- Zhang, S. Q., G. Y. Ren, Y. Y. Ren, and X. B. Sun, 2019: Comparison of Surface Air Temperature between Observation and Reanalysis Data over Eastern China for the Last 100 Years. Journal of the Meteorological Society of Japan, 97, 89-103, doi:10.2151/jmsj.2019-004.
- Zhang, T. W., and Coauthors, 2020: A 256-year-long precipitation reconstruction for northern Kyrgyzstan based on tree-ring width. International Journal of Climatology, 40, 1477-1491, doi:10.1002/joc.6280.
- Zhang, W., and B. Kirtman, 2019: Understanding the Signal-to-Noise Paradox with a Simple Markov Model. Geophysical Research Letters, 46, 13308-13317, doi:10.1029/2019gl085159.
- Zhang, W. J., X. B. Mei, X. Geng, A. G. Turner, and F. F. Jin, 2019: A Nonstationary ENSO-NAO Relationship Due to AMO Modulation. J. Clim., 32, 33-43, doi:10.1175/jcli-d-18-0365.1.
- Zhao, Y. S., and Coauthors, 2019: Early summer hydroclimatic signals are captured well by tree-ring earlywood width in the eastern Qinling Mountains, central China. Climate of the Past, 15, 1113-1131, doi:10.5194/cp-15-1113-2019.
- Zhao, Z. J., E. C. J. Oliver, D. Ballestero, J. M. Vargas-Hernandez, and N. J. Holbrook, 2019: Influence of the Madden-Julian oscillation on Costa Rican mid-summer drought timing. International Journal of Climatology, 39, 292-301, doi:10.1002/joc.5806.
- Zhou, C. L., K. C. Wang, D. Qi, and J. G. Tan, 2019: ATTRIBUTION OF A RECORD-BREAKING HEATWAVE EVENT IN SUMMER 2017 OVER THE YANGTZE RIVER DELTA. Bulletin of the American Meteorological Society, 100, S97-S103, doi:10.1175/bams-d-18-0134.1.
- Zhou, X. Y., F. Liu, B. Wang, B. Q. Xiang, C. Xing, and H. Wang, 2019: Different responses of East Asian summer rainfall to El Nino decays. Climate Dynamics, 53, 1497-1515, doi:10.1007/s00382-019-04684-6.
- Abish, B., A. Cherchi, and S. B. Ratna, 2018: ENSO and the recent warming of the Indian Ocean. International Journal of Climatology, 38, 203-214, doi:10.1002/joc.5170.
- Al-Khalidi, J., M. Dima, and S. Stefan, 2018: Large-scale modes impact on Iraq climate variability. Theoretical and Applied Climatology, 133, 179-190, doi:10.1007/s00704-017-2180-z.
- Alfaro-Sanchez, R., and Coauthors, 2018: Climatic and volcanic forcing of tropical belt northern boundary over the past 800 years. Nature Geoscience, 11, 933-+, doi:10.1038/s41561-018-0242-1.
- Allen, K. J., and Coauthors, 2018: A comparison of some simple methods used to detect unstable temperature responses in tree-ring chronologies. Dendrochronologia, 48, 52-73, doi:10.1016/j.dendro.2018.02.002.
- Alvarez-Castro, M. C., D. Faranda, and P. Yiou, 2018: Atmospheric Dynamics Leading to West European Summer Hot Temperatures Since 1851. Complexity, doi:10.1155/2018/2494509.
- Amador, J. A., M. J. Anderson, B. Calderon, and K. Pribyl, 2018: The October 1891 Cartago (Costa Rica) floods from documentary sources and 20CR data. International Journal of Climatology, 38, 4830-4845, doi:10.1002/joc.5701.
- Antolinez, J. A. A., A. B. Murray, F. J. Mendez, L. J. Moore, G. Farley, and J. Wood, 2018: Downscaling Changing Coastlines in a Changing Climate: The Hybrid Approach. Journal of Geophysical Research-Earth Surface, 123, 229-251, doi:10.1002/2017jf004367.
- Ashcroft, L., and Coauthors, 2018: A rescued dataset of sub-daily meteorological observations for Europe and the southern Mediterranean region, 1877-2012. Earth System Science Data, 10, 1613-1635, doi:10.5194/essd-10-1613-2018.
- Aubry, T. J., and A. M. Jellinek, 2018: New insights on entrainment and condensation in volcanic plumes: Constraints from independent observations of explosive eruptions and implications for assessing their impacts. Earth and Planetary Science Letters, 490, 132-142, doi:10.1016/j.epsl.2018.03.028.
- Baatz, R., and Coauthors, 2018: Steering operational synergies in terrestrial observation networks: opportunity for advancing Earth system dynamics modelling. Earth System Dynamics, 9, 593-609, doi:10.5194/esd-9-593-2018.
- Badur, J., and W. Cieslikiewicz, 2018: Spatial variability of long-term trends in significant wave height over the Gulf of Gdansk using System Identification techniques. Oceanological and Hydrobiological Studies, 47, 190-201, doi:10.1515/ohs-2018-0018.
- Barcikowska, M. J., S. B. Kapnick, and F. Feser, 2018: Impact of large-scale circulation changes in the North Atlantic sector on the current and future Mediterranean winter hydroclimate. Climate Dynamics, 50, 2039-2059, doi:10.1007/s00382-017-3735-5.
- Barichivich, J., E. Gloor, P. Peylin, R. J. W. Brienen, J. Schongart, J. C. Espinoza, and K. C. Pattnayak, 2018: Recent intensification of Amazon flooding extremes driven by strengthened Walker circulation. Science Advances, 4, doi:10.1126/sciadv.aat8785.
- Bartoszek, K., 2018: Long-term relationships between air flow indices and air temperature over Southeast Poland. Idojaras, 122, 101-118, doi:10.28974/idojaras.2018.2.1.
- Basharin, D., and G. Stankunavicius, 2018: The long-term 20th century re-analysis features over the North Atlantic-Eurasia region. Boreal Environment Research, 23, 139-148, doi:Bathiany, S., V. Dakos, M. Scheffer, and T. M. Lenton, 2018: Climate models predict increasing temperature variability in poor countries. Science Advances, 4, doi:10.1126/sciadv.aar5809.
- Begert, M., and C. Frei, 2018: Long-term area-mean temperature series for SwitzerlandCombining homogenized station data and high resolution grid data. International Journal of Climatology, 38, 2792-2807, doi:10.1002/joc.5460.
- Berntell, E., Q. Zhang, L. Chafik, and H. Kornich, 2018: Representation of Multidecadal Sahel Rainfall Variability in 20th Century Reanalyses. Scientific Reports, 8, doi:10.1038/s41598-018-29217-9.
- Birkel, S. D., P. A. Mayewski, K. A. Maasch, A. V. Kurbatov, and B. Lyon, 2018: Evidence for a volcanic underpinning of the Atlantic multidecadal oscillation. Npj Climate and Atmospheric Science, 1, doi:10.1038/s41612-018-0036-6.
- Bloomfield, H. C., L. C. Shaffrey, K. I. Hodges, and P. L. Vidale, 2018: A critical assessment of the long-term changes in the wintertime surface Arctic Oscillation and Northern Hemisphere storminess in the ERA20C reanalysis. Environmental Research Letters, 13, doi:10.1088/1748-9326/aad5c5.
- Boisier, J. P., and Coauthors, 2018: Anthropogenic drying in central-southern Chile evidenced by long-term observations and climate model simulations. Elementa-Science of the Anthropocene, 6, doi:10.1525/elementa.328. Bokuchava, D. D., and V. A. Semenov, 2018: Surface air temperature and pressure anomalies in the Northern Hemisphere during the 20th century: observations and reanalyses. 24th International Symposium on Atmospheric and Ocean Optics: Atmospheric Physics, G. G. Matvienko, and O. A. Romanovskii, Eds.
- Borchert, L. F., W. A. Muller, and J. Baehr, 2018: Atlantic Ocean Heat Transport Influences Interannual-to-Decadal Surface Temperature Predictability in the North Atlantic Region. J. Clim., 31, 6763-6782, doi:10.1175/jcli-d-17-0734.1.
- Brazdil, R., and Coauthors, 2018: The second most disastrous windstorm of the nineteenth century in the Czech Lands, 26-27 October 1870. Theoretical and Applied Climatology, 132, 1201-1216, doi:10.1007/s00704-017-2146-1.
- Brazdil, R., and Coauthors, 2018: Windstorms and forest disturbances in the Czech Lands: 1801-2015. Agricultural and Forest Meteorology, 250, 47-63, doi:10.1016/j.agrformet.2017.11.036.
- Brierley, C., and I. Wainer, 2018: Inter-annual variability in the tropical Atlantic from the Last Glacial Maximum into future climate projections simulated by CMIP5/PMIP3. Climate of the Past, 14, 1377-1390, doi:10.5194/cp-14-1377-2018.
- Bronnimann, S., and Coauthors, 2018: OBSERVATIONS FOR REANALYSES. Bulletin of the American Meteorological Society, 99, 1851-1866, doi:10.1175/bams-d-17-0229.1.
- Bronnimann, S., and Coauthors, 2018: A roadmap to climate data rescue services. Geoscience Data Journal, 5, 28-39, doi:10.1002/gdj3.56.
- Bronnimann, S., J. Rajczak, E. M. Fischer, C. C. Raible, M. Rohrer, and C. Schar, 2018: Changing seasonality of moderate and extreme precipitation events in the Alps. Natural Hazards and Earth System Sciences, 18, 2047-2056, doi:10.5194/nhess-18-2047-2018.
- Buizza, R., and Coauthors, 2018: THE EU-FP7 ERA-CLIM2 PROJECT CONTRIBUTION TO ADVANCING SCIENCE AND PRODUCTION OF EARTH SYSTEM CLIMATE REANALYSES. Bulletin of the American Meteorological Society, 99, 1003-1014, doi:10.1175/bams-d-17-0199.1.
- Burt, T. P., C. F. Miniat, S. H. Laseter, and W. T. Swank, 2018: Changing patterns of daily precipitation totals at the Coweeta Hydrologic Laboratory, North Carolina, USA. International Journal of Climatology, 38, 94-104, doi:10.1002/joc.5163.
- Cai, L., V. A. Alexeev, J. E. Walsh, and U. S. Bhatt, 2018: Patterns, Impacts, and Future Projections of Summer Variability in the Arctic from CMIP5 Models. J. Clim., 31, 9815-9833, doi:10.1175/jcli-d-18-0119.1.
- Calafat, F. M., T. Wahl, F. Lindsten, J. Williams, and E. Frajka-Williams, 2018: Coherent modulation of the sea-level annual cycle in the United States by Atlantic Rossby waves. Nature Communications, 9, doi:10.1038/s41467-018-04898-y.
- Carton, J. A., G. A. Chepurin, and L. G. Chen, 2018: SODA3: A New Ocean Climate Reanalysis. J. Clim., 31, 6967-6983, doi:10.1175/jcli-d-18-0149.1.
- Changnon, D., 2018: A Spatial and Temporal Analysis of 30-Day Heavy Snowfall Amounts in the Eastern United States, 1900-2016. Journal of Applied Meteorology and Climatology, 57, 319-331, doi:10.1175/jamc-d-17-0217.1.
- Chaste, E., M. P. Girardin, J. O. Kaplan, J. Portier, Y. Bergeron, and C. Hely, 2018: The pyrogeography of eastern boreal Canada from 1901 to 2012 simulated with the LPJ-LMfire model. Biogeosciences, 15, 1273-1292, doi:10.5194/bg-15-1273-2018.
- Chen, D., H. J. Wang, J. Q. Sun, and Y. Gao, 2018: Pacific multi-decadal oscillation modulates the effect of Arctic oscillation and El Nino southern oscillation on the East Asian winter monsoon. International Journal of Climatology, 38, 2808-2818, doi:10.1002/joc.5461.
- Chen, L. L., J. Francis, and E. Hanna, 2018: The "Warm-Arctic/Cold-continents" pattern during 1901-2010. International Journal of Climatology, 38, 5245-5254, doi:10.1002/joc.5725.
- Chen, X., X. Liu, X. Li, M. Liu, and M. Yang, 2018: Activity Characteristics of the East Asian Trough in CMIP5 Models. Atmosphere, 9, doi:10.3390/atmos9020067.
- Chen, Z., B. L. Gan, and L. X. Wu, 2018: Response of the North Pacific Oscillation to global warming in the models of the Intergovernmental Panel on Climate Change Fourth Assessment Report. Journal of Oceanology and Limnology, 36, 601-611, doi:10.1007/s00343-018-7022-z.
- Chen, Z., B. L. Gan, L. X. Wu, and F. Jia, 2018: Pacific-North American teleconnection and North Pacific Oscillation: historical simulation and future projection in CMIP5 models. Climate Dynamics, 50, 4379-4403, doi:10.1007/s00382-017-3881-9.
- Cheng, Y. C., Q. Xu, and X. F. Li, 2018: Spatio-Temporal Variability of Annual Sea Level Cycle in the Baltic Sea. Remote Sensing, 10, doi:10.3390/rs10040528.
- Cheng, Z. G., Y. T. Qiao, M. Q. Jian, and S. T. Siems, 2018: Inter-decadal change of leading pattern of spring rainfall over southern China during 1901-2010. International Journal of Climatology, 38, 3494-3512, doi:10.1002/joc.5511.
- Cheon, S. H., B. D. Hamlington, and K. D. Suh, 2018: Reconstruction of sea level around the Korean Peninsula using cyclostationary empirical orthogonal functions. Ocean Science, 14, 959-970, doi:10.5194/os-14-959-2018.
- Cherchi, A., and Coauthors, 2018: EVALUATION OF AMIP-TYPE ATMOSPHERIC FIELDS AS FORCING FOR MEDITERRANEAN SEA AND GLOBAL OCEAN REANALYSES. Annals of Geophysics, 61, doi:10.4401/ag-7793.
- Choi, B. H., K. O. Kim, J. H. Yuk, and H. S. Lee, 2018: Simulation of the 1953 storm surge in the North Sea. Ocean Dynamics, 68, 1759-1777, doi:10.1007/s10236-018-1223-z.
- Cid, A., T. Wahl, D. P. Chambers, and S. Muis, 2018: Storm Surge Reconstruction and Return Water Level Estimation in Southeast Asia for the 20th Century. Journal of Geophysical Research-Oceans, 123, 437-451, doi:10.1002/2017jc013143.
- Cieslikiewicz, W., A. Dudkowska, G. Gic-Grusza, and J. Jedrasik, 2018: Assessment of the potential for dredged material dispersal from dumping sites in the Gulf of Gdask. Journal of Soils and Sediments, 18, 3437-3447, doi:10.1007/s11368-018-2066-4.
- Coats, S., and K. B. Karnauskas, 2018: A Role for the Equatorial Undercurrent in the Ocean Dynamical Thermostat. J. Clim., 31, 6245-6261, doi:10.1175/jcli-d-17-0513.1.
- Codilean, A. T., H. Munack, T. J. Cohen, W. M. Saktura, A. Gray, and S. M. Mudd, 2018: OCTOPUS: an open cosmogenic isotope and luminescence database. Earth System Science Data, 10, 2123-2139, doi:10.5194/essd-10-2123-2018.
- Comas-Bru, L., and A. Hernandez, 2018: Reconciling North Atlantic climate modes: revised monthly indices for the East Atlantic and the Scandinavian patterns beyond the 20th century. Earth System Science Data, 10, 2329-2344, doi:10.5194/essd-10-2329-2018.
- Cook, B. I., A. P. Williams, J. S. Mankin, R. Seager, J. E. Smerdon, and D. Singh, 2018: Revisiting the Leading Drivers of Pacific Coastal Drought Variability in the Contiguous United States. J. Clim., 31, 25-43, doi:10.1175/jcli-d-17-0172.1.
- Cradden, L. C., and F. McDermott, 2018: A weather regime characterisation of Irish wind generation and electricity demand in winters 2009-11. Environmental Research Letters, 13, doi:10.1088/1748-9326/aabd40.
- Cretat, J., P. Terray, S. Masson, and K. P. Sooraj, 2018: Intrinsic precursors and timescale of the tropical Indian Ocean Dipole: insights from partially decoupled numerical experiment. Climate Dynamics, 51, 1311-1332, doi:10.1007/s00382-017-3956-7.
- Crosta, X., and Coauthors, 2018: Ocean as the main driver of Antarctic ice sheet retreat during the Holocene. Global and Planetary Change, 166, 62-74, doi:10.1016/j.gloplacha.2018.04.007.
- Dafka, S., A. Toreti, J. Luterbacher, P. Zanis, E. Tyrlis, and E. Xoplaki, 2018: On the ability of RCMs to capture the circulation pattern of Etesians. Climate Dynamics, 51, 1687-1706, doi:10.1007/s00382-017-3977-2.
- Dai, X. G., and P. Wang, 2018: Identifying the early 2000s hiatus associated with internal climate variability. Scientific Reports, 8, doi:10.1038/s41598-018-31862-z.
- Danco, J. F., and E. R. Martin, 2018: Understanding the influence of ENSO on the Great Plains low-level jet in CMIP5 models. Climate Dynamics, 51, 1537-1558, doi:10.1007/s00382-017-3970-9.
- Datwyler, C., and Coauthors, 2018: Teleconnection stationarity, variability and trends of the Southern Annular Mode (SAM) during the last millennium. Climate Dynamics, 51, 2321-2339, doi:10.1007/s00382-017-4015-0.
- Davy, R., L. L. Chen, and E. Hanna, 2018: Arctic amplification metrics. International Journal of Climatology, 38, 4384-4394, doi:10.1002/joc.5675.
- de Boisseson, E., M. Balmaseda, and M. Mayer, 2018: Ocean heat content variability in an ensemble of twentieth century ocean reanalyses. Climate Dynamics, 50, 3783-3798, doi:10.1007/s00382-017-3845-0.
- Deser, C., I. R. Simpson, A. S. Phillips, and K. A. McKinnon, 2018: How Well Do We Know ENSO's Climate Impacts over North America, and How Do We Evaluate Models Accordingly? J. Clim., 31, 4991-5014, doi:10.1175/jcli-d-17-0783.1.
- Dessler, A. E., and P. M. Forster, 2018: An Estimate of Equilibrium Climate Sensitivity From Interannual variability. Journal of Geophysical Research-Atmospheres, 123, 8634-8645, doi:10.1029/2018jd028481.
- Dettinger, M. D., F. M. Ralph, and J. J. Rutz, 2018: Empirical Return Periods of the Most Intense Vapor Transports during Historical Atmospheric River Landfalls on the US West Coast. Journal of Hydrometeorology, 19, 1363-1377, doi:10.1175/jhm-d-17-0247.1.
- Diasso, U., and B. J. Abiodun, 2018: Future impacts of global warming and reforestation on drought patterns over West Africa. Theoretical and Applied Climatology, 133, 647-662, doi:10.1007/s00704-017-2209-3.
- Dobrica, V., R. Pirloaga, C. Stefan, and C. Demetrescu, 2018: Inferring geoeffective solar variability signature in stratospheric and tropospheric Northern Hemisphere temperatures. Journal of Atmospheric and Solar-Terrestrial Physics, 180, 137-147, doi:10.1016/j.jastp.2017.05.001.
- Dogar, M. M., 2018: Impact of tropical volcanic eruptions on Hadley circulation using a high-resolution AGCM. Current Science, 114, 1284-1294, doi:10.18520/cs/v114/i06/1284-1294.
- Domeisen, D. I. V., G. Badin, and I. M. Koszalka, 2018: How Predictable Are the Arctic and North Atlantic Oscillations? Exploring the Variability and Predictability of the Northern Hemisphere. J. Clim., 31, 997-1014, doi:10.1175/jcli-d-17-0226.1.
- Dong, B., A. G. Dai, M. Vuille, and O. E. Timm, 2018: Asymmetric Modulation of ENSO Teleconnections by the Interdecadal Pacific Oscillation. J. Clim., 31, 7337-7361, doi:10.1175/jcli-d-17-0663.1.
- Dong, T. Y., W. J. Dong, Y. Guo, J. M. Chou, S. L. Yang, D. Tian, and D. D. Yan, 2018: Future temperature changes over the critical Belt and Road region based on CMIP5 models. Advances in Climate Change Research, 9, 57-65, doi:10.1016/j.accre.2018.01.003.
- Dos Santos, E. P., M. C. Carcedo, C. Zotelo, and S. M. Fiori, 2018: Effects of erosion-accretion processes on a community dominated by Brachidontes rodriguezii (Mollusca: Mytilidae) on a rocky outcrop of the South Atlantic coast. Journal of Marine Systems, 187, 146-155, doi:10.1016/j.jmarsys.2018.07.006.
- Du, J. Z., K. C. Wang, J. K. Wang, S. J. Jiang, and C. L. Zhou, 2018: Diurnal Cycle of Surface Air Temperature within China in Current Reanalyses: Evaluation and Diagnostics. J. Clim., 31, 4585-4603, doi:10.1175/jcli-d-17-0773.1.
- Dubinkina, S., 2018: Relevance of conservative numerical schemes for an Ensemble Kalman Filter. Quarterly Journal of the Royal Meteorological Society, 144, 468-477, doi:10.1002/qj.3219.
- Emery, C. M., A. Paris, S. Biancamaria, A. Boone, S. Calmant, P. A. Garambois, and J. S. da Silva, 2018: Large-scale hydrological model river storage and discharge correction using a satellite altimetry-based discharge product. Hydrology and Earth System Sciences, 22, 2135-2162, doi:10.5194/hess-22-2135-2018.
- Felis, T., M. Ionita, N. Rimbu, G. Lohmann, and M. Kolling, 2018: Mild and Arid Climate in the Eastern Sahara-Arabian Desert During the Late Little Ice Age. Geophysical Research Letters, 45, 7112-7119, doi:10.1029/2018gl078617.
- Feng, F., and K. C. Wang, 2018: Merging Satellite Retrievals and Reanalyses to Produce Global Long-Term and Consistent Surface Incident Solar Radiation Datasets. Remote Sensing, 10, doi:10.3390/rs10010115.
- Feng, X. B., K. Haines, and E. de Boisseson, 2018: Coupling of surface air and sea surface temperatures in the CERA-20C reanalysis. Quarterly Journal of the Royal Meteorological Society, 144, 195-207, doi:10.1002/qj.3194.
- Feng, X. B., K. Haines, C. L. Liu, E. de Boisseson, and I. Polo, 2018: Improved SST-Precipitation Intraseasonal Relationships in the ECMWF Coupled Climate Reanalysis. Geophysical Research Letters, 45, 3664-3672, doi:10.1029/2018gl077138.
- Flanagan, P. X., J. B. Basara, J. C. Furtado, and X. M. Xiao, 2018: Primary Atmospheric Drivers of Pluvial Years in the United States Great Plains. Journal of Hydrometeorology, 19, 643-658, doi:10.1175/jhm-d-17-0148.1.
- Fogt, R. L., L. N. Clark, and J. P. Nicolas, 2018: A New Monthly Pressure Dataset Poleward of 60 degrees S since 1957. J. Clim., 31, 3865-3874, doi:10.1175/jcli-d-17-0879.1.
- Folland, C. K., O. Boucher, A. Colman, and D. E. Parker, 2018: Causes of irregularities in trends of global mean surface temperature since the late 19th century. Science Advances, 4, doi:10.1126/sciadv.aao5297.
- Fourre, E., A. Landais, A. Cauquoin, P. Jean-Baptiste, V. Lipenkov, and J. R. Petit, 2018: Tritium Records to Trace Stratospheric Moisture Inputs in Antarctica. Journal of Geophysical Research-Atmospheres, 123, 3009-3018, doi:10.1002/2018jd028304.
- Frederikse, T., and T. Gerkema, 2018: Multi-decadal variability in seasonal mean sea level along the North Sea coast. Ocean Science, 14, 1491-1501, doi:10.5194/os-14-1491-2018.
- Frederikse, T., S. Jevrejeva, R. E. M. Riva, and S. Dangendorf, 2018: A Consistent Sea-Level Reconstruction and Its Budget on Basin and Global Scales over 1958-2014. J. Clim., 31, 1267-1280, doi:10.1175/jcli-d-17-0502.1.
- Frederiksen, C. S., K. R. Ying, S. Grainger, and X. G. Zheng, 2018: Modes of interannual variability in northern hemisphere winter atmospheric circulation in CMIP5 models: evaluation, projection and role of external forcing. Climate Dynamics, 50, 2845-2865, doi:10.1007/s00382-017-3776-9.
- Fuentes, M., and Coauthors, 2018: A 970-year-long summer temperature reconstruction from Rogen, west-central Sweden, based on blue intensity from tree rings. Holocene, 28, 254-266, doi:10.1177/0959683617721322.
- Fukui, S., T. Iwasaki, K. Saito, H. Seko, and M. Kunii, 2018: A Feasibility Study on the High-Resolution Regional Reanalysis over Japan Assimilating Only Conventional Observations as an Alternative to the Dynamical Downscaling. Journal of the Meteorological Society of Japan, 96, 565-585, doi:10.2151/jmsj.2018-056.
- Galabov, V., and H. Chervenkov, 2018: Study of the Western Black Sea Storms with a Focus on the Storms Caused by Cyclones of North African Origin. Pure and Applied Geophysics, 175, 3779-3799, doi:10.1007/s00024-018-1844-7.
- Garcia-Herrera, R., D. Barriopedro, D. Gallego, J. Mellado-Cano, D. Wheeler, and C. Wilkinson, 2018: Understanding weather and climate of the last 300 years from ships' logbooks. Wiley Interdisciplinary Reviews-Climate Change, 9, doi:10.1002/wcc.544.
- Gerber, E. P., and P. Martineau, 2018: Quantifying the variability of the annular modes: reanalysis uncertainty vs. sampling uncertainty. Atmospheric Chemistry and Physics, 18, 17099-17117, doi:10.5194/acp-18-17099-2018.
- Giannakis, D., and J. Slawinska, 2018: Indo-Pacific Variability on Seasonal to Multidecadal Time Scales. Part II: Multiscale Atmosphere-Ocean Linkages. J. Clim., 31, 693-725, doi:10.1175/jcli-d-17-0031.1.
- Gilabert, J., and M. C. Llasat, 2018: Circulation weather types associated with extreme flood events in Northwestern Mediterranean. International Journal of Climatology, 38, 1864-1876, doi:10.1002/joc.5301.
- Gong, H. N., L. Wang, W. Chen, and D. Nath, 2018: Multidecadal Fluctuation of the Wintertime Arctic Oscillation Pattern and Its Implication. J. Clim., 31, 5595-5608, doi:10.1175/jcli-d-17-0530.1.
- Gowda, K., S. Iams, and M. Silber, 2018: Signatures of human impact on self-organized vegetation in the Horn of Africa. Scientific Reports, 8, doi:10.1038/s41598-018-22075-5.
- Graeter, K. A., and Coauthors, 2018: Ice Core Records of West Greenland Melt and Climate Forcing. Geophysical Research Letters, 45, 3164-3172, doi:10.1002/2017gl076641.
- Grise, K. M., S. M. Davis, P. W. Staten, and O. Adam, 2018: Regional and Seasonal Characteristics of the Recent Expansion of the Tropics. J. Clim., 31, 6839-6856, doi:10.1175/jcli-d-18-0060.1.
- Gross, M. H., M. G. Donat, L. V. Alexander, and S. A. Sisson, 2018: The Sensitivity of Daily Temperature Variability and Extremes to Dataset Choice. J. Clim., 31, 1337-1359, doi:10.1175/jcli-d-17-0243.1.
- Grotjahn, R., and J. Huynh, 2018: Contiguous US summer maximum temperature and heat stress trends in CRU and NOAA Climate Division data plus comparisons to reanalyses. Scientific Reports, 8, doi:10.1038/s41598-018-29286-w.
- Gu, X. F., F. W. Bao, T. H. Cheng, H. Chen, Y. Wang, and H. Guo, 2018: The impacts of regional transport and meteorological factors on aerosol optical depth over Beijing, 1980-2014. Scientific Reports, 8, doi:10.1038/s41598-018-22803-x.
- Guimberteau, M., and Coauthors, 2018: ORCHIDEE-MICT (v8.4.1), a land surface model for the high latitudes: model description and validation. Geoscientific Model Development, 11, 121-163, doi:10.5194/gmd-11-121-2018.
- Guo, B. B., and Coauthors, 2018: Applicability Assessment and Uncertainty Analysis of Multi-Precipitation Datasets for the Simulation of Hydrologic Models. Water, 10, doi:10.3390/w10111611.
- Guo, R. X., X. D. Guan, Y. L. He, Z. W. Gan, and H. C. Jin, 2018: Different roles of dynamic and thermodynamic effects in enhanced semi-arid warming. International Journal of Climatology, 38, 13-22, doi:10.1002/joc.5155.
- Guo, Y. P., and Z. M. Tan, 2018: The Hadley Circulation Regime Change: Combined Effect of the Western Pacific Warming and Increased ENSO Amplitude. J. Clim., 31, 9739-9751, doi:10.1175/jcli-d-18-0306.1.
- Hall, R. J., and E. Hanna, 2018: North Atlantic circulation indices: links with summer and winter UK temperature and precipitation and implications for seasonal forecasting. International Journal of Climatology, 38, E660-E677, doi:10.1002/joc.5398.
- Hamilton, D. S., and Coauthors, 2018: Reassessment of pre-industrial fire emissions strongly affects anthropogenic aerosol forcing. Nature Communications, 9, doi:10.1038/s41467-018-05592-9.
- Hanna, E., X. Fettweis, and R. J. Hall, 2018: Brief communication: Recent changes in summer Greenland blocking captured by none of the CMIP5 models. Cryosphere, 12, 3287-3292, doi:10.5194/tc-12-3287-2018.
- Hanna, E., R. J. Hall, T. E. Cropper, T. J. Ballinger, L. Wake, T. Mote, and J. Cappelen, 2018: Greenland blocking index daily series 1851-2015: Analysis of changes in extremes and links with North Atlantic and UK climate variability and change. International Journal of Climatology, 38, 3546-3564, doi:10.1002/joc.5516.
- Harlass, J., M. Latif, and W. Park, 2018: Alleviating tropical Atlantic sector biases in the Kiel climate model by enhancing horizontal and vertical atmosphere model resolution: climatology and interannual variability. Climate Dynamics, 50, 2605-2635, doi:10.1007/s00382-017-3760-4.
- Haro-Monteagudo, D., A. Daccache, and J. Knox, 2018: Exploring the utility of drought indicators to assess climate risks to agricultural productivity in a humid climate. Hydrology Research, 49, 539-551, doi:10.2166/nh.2017.010.
- Hegerl, G. C., S. Bronnimann, A. Schurer, and T. Cowan, 2018: The early 20th century warming: Anomalies, causes, and consequences. Wiley Interdisciplinary Reviews-Climate Change, 9, doi:10.1002/wcc.522.
- Hempelmann, N., and Coauthors, 2018: Web processing service for climate impact and extreme weather event analyses. Flyingpigeon (Version 1.0). Computers & Geosciences, 110, 65-72, doi:10.1016/j.cageo.2017.10.004.
- Hessl, A. E., and Coauthors, 2018: Past and future drought in Mongolia. Science Advances, 4, doi:10.1126/sciadv.1701832.
- Hirons, L., and A. Turner, 2018: The Impact of Indian Ocean Mean-State Biases in Climate Models on the Representation of the East African Short Rains. J. Clim., 31, 6611-6631, doi:10.1175/jcli-d-17-0804.1.
- Hu, Z. H., S. T. Michaletz, D. J. Johnson, N. G. McDowell, Z. Q. Huang, X. H. Zhou, and C. G. Xu, 2018: Traits drive global wood decomposition rates more than climate. Global Change Biology, 24, 5259-5269, doi:10.1111/gcb.14357.
- Hu, Z. Y., and Coauthors, 2018: Evaluation of three global gridded precipitation data sets in central Asia based on rain gauge observations. International Journal of Climatology, 38, 3475-3493, doi:10.1002/joc.5510.
- Huang, B., U. Cubasch, and Y. Li, 2018: East Asian Summer Monsoon Representation in Re-Analysis Datasets. Atmosphere, 9, doi:10.3390/atmos9060235.
- Huang, R. P., S. F. Chen, W. Chen, and P. Hu, 2018: Has the regional Hadley circulation over western Pacific during boreal winter been strengthening in recent decades? Atmospheric and Oceanic Science Letters, 11, 454-463, doi:10.1080/16742834.2018.1507412.
- Huang, W. R., S. Y. S. Wang, and B. T. Guan, 2018: Decadal fluctuations in the western Pacific recorded by long precipitation records in Taiwan. Climate Dynamics, 50, 1597-1608, doi:10.1007/s00382-017-3707-9.
- Huang, Z. W., and Coauthors, 2018: Reconstruction of global gridded monthly sectoral water withdrawals for 1971-2010 and analysis of their spatiotemporal patterns. Hydrology and Earth System Sciences, 22, 2117-2133, doi:10.5194/hess-22-2117-2018.
- Ionita, M., C. A. Badaluta, P. Scholz, and S. Chelcea, 2018: Vanishing river ice cover in the lower part of the Danube basin - signs of a changing climate. Scientific Reports, 8, doi:10.1038/s41598-018-26357-w.
- Jaffres, J. B. D., C. Cuff, C. Rasmussen, and A. S. Hesson, 2018: Teleconnection of atmospheric and oceanic climate anomalies with Australian weather patterns: a review of data availability. Earth-Science Reviews, 176, 117-146, doi:10.1016/j.earscirev.2017.08.010.
- Jezequel, A., P. Yiou, and S. Radanovics, 2018: Role of circulation in European heatwaves using flow analogues. Climate Dynamics, 50, 1145-1159, doi:10.1007/s00382-017-3667-0.
- Jimenez, G., J. E. Cole, D. M. Thompson, and A. W. Tudhope, 2018: Northern Galapagos Corals Reveal Twentieth Century Warming in the Eastern Tropical Pacific. Geophysical Research Letters, 45, 1981-1988, doi:10.1002/2017gl075323.
- Jin, X. L., and Coauthors, 2018: Influences of Pacific Climate Variability on Decadal Subsurface Ocean Heat Content Variations in the Indian Ocean. J. Clim., 31, 4157-4174, doi:10.1175/jcli-d-17-0654.1. Josey, S. A., J. J. M. Hirschi, B. Sinha, A. Duchez, J. P. Grist, and R. Marsh, 2018: The Recent Atlantic Cold Anomaly: Causes, Consequences, and Related Phenomena. Annual Review of Marine Science, Vol 10, C. A. Carlson, and S. J. Giovannoni, Eds., 475-501.
- Kajtar, J. B., A. Santoso, S. McGregor, M. H. England, and Z. Baillie, 2018: Model under-representation of decadal Pacific trade wind trends and its link to tropical Atlantic bias. Climate Dynamics, 50, 1471-1484, doi:10.1007/s00382-017-3699-5.
- Karspeck, A. R., and Coauthors, 2018: A global coupled ensemble data assimilation system using the Community Earth System Model and the Data Assimilation Research Testbed. Quarterly Journal of the Royal Meteorological Society, 144, 2404-2430, doi:10.1002/qj.3308.
- Kay, A. L., V. A. Bell, B. P. Guillod, R. G. Jones, and A. C. Rudd, 2018: National-scale analysis of low flow frequency: historical trends and potential future changes. Climatic Change, 147, 585-599, doi:10.1007/s10584-018-2145-y.
- Kayano, M. T., R. V. Andreoli, S. R. Garcia, and R. A. F. de Souza, 2018: How the two nodes of the tropical Atlantic sea surface temperature dipole relate the climate of the surrounding regions during austral autumn. International Journal of Climatology, 38, 3927-3941, doi:10.1002/joc.5545.
- Kayano, M. T., and A. W. Setzer, 2018: Nearly Synchronous Multidecadal Oscillations of Surface Air Temperature in Punta Arenas and the Atlantic Multidecadal Oscillation Index. J. Clim., 31, 7237-7248, doi:10.1175/jcli-d-17-0793.1.
- Kenigson, J. S., W. Q. Han, B. Rajagopalan, Yanto, and M. Jasinski, 2018: Decadal Shift of NAO-Linked Interannual Sea Level Variability along the US Northeast Coast. J. Clim., 31, 4981-4989, doi:10.1175/jcli-d-17-0403.1.
- Kim, W. M., S. Yeager, P. Chang, and G. Danabasoglu, 2018: Low-Frequency North Atlantic Climate Variability in the Community Earth System Model Large Ensemble. J. Clim., 31, 787-813, doi:10.1175/jcli-d-17-0193.1.
- Kim, W. M., S. G. Yeager, and G. Danabasoglu, 2018: Key Role of Internal Ocean Dynamics in Atlantic Multidecadal Variability During the Last Half Century. Geophysical Research Letters, 45, 13449-13457, doi:10.1029/2018gl080474.
- King, A. D., and C. L. Vincent, 2018: Using Global and Regional Model Simulations to Understand Maritime Continent Wet-Season Rainfall Variability. Geophysical Research Letters, 45, 12534-12543, doi:10.1029/2018gl080201.
- King, M. P., I. Herceg-Bulic, F. Kucharski, and N. Keenlyside, 2018: Interannual tropical Pacific sea surface temperature anomalies teleconnection to Northern Hemisphere atmosphere in November. Climate Dynamics, 50, 1881-1899, doi:10.1007/s00382-017-3727-5.
- Kirk, J. P., and G. A. Cromley, 2018: Assimilating Weather Data into a Digital Event Gazetteer of Airborne Parachute Operations during the French Indochina War. Weather Climate and Society, 10, 19-34, doi:10.1175/wcas-d-17-0016.1.
- Klaus, D., P. Wyszynski, K. Dethloff, R. Przybytak, and A. Rinke, 2018: Evaluation of 20CR reanalysis data and model results based on historical (1930-1940) observations from Franz Josef Land. Polish Polar Research, 39, 225-254, doi:10.24425/118747.
- Knox, J. W., D. Haro-Monteagudo, T. M. Hess, and J. Morris, 2018: Identifying Trade-Offs and Reconciling Competing Demands for Water: Integrating Agriculture Into a Robust Decision-Making Framework. Earths Future, 6, 1457-1470, doi:10.1002/2017ef000741.
- Koide, D., and A. Ito, 2018: Temporal changes in the relationship between tree-ring growth and net primary production in northern Japan: a novel approach to the estimation of seasonal photosynthate allocation to the stem. Ecological Research, 33, 1275-1287, doi:10.1007/s11284-018-1639-4.
- Kosaka, Y., 2018: Slow warming and the ocean see-saw. Nature Geoscience, 11, 12-13, doi:10.1038/s41561-017-0038-8.
- Kravtsov, S., C. Grimm, and S. Gu, 2018: Global-scale multidecadal variability missing in state-of-the-art climate models. Npj Climate and Atmospheric Science, 1, doi:10.1038/s41612-018-0044-6.
- Kudamatsu, M., 2018: GIS for Credible Identification Strategies in Economics Research. Cesifo Economic Studies, 64, 327-338, doi:10.1093/cesifo/ifx026.
- Kwon, Y. O., A. Camacho, C. Martinez, and H. Seo, 2018: North Atlantic winter eddy-driven jet and atmospheric blocking variability in the Community Earth System Model version 1 Large Ensemble simulations. Climate Dynamics, 51, 3275-3289, doi:10.1007/s00382-018-4078-6.
- Lai, A. W. C., M. Herzog, and H. F. Graf, 2018: ENSO Forecasts near the Spring Predictability Barrier and Possible Reasons for the Recently Reduced Predictability. J. Clim., 31, 815-838, doi:10.1175/jcli-d-17-0180.1.
- Laloyaux, P., and Coauthors, 2018: CERA-20C: A Coupled Reanalysis of the Twentieth Century. Journal of Advances in Modeling Earth Systems, 10, 1172-1195, doi:10.1029/2018ms001273.
- Lehner, F., C. Deser, I. R. Simpson, and L. Terray, 2018: Attributing the US Southwest's Recent Shift Into Drier Conditions. Geophysical Research Letters, 45, 6251-6261, doi:10.1029/2018gl078312.
- Levine, A. F. Z., D. M. W. Frierson, and M. J. McPhaden, 2018: AMO Forcing of Multidecadal Pacific ITCZ Variability. J. Clim., 31, 5749-5764, doi:10.1175/jcli-d-17-0810.1.
- Lewis, E., and Coauthors, 2018: A rule based quality control method for hourly rainfall data and a 1 km resolution gridded hourly rainfall dataset for Great Britain: CEH-GEAR1hr. Journal of Hydrology, 564, 930-943, doi:10.1016/j.jhydrol.2018.07.034.
- Lhotka, O., and A. Farda, 2018: Links between Temperature Biases and Flow Anomalies in an Ensemble of CNRM-CM5.1 Global Climate Model Historical Simulations. Advances in Meteorology, doi:10.1155/2018/4984827.
- Li, D. W., R. Zhang, and T. Knutson, 2018: Comparison of Mechanisms for Low-Frequency Variability of Summer Arctic Sea Ice in Three Coupled Models. J. Clim., 31, 1205-1226, doi:10.1175/jcli-d-16-0617.1.
- Li, G., J. P. Chen, X. Wang, and Y. K. Tan, 2018: Influence of the South Pacific decadal variability on Southeast China rainfall during boreal autumn. International Journal of Climatology, 38, E209-E223, doi:10.1002/joc.5363.
- Li, J., and B. Wang, 2018: Origins of the Decadal Predictability of East Asian Land Summer Monsoon Rainfall. J. Clim., 31, 6229-6243, doi:10.1175/jcli-d-17-0790.1.
- Li, R. X., and J. Q. Sun, 2018: Interdecadal variability of the large-scale extreme hot event frequency over the middle and lower reaches of the Yangtze River basin and its related atmospheric patterns. Atmospheric and Oceanic Science Letters, 11, 63-70, doi:10.1080/16742834.2017.1335580.
- Li, Y., B. Tinz, H. von Storch, Q. Y. Wang, Q. L. Zhou, and Y. N. Zhu, 2018: Construction of a surface air temperature series for Qingdao in China for the period 1899 to 2014. Earth System Science Data, 10, 643-652, doi:10.5194/essd-10-643-2018.
- Li, Y. L., W. Q. Han, A. X. Hu, G. A. Meehl, and F. Wang, 2018: Multidecadal Changes of the Upper Indian Ocean Heat Content during 1965-2016. J. Clim., 31, 7863-7884, doi:10.1175/jcli-d-18-0116.1.
- Lian, T., Z. Q. Shen, J. Ying, Y. M. Tang, J. D. Li, and Z. Ling, 2018: Investigating the Uncertainty in Global SST Trends Due to Internal Variations Using an Improved Trend Estimator. Journal of Geophysical Research-Oceans, 123, 1877-1895, doi:10.1002/2017jc013410.
- Lin, Y. H., and S. Y. S. Wang, 2018: Multidecadal Variability in the Subseasonal Peak of Low-Level Convergence over the Pacific Warm Pool. Atmosphere, 9, doi:10.3390/atmos9050158.
- Lionello, P., and L. Scarascia, 2018: The relation between climate change in the Mediterranean region and global warming. Regional Environmental Change, 18, 1481-1493, doi:10.1007/s10113-018-1290-1.
- Liu, B., G. Huang, K. M. Hu, R. G. Wu, H. N. Gong, P. F. Wang, and G. J. Zhao, 2018: The multidecadal variations of the interannual relationship between the East Asian summer monsoon and ENSO in a coupled model. Climate Dynamics, 51, 1671-1686, doi:10.1007/s00382-017-3976-3.
- Liu, C. L., and R. P. Allan, 2018: Unrealistic Increases in Wind Speed Explain Reduced Eastern Pacific Heat Flux in Reanalyses. J. Clim., 31, 2981-2993, doi:10.1175/jcli-d-17-0642.1.
- Liu, J. P., H. L. Ren, W. J. Li, and J. Q. Zuo, 2018: Remarkable Impacts of Indian Ocean Sea Surface Temperature on Interdecadal Variability of Summer Rainfall in Southwestern China. Atmosphere, 9, doi:10.3390/atmos9030103.
- Lovejoy, S., 2018: Spectra, intermittency, and extremes of weather, macroweather and climate. Scientific Reports, 8, doi:10.1038/s41598-018-30829-4.
- Lubken, F. J., U. Berger, and G. Baumgarten, 2018: On the Anthropogenic Impact on Long-Term Evolution of Noctilucent Clouds. Geophysical Research Letters, 45, 6681-6689, doi:10.1029/2018gl077719.
- Luo, F. F., S. L. Li, and T. Furevik, 2018: Weaker connection between the Atlantic Multidecadal Oscillation and Indian summer rainfall since the mid-1990s. Atmospheric and Oceanic Science Letters, 11, 37-43, doi:10.1080/16742834.2018.1394779.
- Luo, F. F., S. L. Li, Y. Q. Gao, N. Keenlyside, L. Svendsen, and T. Furevik, 2018: The connection between the Atlantic multidecadal oscillation and the Indian summer monsoon in CMIP5 models. Climate Dynamics, 51, 3023-3039, doi:10.1007/s00382-017-4062-6.
- Ma, T. J., W. Chen, D. Nath, H. F. Graf, L. Wang, and J. L. Huangfu, 2018: East Asian Winter Monsoon Impacts the ENSO-related Teleconnections and North American Seasonal Air Temperature Prediction. Scientific Reports, 8, doi:10.1038/s41598-018-24552-3.
- Magee, A. D., and D. C. Verdon-Kidd, 2018: On the relationship between Indian Ocean sea surface temperature variability and tropical cyclogenesis in the southwest Pacific. International Journal of Climatology, 38, E774-E795, doi:10.1002/joc.5406.
- Malik, A., and S. Bronnimann, 2018: Factors affecting the inter-annual to centennial timescale variability of Indian summer monsoon rainfall. Climate Dynamics, 50, 4347-4364, doi:10.1007/s00382-017-3879-3.
- Mamalakis, A., and E. Foufoula-Georgiou, 2018: A Multivariate Probabilistic Framework for Tracking the Intertropical Convergence Zone: Analysis of Recent Climatology and Past Trends. Geophysical Research Letters, 45, 13080-13089, doi:10.1029/2018gl079865.
- Mamalakis, A., J. Y. Yu, J. T. Randerson, A. AghaKouchak, and E. Foufoula-Georgiou, 2018: A new interhemispheric teleconnection increases predictability of winter precipitation in southwestern US. Nature Communications, 9, doi:10.1038/s41467-018-04722-7.
- Manney, G. L., and M. I. Hegglin, 2018: Seasonal and Regional Variations of Long-Term Changes in Upper-Tropospheric Jets from Reanalyses. J. Clim., 31, 423-448, doi:10.1175/jcli-d-17-0303.1.
- Martineau, P., S. W. Son, M. Taguchi, and A. H. Butler, 2018: A comparison of the momentum budget in reanalysis datasets during sudden stratospheric warming events. Atmospheric Chemistry and Physics, 18, 7169-7187, doi:10.5194/acp-18-7169-2018.
- Martineau, P., J. S. Wright, N. L. Zhu, and M. Fujiwara, 2018: Zonal-mean data set of global atmospheric reanalyses on pressure levels. Earth System Science Data, 10, 1925-1941, doi:10.5194/essd-10-1925-2018.
- Masaki, Y., N. Hanasaki, K. Takahashi, and Y. Hijioka, 2018: Consequences of implementing a reservoir operation algorithm in a global hydrological model under multiple meteorological forcing. Hydrological Sciences Journal-Journal Des Sciences Hydrologiques, 63, 1047-1061, doi:10.1080/02626667.2018.1473872.
- May, J. H., and Coauthors, 2018: Evolution of sandstone peak-forest landscapes - insights from quantifying erosional processes with cosmogenic nuclides. Earth Surface Processes and Landforms, 43, 639-653, doi:10.1002/esp.4273.
- McGraw, M. C., and E. A. Barnes, 2018: Memory Matters: A Case for Granger Causality in Climate Variability Studies. J. Clim., 31, 3289-3300, doi:10.1175/jcli-d-17-0334.1.
- McGregor, S., M. F. Stuecker, J. B. Kajtar, M. H. England, and M. Collins, 2018: Model tropical Atlantic biases underpin diminished Pacific decadal variability. Nature Climate Change, 8, 493-+, doi:10.1038/s41558-018-0163-4.
- McKinnon, K. A., and C. Deser, 2018: Internal Variability and Regional Climate Trends in an Observational Large Ensemble. J. Clim., 31, 6783-6802, doi:10.1175/jcli-d-17-0901.1.
- Mellado-Cano, J., D. Barriopedro, R. Garcia-Herrera, R. M. Trigo, and M. C. Alvarez-Castro, 2018: Euro-Atlantic Atmospheric Circulation during the Late Maunder Minimum. J. Clim., 31, 3849-3863, doi:10.1175/jcli-d-17-0261.1.
- Menary, M. B., and Coauthors, 2018: Preindustrial Control Simulations With HadGEM3-GC3.1 for CMIP6. Journal of Advances in Modeling Earth Systems, 10, 3049-3075, doi:10.1029/2018ms001495.
- Miao, J. P., T. Wang, H. J. Wang, and J. Q. Sun, 2018: Interannual Weakening of the Tropical Pacific Walker Circulation Due to Strong Tropical Volcanism. Advances in Atmospheric Sciences, 35, 645-658, doi:10.1007/s00376-017-7134-y.
- Misra, U., A. Deshamukhya, S. Sharma, and S. Pal, 2018: Simulation of Daily Rainfall from Concurrent Meteorological Parameters over Core Monsoon Region of India: A Novel Approach. Advances in Meteorology, doi:10.1155/2018/3053640.
- Mo, K. C., and D. P. Lettenmaier, 2018: Drought Variability and Trends over the Central United States in the Instrumental Record. Journal of Hydrometeorology, 19, 1149-1166, doi:10.1175/jhm-d-17-0225.1.
- Moller, M., and J. Kohler, 2018: Differing Climatic Mass Balance Evolution Across Svalbard Glacier Regions Over 1900-2010. Frontiers in Earth Science, 6, doi:10.3389/feart.2018.00128.
- Muilwijk, M., L. H. Smedsrud, M. Ilicak, and H. Drange, 2018: Atlantic Water Heat Transport Variability in the 20th Century Arctic Ocean From a Global Ocean Model and Observations. Journal of Geophysical Research-Oceans, 123, 8159-8179, doi:10.1029/2018jc014327.
- Nagaraju, C., K. Ashok, T. M. B. Nair, Z. Y. Guan, and W. J. Cai, 2018: Potential influence of the Atlantic Multi-decadal Oscillation in modulating the biennial relationship between Indian and Australian summer monsoons. International Journal of Climatology, 38, 5220-5230, doi:10.1002/joc.5722.
- Nangombe, S., T. J. Zhou, W. X. Zhang, B. Wu, S. Hu, L. W. Zou, and D. H. Li, 2018: Record-breaking climate extremes in Africa under stabilized 1.5 degrees C and 2 degrees C global warming scenarios. Nature Climate Change, 8, 375-+, doi:10.1038/s41558-018-0145-6.
- O'Reilly, C. H., 2018: Interdecadal variability of the ENSO teleconnection to the wintertime North Pacific. Climate Dynamics, 51, 3333-3350, doi:10.1007/s00382-018-4081-y.
- O'Reilly, C. H., and L. Zanna, 2018: The Signature of Oceanic Processes in Decadal Extratropical SST Anomalies. Geophysical Research Letters, 45, 7719-7730, doi:10.1029/2018gl079077.
- Ols, C., M. P. Girardin, A. Hofgaard, Y. Bergeron, and I. Drobyshev, 2018: Monitoring Climate Sensitivity Shifts in Tree-Rings of Eastern Boreal North America Using Model-Data Comparison. Ecosystems, 21, 1042-1057, doi:10.1007/s10021-017-0203-3.
- Oshima, K., K. Ogata, H. Park, and Y. Tachibana, 2018: Influence of atmospheric internal variability on the long-term Siberian water cycle during the past 2 centuries. Earth System Dynamics, 9, 497-506, doi:10.5194/esd-9-497-2018.
- Ozturk, U., N. Marwan, S. von Specht, O. Korup, and J. Jensen, 2018: A New Centennial Sea-Level Record for Antalya, Eastern Mediterranean. Journal of Geophysical Research-Oceans, 123, 4503-4517, doi:10.1029/2018jc013906.
- Panyushkina, I. P., and Coauthors, 2018: Runoff variations in Lake Balkhash Basin, Central Asia, 1779-2015, inferred from tree rings. Climate Dynamics, 51, 3161-3177, doi:10.1007/s00382-018-4072-z.
- Paprotny, D., A. Sebastian, O. Morales-Napoles, and S. N. Jonkman, 2018: Trends in flood losses in Europe over the past 150 years. Nature Communications, 9, doi:10.1038/s41467-018-04253-1.
- Parsons, L. A., S. Coats, and J. T. Overpeck, 2018: The Continuum of Drought in Southwestern North America. J. Clim., 31, 8627-8643, doi:10.1175/jcli-d-18-0010.1.
- Partridge, T. F., J. M. Winter, E. C. Osterberg, D. W. Hyndman, A. D. Kendall, and F. J. Magilligan, 2018: Spatially Distinct Seasonal Patterns and Forcings of the US Warming Hole. Geophysical Research Letters, 45, 2055-2063, doi:10.1002/2017gl076463.
- Pasternack, A., J. Bhend, M. A. Liniger, H. W. Rust, W. A. Muller, and U. Ulbrich, 2018: Parametric decadal climate forecast recalibration (DeFoReSt 1.0). Geoscientific Model Development, 11, 351-368, doi:10.5194/gmd-11-351-2018.
- Pei, L., and Z. W. Yan, 2018: Diminishing clear winter skies in Beijing towards a possible future. Environmental Research Letters, 13, doi:10.1088/1748-9326/aaf032.
- Pei, L., Z. W. Yan, Z. B. Sun, S. G. Miao, and Y. Yao, 2018: Increasing persistent haze in Beijing: potential impacts of weakening East Asian winter monsoons associated with northwestern Pacific sea surface temperature trends. Atmospheric Chemistry and Physics, 18, 3173-3183, doi:10.5194/acp-18-3173-2018.
- Pereira, S., A. M. Ramos, L. Rebelo, R. M. Trigo, and J. L. Zezere, 2018: A centennial catalogue of hydro-geomorphological events and their atmospheric forcing. Advances in Water Resources, 122, 98-112, doi:10.1016/j.advwatres.2018.10.001.
- Perez-Zanon, N., M. C. Casas-Castillo, J. C. Pena, M. Aran, R. Rodriguez-Sola, A. Redano, and G. Sole, 2018: Analysis of synoptic patterns in relationship with severe rainfall events in the Ebre Observatory (Catalonia). Acta Geophysica, 66, 405-414, doi:10.1007/s11600-018-0126-1.
- Pillar, H. R., H. L. Johnson, D. P. Marshall, P. Heimbach, and S. Takao, 2018: Impacts of Atmospheric Reanalysis Uncertainty on Atlantic Overturning Estimates at 25 degrees N. J. Clim., 31, 8719-8744, doi:10.1175/JCLI-D-18-0241.s1.
- Pingree-Shippee, K. A., F. W. Zwiers, and D. E. Atkinson, 2018: Representation of mid-latitude North American coastal storm activity by six global reanalyses. International Journal of Climatology, 38, 1041-1059, doi:10.1002/joc.5235.
- Pohl, B., B. Dieppois, J. Cretat, D. Lawler, and M. Rouault, 2018: From Synoptic to Interdecadal Variability in Southern African Rainfall: Toward a Unified View across Time Scales. J. Clim., 31, 5845-5872, doi:10.1175/jcli-d-17-0405.1.
- Polashenski, D. J., and Coauthors, 2018: Denali Ice Core Methanesulfonic Acid Records North Pacific Marine Primary Production. Journal of Geophysical Research-Atmospheres, 123, 4642-4653, doi:10.1029/2017jd028123.
- Poli, P., and P. Brunel, 2018: Assessing reanalysis quality with early sounders Nimbus-4 IRIS (1970) and Nimbus-6 HIRS (1975). Advances in Space Research, 62, 245-264, doi:10.1016/j.asr.2018.04.022.
- Potter, G. L., L. Carriere, J. Hertz, M. Bosilovich, D. Duffy, T. Lee, and D. N. Williams, 2018: Enabling Reanalysis Research Using the Collaborative Reanalysis Technical Environment (CREATE). Bulletin of the American Meteorological Society, 99, 677-687, doi:10.1175/bams-d-17-0174.1.
- Qin, M. H., D. L. Li, A. G. Dai, W. J. Hua, and H. D. Ma, 2018: The influence of the Pacific Decadal Oscillation on North Central China precipitation during boreal autumn. International Journal of Climatology, 38, E821-E831, doi:10.1002/joc.5410.
- Ramu, D. A., J. S. Chowdary, S. Ramakrishna, and O. Kumar, 2018: Diversity in the representation of large-scale circulation associated with ENSO-Indian summer monsoon teleconnections in CMIP5 models. Theoretical and Applied Climatology, 132, 465-478, doi:10.1007/s00704-017-2092-y.
- Ray, S., A. T. Wittenberg, S. M. Griffies, and F. R. Zeng, 2018: Understanding the Equatorial Pacific Cold Tongue Time-Mean Heat Budget. Part I: Diagnostic Framework. J. Clim., 31, 9965-9985, doi:10.1175/jcli-d-18-0152.1.
- Rikus, L., 2018: A simple climatology of westerly jet streams in global reanalysis datasets part 1: mid-latitude upper tropospheric jets. Climate Dynamics, 50, 2285-2310, doi:10.1007/s00382-015-2560-y.
- Rodrigues, D., M. C. Alvarez-Castro, G. Messori, P. Yiou, Y. Robin, and D. Faranda, 2018: Dynamical Properties of the North Atlantic Atmospheric Circulation in the Past 150 Years in CMIP5 Models and the 20CRv2c Reanalysis. J. Clim., 31, 6097-6111, doi:10.1175/jcli-d-17-0176.1.
- Rohrer, M., S. Bronnimann, O. Martius, C. C. Raible, M. Wild, and G. P. Compo, 2018: Representation of Extratropical Cyclones, Blocking Anticyclones, and Alpine Circulation Types in Multiple Reanalyses and Model Simulations. J. Clim., 31, 3009-3031, doi:10.1175/jcli-d-17-0350.1.
- Romps, D. M., A. B. Charn, R. H. Holzworth, W. E. Lawrence, J. Molinari, and D. Vollaro, 2018: CAPE Times P Explains Lightning Over Land But Not the Land-Ocean Contrast. Geophysical Research Letters, 45, 12623-12630, doi:10.1029/2018gl080267.
- Roy, I., 2018: Addressing on Abrupt Global Warming, Warming Trend Slowdown and Related Features in Recent Decades. Frontiers in Earth Science, 6, doi:10.3389/feart.2018.00136.
- Ruprich-Robert, Y., T. Delworth, R. Msadek, F. Castruccio, S. Yeager, and G. Danabasoglu, 2018: Impacts of the Atlantic Multidecadal Variability on North American Summer Climate and Heat Waves. J. Clim., 31, 3679-3700, doi:10.1175/jcli-d-17-0270.1.
- Sachindra, D. A., K. Ahmed, M. M. Rashid, S. Shahid, and B. J. C. Perera, 2018: Statistical downscaling of precipitation using machine learning techniques. Atmospheric Research, 212, 240-258, doi:10.1016/j.atmosres.2018.05.022.
- Sadikni, R., and Coauthors, 2018: The KLIWAS North Sea Climatology. Part I: Processing of the Atmospheric Data. Journal of Atmospheric and Oceanic Technology, 35, 111-126, doi:10.1175/jtech-d-17-0044.1.
- Salvatteci, R., and Coauthors, 2018: Multifarious anchovy and sardine regimes in the Humboldt Current System during the last 150 years. Global Change Biology, 24, 1055-1068, doi:10.1111/gcb.13991.
- Santamaria-Aguilar, S., and A. T. Vafeidis, 2018: Are Extreme Skew Surges Independent of High Water Levels in a Mixed Semidiurnal Tidal Regime? Journal of Geophysical Research-Oceans, 123, 8877-8886, doi:10.1029/2018jc014282.
- Santos, M., M. Fragoso, and J. A. Santos, 2018: Damaging flood severity assessment in Northern Portugal over more than 150 years (1865-2016). Natural Hazards, 91, 983-1002, doi:10.1007/s11069-017-3166-y.
- Saurral, R. I., F. J. Doblas-Reyes, and J. Garcia-Serrano, 2018: Observed modes of sea surface temperature variability in the South Pacific region. Climate Dynamics, 50, 1129-1143, doi:10.1007/s00382-017-3666-1.
- Schade, N. H., R. Sadikni, A. Jahnke-Bornemann, I. Hinrichs, L. Gates, B. Tinz, and D. Stammer, 2018: The KLIWAS North Sea Climatology. Part II: Assessment against Global Reanalyses. Journal of Atmospheric and Oceanic Technology, 35, 127-145, doi:10.1175/jtech-d-17-0045.1.
- Schneider, D. P., and R. L. Fogt, 2018: Artifacts in Century-Length Atmospheric and Coupled Reanalyses Over Antarctica Due To Historical Data Availability. Geophysical Research Letters, 45, 964-973, doi:10.1002/2017gl076226.
- Seim, A., and Coauthors, 2018: Evaluation of Tree Growth Relevant Atmospheric Circulation Patterns for Geopotential Height Field Reconstructions for Asia. J. Clim., 31, 4391-4401, doi:10.1175/jcli-d-17-0164.1.
- Sherin, V. R., F. Durand, V. V. Gopalkrishna, S. Anuvinda, A. V. S. Chaitanya, R. Bourdalle-Badie, and F. Papa, 2018: Signature of Indian Ocean Dipole on the western boundary current of the Bay of Bengal. Deep-Sea Research Part I-Oceanographic Research Papers, 136, 91-106, doi:10.1016/j.dsr.2018.04.002.
- Shields, C. A., and Coauthors, 2018: Atmospheric River Tracking Method Intercomparison Project (ARTMIP): project goals and experimental design. Geoscientific Model Development, 11, 2455-2474, doi:10.5194/gmd-11-2455-2018.
- Shin, S. J., and S. I. An, 2018: Interdecadal Change in the Relationship Between the North Pacific Oscillation and the Pacific Meridional Mode and Its Impact on ENSO. Asia-Pacific Journal of Atmospheric Sciences, 54, 63-76, doi:10.1007/s13143-017-0060-1.
- Shu, Q., F. L. Qiao, Z. Y. Song, and Y. J. Song, 2018: Link between the Barents Oscillation and recent boreal winter cooling over the Asian midlatitudes. Advances in Atmospheric Sciences, 35, 127-132, doi:10.1007/s00376-017-7021-6.
- Simpson, I. R., C. Deser, K. A. McKinnon, and E. A. Barnes, 2018: Modeled and Observed Multidecadal Variability in the North Atlantic Jet Stream and Its Connection to Sea Surface Temperatures. J. Clim., 31, 8313-8338, doi:10.1175/jcli-d-18-0168.1.
- Sjolte, J., C. Sturm, F. Adolphi, B. M. Vinther, M. Werner, G. Lohmann, and R. Muscheler, 2018: Solar and volcanic forcing of North Atlantic climate inferred from a process-based reconstruction. Climate of the Past, 14, 1179-1194, doi:10.5194/cp-14-1179-2018.
- Skliris, N., J. D. Zika, L. Herold, S. A. Josey, and R. Marsh, 2018: Mediterranean sea water budget long-term trend inferred from salinity observations. Climate Dynamics, 51, 2857-2876, doi:10.1007/s00382-017-4053-7.
- Slivinski, L. C., 2018: Historical Reanalysis: What, How, and Why? Journal of Advances in Modeling Earth Systems, 10, 1736-1739, doi:10.1029/2018ms001434.
- Song, X. S., Y. M. Tang, and D. K. Chen, 2018: Decadal Variation in IOD Predictability During 1881-2016. Geophysical Research Letters, 45, 12948-12956, doi:10.1029/2018gl080221.
- Soon, W. W. H., and Coauthors, 2018: Comparing the current and early 20th century warm periods in China. Earth-Science Reviews, 185, 80-101, doi:10.1016/j.earscirev.2018.05.013.
- Srinivas, G., J. S. Chowdary, Y. Kosaka, C. Gnanaseelan, A. Parekh, and K. Prasad, 2018: Influence of the Pacific-Japan Pattern on Indian Summer Monsoon Rainfall. J. Clim., 31, 3943-3958, doi:10.1175/jcli-d-17-0408.1.
- Staehelin, J., P. Viatte, R. Stubi, F. Tummon, and T. Peter, 2018: Stratospheric ozone measurements at Arosa (Switzerland): history and scientific relevance. Atmospheric Chemistry and Physics, 18, 6567-6584, doi:10.5194/acp-18-6567-2018.
- Steinig, S., J. Harlass, W. Park, and M. Latif, 2018: Sahel rainfall strength and onset improvements due to more realistic Atlantic cold tongue development in a climate model. Scientific Reports, 8, doi:10.1038/s41598-018-20904-1.
- Steinschneider, S., M. Ho, A. P. Williams, E. R. Cook, and U. Lall, 2018: A 500-Year Tree Ring-Based Reconstruction of Extreme Cold-Season Precipitation and Number of Atmospheric River Landfalls Across the Southwestern United States. Geophysical Research Letters, 45, 5672-5680, doi:10.1029/2018gl078089.
- Stopa, J. E., 2018: Wind forcing calibration and wave hindcast comparison using multiple reanalysis and merged satellite wind datasets. Ocean Modelling, 127, 55-69, doi:10.1016/j.ocemod.2018.04.008.
- Stucki, P., and Coauthors, 2018: Reconstruction and simulation of an extreme flood event in the Lago Maggiore catchment in 1868. Natural Hazards and Earth System Sciences, 18, 2717-2739, doi:10.5194/nhess-18-2717-2018.
- Sun, Q. H., C. Y. Miao, Q. Y. Duan, H. Ashouri, S. Sorooshian, and K. L. Hsu, 2018: A Review of Global Precipitation Data Sets: Data Sources, Estimation, and Intercomparisons. Reviews of Geophysics, 56, 79-107, doi:10.1002/2017rg000574.
- Sung, M. K., S. H. Kim, B. M. Kim, and Y. S. Choi, 2018: Interdecadal Variability of the Warm Arctic and Cold Eurasia Pattern and Its North Atlantic Origin. J. Clim., 31, 5793-5810, doi:10.1175/jcli-d-17-0562.1.
- Svarva, H. L., T. Thun, A. J. Kirchhefer, and A. Nesje, 2018: Little Ice Age summer temperatures in western Norway from a 700-year tree-ring chronology. Holocene, 28, 1609-1622, doi:10.1177/0959683618782611.
- Svendsen, L., N. Keenlyside, I. Bethke, Y. Q. Gao, and N. E. Omrani, 2018: Pacific contribution to the early twentieth-century warming in the Arctic. Nature Climate Change, 8, 793-+, doi:10.1038/s41558-018-0247-1.
- Tabari, H., and P. Willems, 2018: Lagged influence of Atlantic and Pacific climate patterns on European extreme precipitation. Scientific Reports, 8, doi:10.1038/s41598-018-24069-9.
- Tahir, Z. R., and M. Asim, 2018: Surface measured solar radiation data and solar energy resource assessment of Pakistan: A review. Renewable & Sustainable Energy Reviews, 81, 2839-2861, doi:10.1016/j.rser.2017.06.090. Tahir, Z. U., and Coauthors, 2018: Comparison of Reanalysis, Analysis and Forecast datasets with measured wind data for a Wind Power Project in Jhimpir, Pakistan. Windeurope Conference 2018 within the Global Wind Summit, M. Muskulus, and C. L. Bottasso, Eds.
- Thomas, Z., and Coauthors, 2018: A New Daily Observational Record from Grytviken, South Georgia: Exploring Twentieth-Century Extremes in the South Atlantic. J. Clim., 31, 1743-1755, doi:10.1175/jcli-d-17-0353.1.
- Tian, Z. P., T. Li, and D. B. Jiang, 2018: Strengthening and Westward Shift of the Tropical Pacific Walker Circulation during the Mid-Holocene: PMIP Simulation Results. J. Clim., 31, 2283-2298, doi:10.1175/jcli-d-16-0744.1.
- Tifafi, M., B. Guenet, and C. Hatte, 2018: Large Differences in Global and Regional Total Soil Carbon Stock Estimates Based on SoilGrids, HWSD, and NCSCD: Intercomparison and Evaluation Based on Field Data From USA, England, Wales, and France. Global Biogeochemical Cycles, 32, 42-56, doi:10.1002/2017gb005678.
- Toride, K., D. L. Cawthorne, K. Ishida, M. L. Kavvas, and M. L. Anderson, 2018: Long-term trend analysis on total and extreme precipitation over Shasta Dam watershed. Science of the Total Environment, 626, 244-254, doi:10.1016/j.scitotenv.2018.01.004.
- Troccoli, A., and Coauthors, 2018: Creating a proof-of-concept climate service to assess future renewable energy mixes in Europe: An overview of the C3S ECEM project. Advances in Science and Research, 15, 191-205, doi:10.5194/asr-15-191-2018.
- Trouet, V., F. Babst, and M. Meko, 2018: Recent enhanced high-summer North Atlantic Jet variability emerges from three-century context. Nature Communications, 9, doi:10.1038/s41467-017-02699-3.
- Tsujino, H., and Coauthors, 2018: JRA-55 based surface dataset for driving ocean-sea-ice models (JRA55-do). Ocean Modelling, 130, 79-139, doi:10.1016/j.ocemod.2018.07.002.
- Tuovinen, J. P., P. Jokinen, and D. M. Schultz, 2018: Historical hail cases in Finland: 1776-1910. Boreal Environment Research, 23, 29-57, doi:Turkes, M., and E. Erlat, 2018: Variability and trends in record air temperature events of Turkey and their associations with atmospheric oscillations and anomalous circulation patterns. International Journal of Climatology, 38, 5182-5204, doi:10.1002/joc.5720.
- Ulazia, A., M. Penalba, A. Rabanal, G. Ibarra-Berastegi, J. Ringwood, and J. Saenz, 2018: Historical Evolution of the Wave Resource and Energy Production off the Chilean Coast over the 20th Century. Energies, 11, doi:10.3390/en11092289.
- Ummenhofer, C. C., M. Kuluke, and J. E. Tierney, 2018: Extremes in East African hydroclimate and links to Indo-Pacific variability on interannual to decadal timescales. Climate Dynamics, 50, 2971-2991, doi:10.1007/s00382-017-3786-7.
- Undorf, S., D. Polson, M. A. Bollasina, Y. Ming, A. Schurer, and G. C. Hegerl, 2018: Detectable Impact of Local and Remote Anthropogenic Aerosols on the 20th Century Changes of West African and South Asian Monsoon Precipitation. Journal of Geophysical Research-Atmospheres, 123, 4871-4889, doi:10.1029/2017jd027711.
- Vega, I., D. Gallego, P. Ribera, F. D. Gomez-Delgado, R. Garcia-Herrera, and C. Pena-Ortiz, 2018: Reconstructing the Western North Pacific Summer Monsoon since the Late Nineteenth Century. J. Clim., 31, 355-368, doi:10.1175/jcli-d-17-0336.1.
- Verdon-Kidd, D. C., 2018: On the classification of different flavours of Indian Ocean Dipole events. International Journal of Climatology, 38, 4924-4937, doi:10.1002/joc.5707.
- Villamayor, J., T. Ambrizzi, and E. Mohino, 2018: Influence of decadal sea surface temperature variability on northern Brazil rainfall in CMIP5 simulations. Climate Dynamics, 51, 563-579, doi:10.1007/s00382-017-3941-1.
- Walker, A. P., and Coauthors, 2018: The multi-assumption architecture and testbed (MAAT v1.0): R code for generating ensembles with dynamic model structure and analysis of epistemic uncertainty from multiple sources. Geoscientific Model Development, 11, 3159-3185, doi:10.5194/gmd-11-3159-2018.
- Walz, M. A., D. J. Befort, N. O. Kirchner-Bossi, U. Ulbrich, and G. C. Leckebusch, 2018: Modelling serial clustering and inter-annual variability of European winter windstorms based on large-scale drivers. International Journal of Climatology, 38, 3044-3057, doi:10.1002/joc.5481.
- Wang, B., and Coauthors, 2018: Toward Predicting Changes in the Land Monsoon Rainfall a Decade in Advance. J. Clim., 31, 2699-2714, doi:10.1175/jcli-d-17-0521.1.
- Wang, X., W. Tan, and C. Z. Wang, 2018: A new index for identifying different types of El Nino Modoki events. Climate Dynamics, 50, 2753-2765, doi:10.1007/s00382-017-3769-8.
- Ward, D. S., E. Shevliakova, S. Malyshev, and S. Rabin, 2018: Trends and Variability of Global Fire Emissions Due To Historical Anthropogenic Activities. Global Biogeochemical Cycles, 32, 122-142, doi:10.1002/2017gb005787.
- Wares, J. P., S. Crickenberger, A. F. Govindarajan, J. L. Hamrick, K. M. Skoczen, D. W. Trapnell, and D. S. Wethey, 2018: The cryptic population biology of Chthamalus fragilis Darwin, 1854 (Cirripedia, Thoracica) on the Atlantic coast of North America. Journal of Crustacean Biology, 38, 754-764, doi:10.1093/jcbiol/ruy070.
- Wilcox, L. J., and Coauthors, 2018: Multiple perspectives on the attribution of the extreme European summer of 2012 to climate change. Climate Dynamics, 50, 3537-3555, doi:10.1007/s00382-017-3822-7.
- Williamson, F., and Coauthors, 2018: Collating Historic Weather Observations for the East Asian Region: Challenges, Solutions, and Reanalyses. Advances in Atmospheric Sciences, 35, 899-904, doi:10.1007/s00376-017-7259-z.
- Willis, D. M., and Coauthors, 2018: Sunspot Observations on 10 and 11 February 1917: A Case Study in Collating Known and Previously Undocumented Records. Space Weather-the International Journal of Research and Applications, 16, 1740-1752, doi:10.1029/2018sw002012.
- Wills, R. C., T. Schneider, J. M. Wallace, D. S. Battisti, and D. L. Hartmann, 2018: Disentangling Global Warming, Multidecadal Variability, and El Nino in Pacific Temperatures. Geophysical Research Letters, 45, 2487-2496, doi:10.1002/2017gl076327.
- Wise, E. K., C. A. Woodhouse, G. J. McCabe, G. T. Pederson, and J. M. St-Jacques, 2018: Hydroclimatology of the Missouri River Basin. Journal of Hydrometeorology, 19, 161-182, doi:10.1175/jhm-d-17-0155.1.
- Woodworth, P. L., 2018: Sea level change in Great Britain between 1859 and the present. Geophysical Journal International, 213, 222-236, doi:10.1093/gji/ggx538.
- Woollings, T., and Coauthors, 2018: Daily to Decadal Modulation of Jet Variability. J. Clim., 31, 1297-1314, doi:10.1175/jcli-d-17-0286.1.
- Wyard, C., S. Doutreloup, A. Belleflamme, M. Wild, and X. Fettweis, 2018: Global Radiative Flux and Cloudiness Variability for the Period 1959-2010 in Belgium: A Comparison between Reanalyses and the Regional Climate Model MAR. Atmosphere, 9, doi:10.3390/atmos9070262.
- Xiao, F., L. L. Zeng, Q. Y. Liu, W. Zhou, and D. X. Wang, 2018: Extreme subsurface warm events in the South China Sea during 1998/99 and 2006/07: observations and mechanisms. Climate Dynamics, 50, 115-128, doi:10.1007/s00382-017-3588-y.
- Xue, J. Q., C. Sun, J. P. Li, and J. Y. Mao, 2018: South Atlantic Forced Multidecadal Teleconnection to the Midlatitude South Indian Ocean. Geophysical Research Letters, 45, 8480-8489, doi:10.1029/2018gl078990.
- Yang, M. H., R. T. Zuo, L. Q. Wang, and X. Chen, 2018: A Simulation Study of Global Evapotranspiration Components Using the Community Land Model. Atmosphere, 9, doi:10.3390/atmos9050178.
- Yao, Y., Z. Zhong, and X. Q. Yang, 2018: Impacts of the subarctic frontal zone on the North Pacific storm track in the cold season: an observational study. International Journal of Climatology, 38, 2554-2564, doi:10.1002/joc.5429.
- Yao, Y., Z. Zhong, and X. Q. Yang, 2018: Influence of the subarctic front intensity on the midwinter suppression of the North Pacific storm track. Dynamics of Atmospheres and Oceans, 81, 63-72, doi:10.1016/j.dynatmoce.2018.01.001.
- Ye, X. C., Z. W. Wu, Z. M. Wang, H. Y. Shen, and J. M. Xu, 2018: Seasonal Prediction of the Yangtze River Runoff Using a Partial Least Squares Regression Model. Atmosphere-Ocean, 56, 117-128, doi:10.1080/07055900.2018.1448751.
- Yeager, S. G., and Coauthors, 2018: PREDICTING NEAR-TERM CHANGES IN THE EARTH SYSTEM A Large Ensemble of Initialized Decadal Prediction Simulations Using the Community Earth System Model. Bulletin of the American Meteorological Society, 99, 1867-1886, doi:10.1175/bams-d-17-0098.1.
- Yin, Z., and Coauthors, 2018: Evaluation of ORCHIDEE-MICT-simulated soil moisture over China and impacts of different atmospheric forcing data. Hydrology and Earth System Sciences, 22, 5463-5484, doi:10.5194/hess-22-5463-2018.
- Yiou, P., J. Cattiaux, A. Ribes, R. Vautard, and M. Vrac, 2018: Recent Trends in the Recurrence of North Atlantic Atmospheric Circulation Patterns. Complexity, doi:10.1155/2018/3140915.
- You, Y. J., and J. C. Furtado, 2018: The South Pacific Meridional Mode and Its Role in Tropical Pacific Climate Variability. J. Clim., 31, 10141-10163, doi:10.1175/jcli-d-17-0860.1.
- Yu, L. J., S. Y. Zhong, W. E. Heilman, and X. D. Bian, 2018: Trends in seasonal warm anomalies across the contiguous United States: Contributions from natural climate variability. Scientific Reports, 8, doi:10.1038/s41598-018-21817-9.
- Zhang, L., B. L. Gan, L. X. Wu, W. J. Cai, and H. Ma, 2018: Seasonal Dependence of Coupling between Storm Tracks and Sea Surface Temperature in the Southern Hemisphere Midlatitudes: A Statistical Assessment. J. Clim., 31, 4055-4074, doi:10.1175/jcli-d-17-0196.1.
- Zhang, L., and W. Q. Han, 2018: Impact of Ningaloo Nino on Tropical Pacific and an Interbasin Coupling Mechanism. Geophysical Research Letters, 45, 11300-11309, doi:10.1029/2018gl078579.
- Zhang, Q., Z. Y. Guan, and M. G. Li, 2018: The Eurasia-North Pacific Oscillation in atmospheric mass variations independent of both IHO and AO and its possible impacts on winter climate. Climate Dynamics, 50, 4303-4322, doi:10.1007/s00382-017-3876-6.
- Zhang, W. X., and Coauthors, 2018: Multiscale Variations of Precipitable Water over China Based on 1999-2015 Ground-Based GPS Observations and Evaluations of Reanalysis Products. J. Clim., 31, 945-962, doi:10.1175/jcli-d-17-0419.1.
- Zhang, Y. F., Y. Guo, W. J. Dong, and C. X. Li, 2018: What drives the decadal variation of global land monsoon precipitation over the past 50 years? International Journal of Climatology, 38, 4818-4829, doi:10.1002/joc.5699.
- Zhang, Y. L., Y. T. Wang, B. J. Huai, M. H. Ding, and W. J. Sun, 2018: Skill of the two 20th century reanalyses in representing Antarctic near-surface air temperature. International Journal of Climatology, 38, 4225-4238, doi:10.1002/joc.5563.
- Zhang, Z. R., P. Uotila, A. Stossel, T. Vihma, H. L. Liu, and Y. S. Zhong, 2018: Seasonal southern hemisphere multi-variable reflection of the southern annular mode in atmosphere and ocean reanalyses. Climate Dynamics, 50, 1451-1470, doi:10.1007/s00382-017-3698-6.
- Zhao, L., B. Han, S. H. Lv, L. J. Wen, X. H. Meng, and Z. G. Li, 2018: The different influence of the residual layer on the development of the summer convective boundary layer in two deserts in northwest China. Theoretical and Applied Climatology, 131, 877-888, doi:10.1007/s00704-016-2014-4.
- Zheng, J., Q. Y. Liu, and C. Y. Wang, 2018: An aftereffect of global warming on tropical Pacific decadal variability. Journal of Oceanology and Limnology, 36, 193-204, doi:10.1007/s00343-017-6267-2.
- Zheng, M. J., J. Sjolte, F. Adolphi, B. M. Vinther, H. C. Steen-Larsen, T. J. Popp, and R. Muscheler, 2018: Climate information preserved in seasonal water isotope at NEEM: relationships with temperature, circulation and sea ice. Climate of the Past, 14, 1067-1078, doi:10.5194/cp-14-1067-2018.
- Zhou, C. L., Y. Y. He, and K. C. Wang, 2018: On the suitability of current atmospheric reanalyses for regional warming studies over China. Atmospheric Chemistry and Physics, 18, 8113-8136, doi:10.5194/acp-18-8113-2018.
- Achuthavarier, D., S. D. Schubert, and Y. V. Vikhliaev, 2017: North Pacific decadal variability: insights from a biennial ENSO environment. Climate Dynamics, 49, 1379-1397, doi:10.1007/s00382-016-3391-1.
- Agnihotri, R., A. P. Dimri, H. M. Joshi, N. K. Verma, C. Sharma, J. Singh, and Y. P. Sundriyal, 2017: Assessing operative natural and anthropogenic forcing factors from long-term climate time series of Uttarakhand (India) in the backdrop of recurring extreme rainfall events over northwest Himalaya. Geomorphology, 284, 31-40, doi:10.1016/j.geomorph.2016.10.024.
- Allen, R. J., and M. Kovilakam, 2017: The Role of Natural Climate Variability in Recent Tropical Expansion. J. Clim., 30, 6329-6350, doi:10.1175/jcli-d-16-0735.1.
- Anderson, B. T., J. C. Furtado, E. Di Lorenzo, and D. J. S. Gianotti, 2017: Tracking the Pacific Decadal Precession. Journal of Geophysical Research-Atmospheres, 122, 3214-3227, doi:10.1002/2016jd025962.
- Andreadis, K. M., G. J. P. Schumann, D. Stampoulis, P. D. Bates, G. R. Brakenridge, and A. J. Kettner, 2017: Can Atmospheric Reanalysis Data Sets Be Used to Reproduce Flooding Over Large Scales? Geophysical Research Letters, 44, 10369-10377, doi:10.1002/2017gl075502.
- Andreoli, R. V., S. N. R. da Silva, R. A. F. de Souza, M. T. Kayano, S. R. Garcia, V. B. Capistrano, and E. Armijos, 2017: Intense drought and flooding events in the Rio Negro and relation with the tropical Pacific and Atlantic variability modes. Theoretical and Applied Climatology, 129, 551-576, doi:10.1007/s00704-016-1790-1.
- Andreoli, R. V., S. S. de Oliveira, M. T. Kayano, J. Viegas, R. A. F. de Souza, and L. A. Candido, 2017: The influence of different El Nino types on the South American rainfall. International Journal of Climatology, 37, 1374-1390, doi:10.1002/joc.4783.
- Andreu-Hayles, L., and Coauthors, 2017: 400 Years of summer hydroclimate from stable isotopes in Iberian trees. Climate Dynamics, 49, 143-161, doi:10.1007/s00382-016-3332-z.
- Arns, A., S. Dangendorf, J. Jensen, S. Talke, J. Bender, and C. Pattiaratchi, 2017: Sea-level rise induced amplification of coastal protection design heights. Scientific Reports, 7, doi:10.1038/srep40171.
- Aubry, T. J., A. M. Jellinek, G. Carazzo, R. Gallo, K. Hatcher, and J. Dunning, 2017: A new analytical scaling for turbulent wind-bent plumes: Comparison of scaling laws with analog experiments and a new database of eruptive conditions for predicting the height of volcanic plumes. Journal of Volcanology and Geothermal Research, 343, 233-251, doi:10.1016/j.jvolgeores.2017.07.006.
- Azad, R., and A. Sorteberg, 2017: Extreme daily precipitation in coastal western Norway and the link to atmospheric rivers. Journal of Geophysical Research-Atmospheres, 122, 2080-2095, doi:10.1002/2016jd025615.
- Barcikowska, M., F. Feser, W. Zhang, and W. Mei, 2017: Changes in intense tropical cyclone activity for the western North Pacific during the last decades derived from a regional climate model simulation. Climate Dynamics, 49, 2931-2949, doi:10.1007/s00382-016-3420-0.
- Barcikowska, M. J., T. R. Knutson, and R. Zhang, 2017: Observed and Simulated Fingerprints of Multidecadal Climate Variability and Their Contributions to Periods of Global SST Stagnation. J. Clim., 30, 721-737, doi:10.1175/jcli-d-16-0443.1.
- Barnes, E. A., and I. R. Simpson, 2017: Seasonal Sensitivity of the Northern Hemisphere Jet Streams to Arctic Temperatures on Subseasonal Time Scales. J. Clim., 30, 10117-10137, doi:10.1175/jcli-d-17-0299.1.
- Barth, N. A., G. Villarini, M. A. Nayak, and K. White, 2017: Mixed populations and annual flood frequency estimates in the western United States: The role of atmospheric rivers. Water Resources Research, 53, 257-269, doi:10.1002/2016wr019064.
- Bartoszek, K., S. Wereski, A. Krzyzewska, and M. Dobek, 2017: The influence of atmospheric circulation on bioclimatic conditions in Lublin (Poland). Bulletin of Geography-Physical Geography Series, 12, 41-49, doi:10.1515/bgeo-2017-0004.
- Belmecheri, S., F. Babst, A. R. Hudson, J. Betancourt, and V. Trouet, 2017: Northern Hemisphere Jet Stream Position Indices as Diagnostic Tools for Climate and Ecosystem Dynamics. Earth Interactions, 21, 1-23, doi:10.1175/ei-d-16-0023.1.
- Berry, D. I., and E. C. Kent, 2017: Assessing the health of the in situ global surface marine climate observing system. International Journal of Climatology, 37, 2248-2259, doi:10.1002/joc.4914.
- Bett, P. E., H. E. Thornton, and R. T. Clark, 2017: Using the Twentieth Century Reanalysis to assess climate variability for the European wind industry. Theoretical and Applied Climatology, 127, 61-80, doi:10.1007/s00704-015-1591-y.
- Bierstedt, S. E., B. Hunicke, E. Zorita, and J. Ludwig, 2017: A wind proxy based on migrating dunes at the Baltic coast: statistical analysis of the link between wind conditions and sand movement. Earth System Dynamics, 8, 639-652, doi:10.5194/esd-8-639-2017.
- Bischoff, T., T. Schneider, and A. N. Meckler, 2017: A Conceptual Model for the Response of Tropical Rainfall to Orbital Variations. J. Clim., 30, 8375-8391, doi:10.1175/jcli-d-16-0691.1.
- Bonnet, R., J. Bae, G. Dayon, and E. Martin, 2017: Twentieth-Century Hydrometeorological Reconstructions to Study the Multidecadal Variations of the Water Cycle Over France. Water Resources Research, 53, 8366-8382, doi:10.1002/2017wr020596.
- Bordbar, M. H., T. Martin, M. Latif, and W. Park, 2017: Role of internal variability in recent decadal to multidecadal tropical Pacific climate changes. Geophysical Research Letters, 44, 4246-4255, doi:10.1002/2016gl072355.
- Borodina, A., E. M. Fischer, and R. Knutti, 2017: Potential to Constrain Projections of Hot Temperature Extremes. J. Clim., 30, 9949-9964, doi:10.1175/jcli-d-16-0848.1.
- Bosilovich, M. G., F. R. Robertson, L. Takacs, A. Molod, and D. Mocko, 2017: Atmospheric Water Balance and Variability in the MERRA-2 Reanalysis. J. Clim., 30, 1177-1196, doi:10.1175/jcli-d-16-0338.1.
- Boucher, E., A. Nicault, D. Arseneault, Y. Begin, and M. P. Karami, 2017: Decadal Variations in Eastern Canada's Taiga Wood Biomass Production Forced by Ocean-Atmosphere Interactions. Scientific Reports, 7, doi:10.1038/s41598-017-02580-9.
- Brands, S., J. M. Gutierrez, and D. San-Martin, 2017: Twentieth-century atmospheric river activity along the west coasts of Europe and North America: algorithm formulation, reanalysis uncertainty and links to atmospheric circulation patterns. Climate Dynamics, 48, 2771-2795, doi:10.1007/s00382-016-3095-6.
- Brazdil, R., and Coauthors, 2017: The extraordinary windstorm of 7 December 1868 in the Czech Lands and its central European context. International Journal of Climatology, 37, 14-29, doi:10.1002/joc.4973.
- Breivik, O., and O. J. Aarnes, 2017: Efficient bootstrap estimates for tail statistics. Natural Hazards and Earth System Sciences, 17, 357-366, doi:10.5194/nhess-17-357-2017.
- Bronnimann, S., and Coauthors, 2017: Tropical circulation and precipitation response to ozone depletion and recovery. Environmental Research Letters, 12, doi:10.1088/1748-9326/aa7416.
- Butler, A. H., J. P. Sjoberg, D. J. Seidel, and K. H. Rosenlof, 2017: A sudden stratospheric warming compendium. Earth System Science Data, 9, 63-76, doi:10.5194/essd-9-63-2017.
- Caillouet, L., J. P. Vidal, E. Sauquet, A. Devers, and B. Graff, 2017: Ensemble reconstruction of spatio-temporal extreme low-flow events in France since 1871. Hydrology and Earth System Sciences, 21, 2923-2951, doi:10.5194/hess-21-2923-2017.
- Cao, B., S. Gruber, and T. J. Zhang, 2017: REDCAPP (v1.0): parameterizing valley inversions in air temperature data downscaled from reanalyses. Geoscientific Model Development, 10, 2905-2923, doi:10.5194/gmd-10-2905-2017.
- Carella, G., E. C. Kent, and D. I. Berry, 2017: A probabilistic approach to ship voyage reconstruction in ICOADS. International Journal of Climatology, 37, 2233-2247, doi:10.1002/joc.4492.
- Carella, G., and Coauthors, 2017: Measurements and models of the temperature change of water samples in sea-surface temperature buckets. Quarterly Journal of the Royal Meteorological Society, 143, 2198-2209, doi:10.1002/qj.3078.
- Carrillo, C. M., C. L. Castro, H. I. Chang, and T. M. Luong, 2017: Multi-year climate variability in the Southwestern United States within a context of a dynamically downscaled twentieth century reanalysis. Climate Dynamics, 49, 4217-4236, doi:10.1007/s00382-017-3569-1.
- Cerrone, D., G. Fusco, Y. Cotroneo, I. Simmonds, and G. Budillon, 2017: The Antarctic Circumpolar Wave: Its Presence and Interdecadal Changes during the Last 142 Years. J. Clim., 30, 6371-6389, doi:10.1175/jcli-d-16-0646.1.
- Choi, Y. W., and J. B. Ahn, 2017: The Effect of Boreal Late Autumn Snow Cover over Western and Central China on the Northern Hemisphere Wintertime Blocking Frequency. J. Clim., 30, 9027-9039, doi:10.1175/jcli-d-16-0830.1.
- Chowdary, J. S., H. S. Harsha, C. Gnanaseelan, G. Srinivas, A. Parekh, P. Pillai, and C. V. Naidu, 2017: Indian summer monsoon rainfall variability in response to differences in the decay phase of El Nio. Climate Dynamics, 48, 2707-2727, doi:10.1007/s00382-016-3233-1.
- Christensen, H. M., J. Berner, D. R. B. Coleman, and T. N. Palmer, 2017: Stochastic Parameterization and El Nino-Southern Oscillation. J. Clim., 30, 17-38, doi:10.1175/jcli-d-16-0122.1.
- Christiansen, B., and F. C. Ljungqvist, 2017: Challenges and perspectives for large-scale temperature reconstructions of the past two millennia. Reviews of Geophysics, 55, 40-96, doi:10.1002/2016rg000521.
- Cialone, M. A., A. S. Grzegorzewski, D. J. Mark, M. A. Bryant, and T. C. Massey, 2017: Coastal-Storm Model Development and Water-Level Validation for the North Atlantic Coast Comprehensive Study. Journal of Waterway Port Coastal and Ocean Engineering, 143, doi:10.1061/(asce)ww.1943-5460.0000408.
- Cid, A., P. Camus, S. Castanedo, F. J. Mendez, and R. Medina, 2017: Global reconstructed daily surge levels from the 20th Century Reanalysis (1871-2010). Global and Planetary Change, 148, 9-21, doi:10.1016/j.gloplacha.2016.11.006.
- Cieslikiewicz, W., A. Dudkowska, G. Gic-Grusza, and J. Jedrasik, 2017: Extreme bottom velocities induced by wind wave and currents in the Gulf of GdaA"sk. Ocean Dynamics, 67, 1461-1480, doi:10.1007/s10236-017-1098-4.
- Conroy, J. L., A. M. Hudson, J. T. Overpeck, K. B. Liu, L. Wang, and J. E. Cole, 2017: The primacy of multidecadal to centennial variability over late-Holocene forced change of the Asian Monsoon on the southern Tibetan Plateau. Earth and Planetary Science Letters, 458, 337-348, doi:10.1016/j.epsl.2016.10.044.
- Cornes, R. C., P. D. Jones, and C. Qian, 2017: Twentieth-Century Trends in the Annual Cycle of Temperature across the Northern Hemisphere. J. Clim., 30, 5755-5773, doi:10.1175/jcli-d-16-0315.1.
- Correa, S. W., R. C. D. de Paiva, J. C. Espinoza, and W. Collischonn, 2017: Multi-decadal Hydrological Retrospective: Case study of Amazon floods and droughts. Journal of Hydrology, 549, 667-684, doi:10.1016/j.jhydrol.2017.04.019. Coumou, D., K. Kornhuber, J. Lehmann, and V. Petoukhov, 2017: Weakened Flow, Persistent Circulation, and Prolonged Weather Extremes in Boreal Summer. Climate Extremes: Patterns and Mechanisms, S. Y. S. Wang, J. H. Yoon, C. C. Funk, and R. R. Gillies, Eds., 61-73.
- Cowan, T., G. C. Hegerl, I. Colfescu, M. Bollasina, A. Purich, and G. Boschat, 2017: Factors Contributing to Record-Breaking Heat Waves over the Great Plains during the 1930s Dust Bowl. J. Clim., 30, 2437-2461, doi:10.1175/jcli-d-16-0436.1.
- Cradden, L. C., F. McDermott, L. Zubiate, C. Sweeney, and M. O'Malley, 2017: A 34-year simulation of wind generation potential for Ireland and the impact of large-scale atmospheric pressure patterns. Renewable Energy, 106, 165-176, doi:10.1016/j.renene.2016.12.079.
- Cui, W. J., X. Q. Dong, B. K. Xi, and A. Kennedy, 2017: Evaluation of Reanalyzed Precipitation Variability and Trends Using the Gridded Gauge-Based Analysis over the CONUS. Journal of Hydrometeorology, 18, 2227-2248, doi:10.1175/jhm-d-17-0029.1.
- D'Agostino, R., and P. Lionello, 2017: Evidence of global warming impact on the evolution of the Hadley Circulation in ECMWF centennial reanalyses. Climate Dynamics, 48, 3047-3060, doi:10.1007/s00382-016-3250-0. Dafka, S., A. Toreti, J. Luterbacher, P. Zanis, E. Tyrlis, and E. Xoplaki, 2017: Do RCMs Accurately Simulate the Etesians Climatology? Perspectives on Atmospheric Sciences, T. S. Karacostas, A. F. Bais, and P. T. Nastos, Eds., 591-597.
- Dai, A. G., and T. B. Zhao, 2017: Uncertainties in historical changes and future projections of drought. Part I: estimates of historical drought changes. Climatic Change, 144, 519-533, doi:10.1007/s10584-016-1705-2.
- Dai, N., and P. A. Arkin, 2017: Twentieth century ENSO-related precipitation mean states in twentieth century reanalysis, reconstructed precipitation and CMIP5 models. Climate Dynamics, 48, 3061-3083, doi:10.1007/s00382-016-3251-z.
- Dangendorf, S., M. Marcos, G. Woppelmannc, C. P. Conrad, T. Frederikse, and R. Riva, 2017: Reassessment of 20th century global mean sea level rise. Proceedings of the National Academy of Sciences of the United States of America, 114, 5946-5951, doi:10.1073/pnas.1616007114.
- Dannenberg, M. P., and E. K. Wise, 2017: Shifting Pacific storm tracks as stressors to ecosystems of western North America. Global Change Biology, 23, 4896-4906, doi:10.1111/gcb.13748.
- Davis, J. L., and N. T. Vinogradova, 2017: Causes of accelerating sea level on the East Coast of North America. Geophysical Research Letters, 44, 5133-5141, doi:10.1002/2017gl072845.
- Deser, C., J. W. Hurrell, and A. S. Phillips, 2017: The role of the North Atlantic Oscillation in European climate projections. Climate Dynamics, 49, 3141-3157, doi:10.1007/s00382-016-3502-z.
- DiNezio, P. N., and Coauthors, 2017: A 2 Year Forecast for a 60-80% Chance of La Nina in 2017-2018. Geophysical Research Letters, 44, 11624-11635, doi:10.1002/2017gl074904.
- Ding, S. Y., W. Chen, J. Feng, and H. F. Graf, 2017: Combined Impacts of PDO and Two Types of La Nina on Climate Anomalies in Europe. J. Clim., 30, 3253-3278, doi:10.1175/jcli-d-16-0376.1.
- Diouf, I., and Coauthors, 2017: Comparison of Malaria Simulations Driven by Meteorological Observations and Reanalysis Products in Senegal. International Journal of Environmental Research and Public Health, 14, doi:10.3390/ijerph14101119.
- Dixon, B. C., J. J. Tyler, A. M. Lorrey, I. D. Goodwin, J. Gergis, and R. N. Drysdale, 2017: Low-resolution Australasian palaeoclimate records of the last 2000 years. Climate of the Past, 13, 1403-1433, doi:10.5194/cp-13-1403-2017.
- Dominguez-Castro, F., and Coauthors, 2017: Early meteorological records from Latin-America and the Caribbean during the 18th and 19th centuries. Scientific Data, 4, doi:10.1038/sdata.2017.169.
- Douville, H., Y. Peings, and D. Saint-Martin, 2017: Snow-(N)AO relationship revisited over the whole twentieth century. Geophysical Research Letters, 44, 569-577, doi:10.1002/2016gl071584.
- Etling, D., 2017: Meteorological aspects of Salomon August Andree's attempt to reach the North Pole by balloon in 1897 based on 20CR data. Meteorologische Zeitschrift, 26, 567-580, doi:10.1127/metz/2017/0853.
- Eyre, J., and X. B. Zeng, 2017: Evaluation of Greenland near surface air temperature datasets. Cryosphere, 11, 1591-1605, doi:10.5194/tc-11-1591-2017.
- Fan, F. X., X. Dong, X. H. Fang, F. Xue, F. Zheng, and J. Zhu, 2017: Revisiting the relationship between the South Asian summer monsoon drought and El Nino warming pattern. Atmospheric Science Letters, 18, 175-182, doi:10.1002/asl.740.
- Fasullo, J. T., R. Tomas, S. Stevenson, B. Otto-Bliesner, E. Brady, and E. Wahl, 2017: The amplifying influence of increased ocean stratification on a future year without a summer. Nature Communications, 8, doi:10.1038/s41467-017-01302-z.
- Fereday, D., 2017: How Persistent Are North Atlantic-European Sector Weather Regimes? J. Clim., 30, 2381-2394, doi:10.1175/jcli-d-16-0328.1.
- Ferguson, C. R., and D. M. Mocko, 2017: Diagnosing an Artificial Trend in NLDAS-2 Afternoon Precipitation. Journal of Hydrometeorology, 18, 1051-1070, doi:10.1175/jhm-d-16-0251.1.
- Fettweis, X., and Coauthors, 2017: Reconstructions of the 1900-2015 Greenland ice sheet surface mass balance using the regional climate MAR model. Cryosphere, 11, 1015-1033, doi:10.5194/tc-11-1015-2017.
- Fita, L., J. P. Evans, D. Argueso, A. King, and Y. Liu, 2017: Evaluation of the regional climate response in Australia to large-scale climate modes in the historical NARCliM simulations. Climate Dynamics, 49, 2815-2829, doi:10.1007/s00382-016-3484-x.
- Flanagan, P. X., J. B. Basara, and X. M. Xiao, 2017: Long-term analysis of the asynchronicity between temperature and precipitation maxima in the United States Great Plains. International Journal of Climatology, 37, 3919-3933, doi:10.1002/joc.4966.
- Fogt, R. L., C. A. Goergens, J. M. Jones, D. P. Schneider, J. P. Nicolas, D. H. Bromwich, and H. E. Dusselier, 2017: A twentieth century perspective on summer Antarctic pressure change and variability and contributions from tropical SSTs and ozone depletion. Geophysical Research Letters, 44, 9918-9927, doi:10.1002/2017gl075079.
- Fogt, R. L., M. E. Jones, S. Solomon, J. M. Jones, and C. A. Goergens, 2017: AN EXCEPTIONAL SUMMER DURING THE SOUTH POLE RACE OF 1911/12. Bulletin of the American Meteorological Society, 98, 2189-2200, doi:10.1175/bams-d-17-0013.1.
- Fortunato, A. B., P. Freire, X. Bertin, M. Rodrigues, J. Ferreira, and M. L. R. Liberato, 2017: A numerical study of the February 15, 1941 storm in the Tagus estuary. Continental Shelf Research, 144, 50-64, doi:10.1016/j.csr.2017.06.023.
- Franke, J., S. Bronnimann, J. Bhend, and Y. Brugnara, 2017: A monthly global paleo-reanalysis of the atmosphere from 1600 to 2005 for studying past climatic variations. Scientific Data, 4, doi:10.1038/sdata.2017.76.
- Frederikse, T., K. Simon, C. A. Katsman, and R. Riva, 2017: The sea-level budget along the Northwest Atlantic coast: GIA, mass changes, and large-scale ocean dynamics. Journal of Geophysical Research-Oceans, 122, 5486-5501, doi:10.1002/2017jc012699.
- Frederiksen, C. S., J. S. Frederiksen, J. M. Sisson, and S. L. Osbrough, 2017: Trends and projections of Southern Hemisphere baroclinicity: the role of external forcing and impact on Australian rainfall. Climate Dynamics, 48, 3261-3282, doi:10.1007/s00382-016-3263-8.
- Freeman, E., and Coauthors, 2017: ICOADS Release 3.0: a major update to the historical marine climate record. International Journal of Climatology, 37, 2211-2232, doi:10.1002/joc.4775.
- Friedman, A. R., G. Reverdin, M. Khodri, and G. Gastineau, 2017: A new record of Atlantic sea surface salinity from 1896 to 2013 reveals the signatures of climate variability and long-term trends. Geophysical Research Letters, 44, 1866-1876, doi:10.1002/2017gl072582.
- Fujiwara, M., and Coauthors, 2017: Introduction to the SPARC Reanalysis Intercomparison Project (S-RIP) and overview of the reanalysis systems. Atmospheric Chemistry and Physics, 17, 1417-1452, doi:10.5194/acp-17-1417-2017. Funk, C., and A. Hoell, 2017: Recent Climate Extremes Associated with the West Pacific Warming Mode. Climate Extremes: Patterns and Mechanisms, S. Y. S. Wang, J. H. Yoon, C. C. Funk, and R. R. Gillies, Eds., 165-176.
- Furukawa, R., R. Uemura, K. Fujita, J. Sjolte, K. Yoshimura, S. Matoba, and Y. Iizuka, 2017: Seasonal-Scale Dating of a Shallow Ice Core From Greenland Using Oxygen Isotope Matching Between Data and Simulation. Journal of Geophysical Research-Atmospheres, 122, 10873-10887, doi:10.1002/2017jd026716.
- Gallego, D., R. Garcia-Herrera, C. Pena-Ortiz, and P. Ribera, 2017: The steady enhancement of the Australian Summer Monsoon in the last 200 years. Scientific Reports, 7, doi:10.1038/s41598-017-16414-1.
- Gampe, D., and R. Ludwig, 2017: Evaluation of Gridded Precipitation Data Products for Hydrological Applications in Complex Topography. Hydrology, 4, doi:10.3390/hydrology4040053.
- Gan, B. L., and Coauthors, 2017: On the Response of the Aleutian Low to Greenhouse Warming. J. Clim., 30, 3907-3925, doi:10.1175/jcli-d-15-0789.1.
- Gelaro, R., and Coauthors, 2017: The Modern-Era Retrospective Analysis for Research and Applications, Version 2 (MERRA-2). J. Clim., 30, 5419-5454, doi:10.1175/jcli-d-16-0758.1.
- Gershunov, A., T. Shulgina, F. M. Ralph, D. A. Lavers, and J. J. Rutz, 2017: Assessing the climate-scale variability of atmospheric rivers affecting western North America. Geophysical Research Letters, 44, 7900-7908, doi:10.1002/2017gl074175.
- Ghelani, R. P. S., E. C. J. Oliver, N. J. Holbrook, M. C. Wheeler, and P. J. Klotzbach, 2017: Joint Modulation of Intraseasonal Rainfall in Tropical Australia by the Madden-Julian Oscillation and El Nino-Southern Oscillation. Geophysical Research Letters, 44, 10754-10761, doi:10.1002/2017gl075452.
- Ghosh, R., W. A. Muller, J. Baehr, and J. Bader, 2017: Impact of observed North Atlantic multidecadal variations to European summer climate: a linear baroclinic response to surface heating. Climate Dynamics, 48, 3547-3563, doi:10.1007/s00382-016-3283-4.
- Gic-Grusza, G., and A. Dudkowska, 2017: Numerical modeling of hydrodynamics and sediment transport-an integrated approach. Ocean Dynamics, 67, 1283-1292, doi:10.1007/s10236-017-1085-9.
- Glotter, M., and J. Elliott, 2017: Simulating US agriculture in a modern Dust Bowl drought. Nature Plants, 3, doi:10.1038/nplants.2016.193.
- Grainger, S., C. S. Frederiksen, and X. G. Zheng, 2017: Projections of Southern Hemisphere atmospheric circulation interannual variability. Climate Dynamics, 48, 1187-1211, doi:10.1007/s00382-016-3135-2.
- Green, B., J. Marshall, and A. Donohoe, 2017: Twentieth century correlations between extratropical SST variability and ITCZ shifts. Geophysical Research Letters, 44, 9039-9047, doi:10.1002/2017gl075044.
- Groth, A., Y. Feliks, D. Kondrashov, and M. Ghil, 2017: Interannual Variability in the North Atlantic Ocean's Temperature Field and Its Association with the Wind Stress Forcing. J. Clim., 30, 2655-2678, doi:10.1175/jcli-d-16-0370.1.
- Guan, X. D., J. P. Huang, and R. X. Guo, 2017: Changes in Aridity in Response to the Global Warming Hiatus. Journal of Meteorological Research, 31, 117-125, doi:10.1007/s13351-017-6038-1.
- Guo, Y. Y., M. F. Ting, Z. P. Wen, and D. E. Lee, 2017: Distinct Patterns of Tropical Pacific SST Anomaly and Their Impacts on North American Climate. J. Clim., 30, 5221-5241, doi:10.1175/jcli-d-16-0488.1.
- Hall, R. J., J. M. Jones, E. Hanna, A. A. Scaife, and R. Erdelyi, 2017: Drivers and potential predictability of summer time North Atlantic polar front jet variability. Climate Dynamics, 48, 3869-3887, doi:10.1007/s00382-016-3307-0.
- Han, B., and Coauthors, 2017: Global Land Surface Climate Analysis Based on the Calculation of a Modified Bowen Ratio. Advances in Atmospheric Sciences, 34, 663-678, doi:10.1007/s00376-016-6175-y.
- Hao, X., and S. P. He, 2017: Combined Effect of ENSO-Like and Atlantic Multidecadal Oscillation SSTAs on the Interannual Variability of the East Asian Winter Monsoon. J. Clim., 30, 2697-2716, doi:10.1175/jcli-d-16-0118.1.
- Hawkins, E., and Coauthors, 2017: ESTIMATING CHANGES IN GLOBAL TEMPERATURE SINCE THE PREINDUSTRIAL PERIOD. Bulletin of the American Meteorological Society, 98, 1841-1856, doi:10.1175/bams-d-16-0007.1.
- Henke, L. M. K., F. H. Lambert, and D. J. Charman, 2017: Was the Little Ice Age more or less El Nino-like than the Medieval Climate Anomaly? Evidence from hydrological and temperature proxy data. Climate of the Past, 13, 267-301, doi:10.5194/cp-13-267-2017.
- Herold, N., L. Alexander, D. Green, and M. Donat, 2017: Greater increases in temperature extremes in low versus high income countries. Environmental Research Letters, 12, doi:10.1088/1748-9326/aa5c43.
- Hersbach, H., and Coauthors, 2017: The potential value of early (1939-1967) upper-air data in atmospheric climate reanalysis. Quarterly Journal of the Royal Meteorological Society, 143, 1197-1210, doi:10.1002/qj.3040.
- Hoell, A., M. Barlow, F. Cannon, and T. Y. Xu, 2017: Oceanic Origins of Historical Southwest Asia Precipitation During the Boreal Cold Season. J. Clim., 30, 2885-2903, doi:10.1175/jcli-d-16-0519.1.
- Holland, M. M., L. Landrum, Y. Kostov, and J. Marshall, 2017: Sensitivity of Antarctic sea ice to the Southern Annular Mode in coupled climate models. Climate Dynamics, 49, 1813-1831, doi:10.1007/s00382-016-3424-9.
- Hu, Z. Y., Q. M. Zhou, X. Chen, C. Qian, S. S. Wang, and J. F. Li, 2017: Variations and changes of annual precipitation in Central Asia over the last century. International Journal of Climatology, 37, 157-170, doi:10.1002/joc.4988.
- Huang, J. P., Y. K. Xie, X. D. Guan, D. D. Li, and F. Ji, 2017: The dynamics of the warming hiatus over the Northern Hemisphere. Climate Dynamics, 48, 429-446, doi:10.1007/s00382-016-3085-8.
- Huang, W. Y., R. Y. Chen, Z. F. Yang, B. Wang, and W. Q. Ma, 2017: Exploring the combined effects of the Arctic Oscillation and ENSO on the wintertime climate over East Asia using self-organizing maps. Journal of Geophysical Research-Atmospheres, 122, 9107-9129, doi:10.1002/2017jd026812.
- Huang, Y. Y., X. Q. Dong, B. K. Xi, E. K. Dolinar, R. E. Stanfield, and S. Y. Qiu, 2017: Quantifying the Uncertainties of Reanalyzed Arctic Cloud and Radiation Properties Using Satellite Surface Observations. J. Clim., 30, 8007-8029, doi:10.1175/jcli-d-16-0722.1.
- Ishida, K., and M. L. Kavvas, 2017: Climate change analysis on historical watershed-scale precipitation by means of long-term dynamical downscaling. Hydrological Processes, 31, 35-50, doi:10.1002/hyp.10932.
- Jacques, A. A., J. D. Horel, E. T. Crosman, and F. L. Vernon, 2017: Tracking Mesoscale Pressure Perturbations Using the USArray Transportable Array. Monthly Weather Review, 145, 3119-3142, doi:10.1175/mwr-d-16-0450.1.
- Jayawardena, I., W. L. Sumathipala, and B. Basnayake, 2017: Impact of Madden Julian oscillation (MJO) and other meteorological phenomena on the heavy rainfall event from 19th-28th December, 2014 over Sri Lanka. Journal of the National Science Foundation of Sri Lanka, 45, 101-111, doi:10.4038/jnsfsr.v45i2.8176.
- Jia, F., D. X. Hu, S. J. Hu, and J. Q. Feng, 2017: Nino4 as a Key Region for the Interannual Variability of the Western Pacific Warm Pool. Journal of Geophysical Research-Oceans, 122, 9299-9314, doi:10.1002/2017jc013208.
- Jones, A. C., J. M. Haywood, N. Dunstone, K. Emanuel, M. K. Hawcroft, K. I. Hodges, and A. Jones, 2017: Impacts of hemispheric solar geoengineering on tropical cyclone frequency. Nature Communications, 8, doi:10.1038/s41467-017-01606-0.
- Jones, P. D., and Coauthors, 2017: Using ERA-Interim reanalysis for creating datasets of energy-relevant climate variables. Earth System Science Data, 9, 471-495, doi:10.5194/essd-9-471-2017.
- Karspeck, A. R., and Coauthors, 2017: Comparison of the Atlantic meridional overturning circulation between 1960 and 2007 in six ocean reanalysis products. Climate Dynamics, 49, 957-982, doi:10.1007/s00382-015-2787-7.
- Keller, J. D., L. Delle Monache, and S. Alessandrini, 2017: Statistical Downscaling of a High-Resolution Precipitation Reanalysis Using the Analog Ensemble Method. Journal of Applied Meteorology and Climatology, 56, 2081-2095, doi:10.1175/jamc-d-16-0380.1. Klotzbach, P. J., M. A. Saunders, G. D. Bell, and E. S. Blake, 2017: North Atlantic Seasonal Hurricane Prediction: Underlying Science and an Evaluation of Statistical Models. Climate Extremes: Patterns and Mechanisms, S. Y. S. Wang, J. H. Yoon, C. C. Funk, and R. R. Gillies, Eds., 315-328.
- Kolstad, E. W., 2017: Causal Pathways for Temperature Predictability from Snow Depth. J. Clim., 30, 9651-9663, doi:10.1175/jcli-d-17-0280.1.
- Kolstad, E. W., E. A. Barnes, and S. P. Sobolowski, 2017: Quantifying the role of land-atmosphere feedbacks in mediating near-surface temperature persistence. Quarterly Journal of the Royal Meteorological Society, 143, 1620-1631, doi:10.1002/qj.3033.
- Kravtsov, S., 2017: Comment on "Comparison of Low-Frequency Internal Climate Variability in CMIP5 Models and Observations''. J. Clim., 30, 9763-9772, doi:10.1175/jcli-d-17-0438.1.
- Kravtsov, S., 2017: Pronounced differences between observed and CMIP5-simulated multidecadal climate variability in the twentieth century. Geophysical Research Letters, 44, 5749-5757, doi:10.1002/2017gl074016.
- Kravtsov, S., P. Roebber, and V. Brazauskas, 2017: A virtual climate library of surface temperature over North America for 1979-2015. Scientific Data, 4, doi:10.1038/sdata.2017.155.
- Krishnamurthy, L., and V. Krishnamurthy, 2017: Indian monsoon's relation with the decadal part of PDO in observations and NCAR CCSM4. International Journal of Climatology, 37, 1824-1833, doi:10.1002/joc.4815.
- Kuchar, A., and Coauthors, 2017: On the aliasing of the solar cycle in the lower stratospheric tropical temperature. Journal of Geophysical Research-Atmospheres, 122, 9076-9093, doi:10.1002/2017jd026948.
- Lang, T. J., and Coauthors, 2017: WMO WORLD RECORD LIGHTNING EXTREMES Longest Reported Flash Distance and Longest Reported Flash Duration. Bulletin of the American Meteorological Society, 98, 1153-1168, doi:10.1175/bams-d-16-0061.1.
- Lavergne, A., and Coauthors, 2017: Modelling tree ring cellulose delta O-18 variations in two temperature-sensitive tree species from North and South America. Climate of the Past, 13, 1515-1526, doi:10.5194/cp-13-1515-2017.
- Lee, S. K., D. L. Volkov, H. Lopez, W. G. Cheon, A. L. Gordon, Y. Y. Liu, and R. Wanninkhof, 2017: Wind-driven ocean dynamics impact on the contrasting sea-ice trends around West Antarctica. Journal of Geophysical Research-Oceans, 122, 4413-4430, doi:10.1002/2016jc012416.
- Lehner, F., C. Deser, and L. Terray, 2017: Toward a New Estimate of "Time of Emergence'' of Anthropogenic Warming: Insights from Dynamical Adjustment and a Large Initial-Condition Model Ensemble. J. Clim., 30, 7739-7756, doi:10.1175/jcli-d-16-0792.1.
- Lewis, K., 2017: Understanding climate as a driver of food insecurity in Ethiopia. Climatic Change, 144, 317-328, doi:10.1007/s10584-017-2036-7.
- Li, C., J. J. Luo, and S. L. Li, 2017: Impacts of Different Types of ENSO on the Interannual Seesaw between the Somali and the Maritime Continent Cross-Equatorial Flows. J. Clim., 30, 2621-2638, doi:10.1175/jcli-d-16-0521.1.
- Li, G., J. P. Chen, X. Wang, Y. K. Tan, and X. H. Jiang, 2017: Modulation of Pacific Decadal Oscillation on the relationship of El Nino with southern China rainfall during early boreal winter. Atmospheric Science Letters, 18, 336-341, doi:10.1002/asl.761.
- Li, J., B. Wang, and Y. M. Yang, 2017: Retrospective seasonal prediction of summer monsoon rainfall over West Central and Peninsular India in the past 142 years. Climate Dynamics, 48, 2581-2596, doi:10.1007/s00382-016-3225-1.
- Li, M. X., Z. G. Ma, H. P. Gu, Q. Yang, and Z. Y. Zheng, 2017: Production of a combined land surface data set and its use to assess land-atmosphere coupling in China. Journal of Geophysical Research-Atmospheres, 122, 948-965, doi:10.1002/2016jd025511.
- Li, Q. X., L. Zhang, W. H. Xu, T. J. Zhou, J. F. Wang, P. M. Zhai, and P. Jones, 2017: COMPARISONS OF TIME SERIES OF ANNUAL MEAN SURFACE AIR TEMPERATURE FOR CHINA SINCE THE 1900S. Bulletin of the American Meteorological Society, 98, 699-711, doi:10.1175/bams-d-16-0092.1.
- Li, X. L., and Coauthors, 2017: The East Asian summer monsoon variability over the last 145 years inferred from the Shihua Cave record, North China. Scientific Reports, 7, doi:10.1038/s41598-017-07251-3.
- Liu, G., P. Zhao, and J. M. Chen, 2017: Possible Effect of the Thermal Condition of the Tibetan Plateau on the Interannual Variability of the Summer Asian-Pacific Oscillation. J. Clim., 30, 9965-9977, doi:10.1175/jcli-d-17-0079.1.
- Liu, Z. F., Y. L. Tang, Z. M. Jian, C. J. Poulsen, J. M. Welker, and G. J. Bowen, 2017: Pacific North American circulation pattern links external forcing and North American hydroclimatic change over the past millennium. Proceedings of the National Academy of Sciences of the United States of America, 114, 3340-3345, doi:10.1073/pnas.1618201114.
- Liu, Z. F., K. Yoshimura, N. Buenning, Z. M. Jian, and L. Zhao, 2017: The response of winter Pacific North American pattern to strong volcanic eruptions. Climate Dynamics, 48, 3599-3614, doi:10.1007/s00382-016-3287-0.
- Long, C. S., M. Fujiwara, S. Davis, D. M. Mitchell, and C. J. Wright, 2017: Climatology and interannual variability of dynamic variables in multiple reanalyses evaluated by the SPARC Reanalysis Intercomparison Project (S-RIP). Atmospheric Chemistry and Physics, 17, 14593-14629, doi:10.5194/acp-17-14593-2017.
- Loughran, T. F., S. E. Perkins-Kirkpatrick, and L. V. Alexander, 2017: Understanding the spatio-temporal influence of climate variability on Australian heatwaves. International Journal of Climatology, 37, 3963-3975, doi:10.1002/joc.4971.
- Loughran, T. F., S. E. Perkins-Kirkpatrick, L. V. Alexander, and A. J. Pitman, 2017: No significant difference between Australian heat wave impacts of Modoki and eastern Pacific El Nino. Geophysical Research Letters, 44, 5150-5157, doi:10.1002/2017gl073231.
- Lovejoy, S., 2017: How accurately do we know the temperature of the surface of the earth? Climate Dynamics, 49, 4089-4106, doi:10.1007/s00382-017-3561-9.
- Lubbecke, J. F., and M. J. McPhaden, 2017: Symmetry of the Atlantic Nino mode. Geophysical Research Letters, 44, 965-973, doi:10.1002/2016gl071829.
- Lyu, K., J. Y. Yu, and H. Paek, 2017: The Influences of the Atlantic Multidecadal Oscillation on the Mean Strength of the North Pacific Subtropical High during Boreal Winter. J. Clim., 30, 411-426, doi:10.1175/jcli-d-16-0525.1.
- Lyu, K. W., X. B. Zhang, J. A. Church, J. Y. Hu, and J. Y. Yu, 2017: Distinguishing the Quasi-Decadal and Multidecadal Sea Level and Climate Variations in the Pacific: Implications for the ENSO-Like Low-Frequency Variability. J. Clim., 30, 5097-5117, doi:10.1175/jcli-d-17-0004.1.
- Madrigal-Gonzalez, J., and Coauthors, 2017: Forest productivity in southwestern Europe is controlled by coupled North Atlantic and Atlantic Multidecadal Oscillations. Nature Communications, 8, doi:10.1038/s41467-017-02319-0.
- Magee, A. D., D. C. Verdon-Kidd, H. J. Diamond, and A. S. Kiem, 2017: Influence of ENSO, ENSO Modoki, and the IPO on tropical cyclogenesis: a spatial analysis of the southwest Pacific region. International Journal of Climatology, 37, 1118-1137, doi:10.1002/joc.5070.
- Malevich, S. B., and C. A. Woodhouse, 2017: Pacific sea surface temperatures, midlatitude atmospheric circulation, and widespread interannual anomalies in western US streamflow. Geophysical Research Letters, 44, 5123-5132, doi:10.1002/2017gl073536.
- Malik, A., and Coauthors, 2017: Decadal to multi-decadal scale variability of Indian summer monsoon rainfall in the coupled ocean-atmosphere-chemistry climate model SOCOL-MPIOM. Climate Dynamics, 49, 3551-3572, doi:10.1007/s00382-017-3529-9.
- Masaki, Y., and Coauthors, 2017: Intercomparison of global river discharge simulations focusing on dam operation-multiple models analysis in two case-study river basins, Missouri-Mississippi and Green-Colorado. Environmental Research Letters, 12, doi:10.1088/1748-9326/aa57a8.
- Masina, S., and A. Storto, 2017: Reconstructing the recent past ocean variability: Status and perspective. Journal of Marine Research, 75, 727-764, doi:McAfee, S. A., 2017: Uncertainty in Pacific decadal oscillation indices does not contribute to teleconnection instability. International Journal of Climatology, 37, 3509-3516, doi:10.1002/joc.4918.
- McKinnon, K. A., A. Poppick, E. Dunn-Sigouin, and C. Deser, 2017: An "Observational Large Ensemble'' to Compare Observed and Modeled Temperature Trend Uncertainty due to Internal Variability. J. Clim., 30, 7585-7598, doi:10.1175/jcli-d-16-0905.1.
- Medvedev, I. P., A. B. Rabinovich, and E. A. Kulikov, 2017: The pole tide/14-month oscillations in the Baltic Sea during the 19th and 20th centuries: Spatial and temporal variations. Continental Shelf Research, 137, 117-130, doi:10.1016/j.csr.2017.02.001.
- Miller, A. J., and Coauthors, 2017: Coupled ocean-atmosphere modeling and predictions. Journal of Marine Research, 75, 361-402, doi:Moore, G. W. K., and M. Babij, 2017: Iceland's Great Frost Winter of 1917/1918 and its representation in reanalyses of the twentieth century. Quarterly Journal of the Royal Meteorological Society, 143, 508-520, doi:10.1002/qj.2939.
- Mouyen, M., A. Canitano, B. F. Chao, Y. J. Hsu, P. Steer, L. Longuevergne, and J. P. Boy, 2017: Typhoon-Induced Ground Deformation. Geophysical Research Letters, 44, 11004-11011, doi:10.1002/2017gl075615.
- Munday, C., and R. Washington, 2017: Circulation controls on southern African precipitation in coupled models: The role of the Angola Low. Journal of Geophysical Research-Atmospheres, 122, 861-877, doi:10.1002/2016jd025736.
- Munoz, S. E., and S. G. Dee, 2017: El Nino increases the risk of lower Mississippi River flooding. Scientific Reports, 7, doi:10.1038/s41598-017-01919-6.
- Munz, P. M., A. Luckge, M. Siccha, A. Boll, S. Forke, M. Kucera, and H. Schulz, 2017: The Indian winter monsoon and its response to external forcing over the last two and a half centuries. Climate Dynamics, 49, 1801-1812, doi:10.1007/s00382-016-3403-1.
- Naiman, Z., P. J. Goodman, J. P. Krasting, S. L. Malyshev, J. L. Russell, R. J. Stouffer, and A. T. Wittenberg, 2017: Impact of Mountains on Tropical Circulation in Two Earth System Models. J. Clim., 30, 4149-4163, doi:10.1175/jcli-d-16-0512.1.
- Nath, D., W. Chen, and X. Q. Lan, 2017: Long-Term Trend in Potential Vorticity Intrusion Events over the Pacific Ocean: Role of Global Mean Temperature Rise. Journal of Meteorological Research, 31, 906-915, doi:10.1007/s13351-017-7021-6.
- Nayak, M. A., and G. Villarini, 2017: A long-term perspective of the hydroclimatological impacts of atmospheric rivers over the central United States. Water Resources Research, 53, 1144-1166, doi:10.1002/2016wr019033.
- Nidheesh, A. G., M. Lengaigne, J. Vialard, T. Izumo, A. S. Unnikrishnan, and C. Cassou, 2017: Influence of ENSO on the Pacific decadal oscillation in CMIP models. Climate Dynamics, 49, 3309-3326, doi:10.1007/s00382-016-3514-8.
- Nilsen, I. B., J. H. Stagge, and L. M. Tallaksen, 2017: A probabilistic approach for attributing temperature changes to synoptic type frequency. International Journal of Climatology, 37, 2990-3002, doi:10.1002/joc.4894.
- O'Reilly, C. H., T. Woollings, and L. Zanna, 2017: The Dynamical Influence of the Atlantic Multidecadal Oscillation on Continental Climate. J. Clim., 30, 7213-7230, doi:10.1175/jcli-d-16-0345.1.
- Okazaki, A., and K. Yoshimura, 2017: Development and evaluation of a system of proxy data assimilation for paleoclimate reconstruction. Climate of the Past, 13, 379-393, doi:10.5194/cp-13-379-2017.
- Okumura, Y. M., P. DiNezio, and C. Deser, 2017: Evolving Impacts of Multiyear La Nina Events on Atmospheric Circulation and US Drought. Geophysical Research Letters, 44, 11614-11623, doi:10.1002/2017gl075034.
- Orsi, A. J., and Coauthors, 2017: The recent warming trend in North Greenland. Geophysical Research Letters, 44, 6235-6243, doi:10.1002/2016gl072212.
- Osterberg, E. C., and Coauthors, 2017: The 1200 year composite ice core record of Aleutian Low intensification. Geophysical Research Letters, 44, 7447-7454, doi:10.1002/2017gl073697.
- Paeth, H., F. Pollinger, and C. Ring, 2017: Detection and Attribution of Multivariate Climate Change Signals Using Discriminant Analysis and Bayesian Theorem. J. Clim., 30, 7757-7776, doi:10.1175/jcli-d-16-0850.1.
- Paik, S., and S. K. Min, 2017: Climate responses to volcanic eruptions assessed from observations and CMIP5 multi-models. Climate Dynamics, 48, 1017-1030, doi:10.1007/s00382-016-3125-4.
- Pappas, C., M. D. Mahecha, D. C. Frank, F. Babst, and D. Koutsoyiannis, 2017: Ecosystem functioning is enveloped by hydrometeorological variability. Nature Ecology & Evolution, 1, 1263-1270, doi:10.1038/s41559-017-0277-5.
- Park, B. J., Y. H. Kim, S. K. Min, M. K. Kim, Y. Choi, K. O. Boo, and S. Shim, 2017: Long-Term Warming Trends in Korea and Contribution of Urbanization: An Updated Assessment. Journal of Geophysical Research-Atmospheres, 122, 10637-10654, doi:10.1002/2017jd027167.
- Park, Y. G., and A. Choi, 2017: Long-term changes of South China Sea surface temperatures in winter and summer. Continental Shelf Research, 143, 185-193, doi:10.1016/j.csr.2016.07.019.
- Parker, W. S., 2017: Computer Simulation, Measurement, and Data Assimilation. British Journal for the Philosophy of Science, 68, 273-304, doi:10.1093/bjps/axv037.
- Parodi, A., L. Ferraris, W. Gallus, M. Maugeri, L. Molini, F. Siccardi, and G. Boni, 2017: Ensemble cloud-resolving modelling of a historic back-building mesoscale convective system over Liguria: the San Fruttuoso case of 1915. Climate of the Past, 13, 455-472, doi:10.5194/cp-13-455-2017.
- Peings, Y., H. Douville, J. Colin, D. Saint Martin, and G. Magnusdottir, 2017: Snow-(N)AO Teleconnection and Its Modulation by the Quasi-Biennial Oscillation. J. Clim., 30, 10211-10235, doi:10.1175/jcli-d-17-0041.1.
- Pepler, A. S., J. Fong, and L. V. Alexander, 2017: Australian east coast mid-latitude cyclones in the 20th Century Reanalysis ensemble. International Journal of Climatology, 37, 2187-2192, doi:10.1002/joc.4812.
- Perez, J., M. Menendez, and I. J. Losada, 2017: GOW2: A global wave hindcast for coastal applications. Coastal Engineering, 124, 1-11, doi:10.1016/j.coastaleng.2017.03.005.
- Perkins, W. A., and G. J. Hakim, 2017: Reconstructing paleoclimate fields using online data assimilation with a linear inverse model. Climate of the Past, 13, 421-436, doi:10.5194/cp-13-421-2017.
- Peterson, I., B. Greenan, D. Gilbert, and D. Hebert, 2017: Variability and wind forcing of ocean temperature and thermal fronts in the Slope Water region of the Northwest Atlantic. Journal of Geophysical Research-Oceans, 122, 7325-7343, doi:10.1002/2017jc012788.
- Pierre, S., and Coauthors, 2017: 6-kyr record of flood frequency and intensity in the western Mediterranean Alps - Interplay of solar and temperature forcing. Quaternary Science Reviews, 170, 121-135, doi:10.1016/j.quascirev.2017.06.019.
- Pierret, J., and S. S. P. Shen, 2017: 4D Visual Delivery of Big Climate Data: A Fast Web Database Application System. Advances in Data Science and Adaptive Analysis, 9, doi:10.1142/s2424922x17500061.
- Pinheiro, H. R., K. I. Hodges, M. A. Gan, and N. J. Ferreira, 2017: A new perspective of the climatological features of upper-level cut-off lows in the Southern Hemisphere. Climate Dynamics, 48, 541-559, doi:10.1007/s00382-016-3093-8.
- Pohl, B., C. Macron, and P. A. Monerie, 2017: Fewer rainy days and more extreme rainfall by the end of the century in Southern Africa. Scientific Reports, 7, doi:10.1038/srep46466.
- Polonsky, A. B., and D. V. Basharin, 2017: How strong is the impact of the Indo-ocean dipole on the surface air temperature/sea level pressure anomalies in the Mediterranean region? Global and Planetary Change, 151, 101-107, doi:10.1016/j.gloplacha.2016.11.007.
- Pye, K., and S. J. Blott, 2017: Evolution of a sediment-starved, over-stabilised dunefield: Kenfig Burrows, South Wales, UK. Journal of Coastal Conservation, 21, 685-717, doi:10.1007/s11852-017-0506-8.
- Rabin, S. S., and Coauthors, 2017: The Fire Modeling Intercomparison Project (FireMIP), phase 1: experimental and analytical protocols with detailed model descriptions. Geoscientific Model Development, 10, 1175-1197, doi:10.5194/gmd-10-1175-2017.
- Raynaud, D., B. Hingray, I. Zin, S. Anquetin, S. Debionne, and R. Vautard, 2017: Atmospheric analogues for physically consistent scenarios of surface weather in Europe and Maghreb. International Journal of Climatology, 37, 2160-2176, doi:10.1002/joc.4844.
- Rhines, A., K. A. McKinnon, M. P. Tingley, and P. Huybers, 2017: Seasonally Resolved Distributional Trends of North American Temperatures Show Contraction of Winter Variability. J. Clim., 30, 1139-1157, doi:10.1175/jcli-d-16-0363.1.
- Ricchi, A., and Coauthors, 2017: Sensitivity of a Mediterranean Tropical-Like Cyclone to Different Model Configurations and Coupling Strategies. Atmosphere, 8, doi:10.3390/atmos8050092.
- Rimbu, N., G. Lohmann, M. Werner, and M. Ionita, 2017: Links between central Greenland stable isotopes, blocking and extreme climate variability over Europe at decadal to multidecadal time scales. Climate Dynamics, 49, 649-663, doi:10.1007/s00382-016-3365-3.
- Risbey, J. S., M. R. Grose, D. P. Monselesan, T. J. O'Kane, and S. Lewandowsky, 2017: Transient response of the global mean warming rate and its spatial variation. Weather and Climate Extremes, 18, 55-64, doi:10.1016/j.wace.2017.11.002.
- Rodriguez-Lloveras, X., J. P. Corella, and G. Benito, 2017: MODELLING THE HYDRO-SEDIMENTARY DYNAMICS OF A MEDITERRANEAN SEMIARID UNGAUGED WATERSHED BEYOND THE INSTRUMENTAL PERIOD. Land Degradation & Development, 28, 1506-1518, doi:10.1002/ldr.2678.
- Roth, M., G. Hendeby, C. Fritsche, and F. Gustafsson, 2017: The Ensemble Kalman filter: a signal processing perspective. Eurasip Journal on Advances in Signal Processing, doi:10.1186/s13634-017-0492-x.
- Rudd, A. C., V. A. Bell, and A. L. Kay, 2017: National-scale analysis of simulated hydrological droughts (1891-2015). Journal of Hydrology, 550, 368-385, doi:10.1016/j.jhydrol.2017.05.018.
- Russell, A. M., A. Gnanadesikan, and B. Zaitchik, 2017: Are the Central Andes Mountains a Warming Hot Spot? J. Clim., 30, 3589-3608, doi:10.1175/jcli-d-16-0268.1.
- Rydval, M., and Coauthors, 2017: Reconstructing 800 years of summer temperatures in Scotland from tree rings. Climate Dynamics, 49, 2951-2974, doi:10.1007/s00382-016-3478-8.
- Sakashita, W., H. Miyahara, Y. Yokoyama, T. Aze, S. P. Obrochta, and T. Nakatsuka, 2017: Relationship between the Northern Pacific Gyre Oscillation and tree-ring cellulose oxygen isotopes in northeastern Japan. Geoscience Letters, 4, doi:10.1186/s40562-017-0095-2.
- Sanderson, M. G., T. Economou, K. H. Salmon, and S. E. O. Jones, 2017: Historical Trends and Variability in Heat Waves in the United Kingdom. Atmosphere, 8, doi:10.3390/atmos8100191.
- Santamaria-Aguilar, S., A. Arns, and A. T. Vafeidis, 2017: Sea-level rise impacts on the temporal and spatial variability of extreme water levels: A case study for St. Peter-Ording, Germany. Journal of Geophysical Research-Oceans, 122, 2742-2759, doi:10.1002/2016jc012579.
- Santos, M., J. A. Santos, and M. Fragoso, 2017: Atmospheric driving mechanisms of flash floods in Portugal. International Journal of Climatology, 37, 671-680, doi:10.1002/joc.5030.
- Santos, V. M., I. D. Haigh, and T. Wahl, 2017: Spatial and Temporal Clustering Analysis of Extreme Wave Events around the UK Coastline. Journal of Marine Science and Engineering, 5, doi:10.3390/jmse5030028.
- Sasaki, Y. N., R. Washizu, T. Yasuda, and S. Minobe, 2017: Sea Level Variability around Japan during the Twentieth Century Simulated by a Regional Ocean Model. J. Clim., 30, 5585-5595, doi:10.1175/jcli-d-16-0497.1.
- Saunders, M. A., P. J. Klotzbach, and A. S. R. Lea, 2017: Replicating annual North Atlantic hurricane activity 1878-2012 from environmental variables. Journal of Geophysical Research-Atmospheres, 122, 6284-6297, doi:10.1002/2017jd026492.
- Saurral, R. I., I. A. Camilloni, and V. R. Barros, 2017: Low-frequency variability and trends in centennial precipitation stations in southern South America. International Journal of Climatology, 37, 1774-1793, doi:10.1002/joc.4810.
- Schemm, S., A. Nummelin, N. G. Kvamsto, and O. Breivik, 2017: The Ocean Version of the Lagrangian Analysis Tool LAGRANTO. Journal of Atmospheric and Oceanic Technology, 34, 1723-1741, doi:10.1175/jtech-d-16-0198.1.
- Scheuer, S., D. Haase, and M. Volk, 2017: Integrative assessment of climate change for fast-growing urban areas: Measurement and recommendations for future research. Plos One, 12, doi:10.1371/journal.pone.0189451.
- Schwander, M., S. Bronnimann, G. Delaygue, M. Rohrer, R. Auchmann, and Y. Brugnara, 2017: Reconstruction of Central European daily weather types back to 1763. International Journal of Climatology, 37, 30-44, doi:10.1002/joc.4974.
- Seager, R., N. Henderson, M. A. Cane, H. B. Liu, and J. Nakamura, 2017: Is There a Role for Human-Induced Climate Change in the Precipitation Decline that Drove the California Drought? J. Clim., 30, 10237-10258, doi:10.1175/jcli-d-17-0192.1.
- Seager, R., and M. F. Ting, 2017: Decadal Drought Variability Over North America: Mechanisms and Predictability. Current Climate Change Reports, 3, 141-149, doi:10.1007/s40641-017-0062-1.
- Seim, A., and Coauthors, 2017: Synoptic-scale circulation patterns during summer derived from tree rings in mid-latitude Asia. Climate Dynamics, 49, 1917-1931, doi:10.1007/s00382-016-3426-7. Serykh, I. V., 2017: A comparison of the structure and dynamics of Global atmospheric oscillation in reality and in the CMIP5 climate models. International Conference on Computational Information Technologies for Environmental Sciences, E. Gordov, and V. Lykosov, Eds.
- Shan, H. X., Y. P. Guan, J. P. Huang, and C. M. Dong, 2017: Trajectory patterns of the annual cycle of the heat centre of the Indo-Pacific warm pool. International Journal of Climatology, 37, 637-647, doi:10.1002/joc.4729.
- Shen, L., and L. J. Mickley, 2017: Seasonal prediction of US summertime ozone using statistical analysis of large scale climate patterns. Proceedings of the National Academy of Sciences of the United States of America, 114, 2491-2496, doi:10.1073/pnas.1610708114.
- Shen, L., L. J. Mickley, E. M. Leibensperger, and M. W. Li, 2017: Strong Dependence of US Summertime Air Quality on the Decadal Variability of Atlantic Sea Surface Temperatures. Geophysical Research Letters, 44, 12527-12535, doi:10.1002/2017gl075905.
- Shen, X. J., B. H. Liu, and X. G. Lu, 2017: Effects of land use/land cover on diurnal temperature range in the temperate grassland region of China. Science of the Total Environment, 575, 1211-1218, doi:10.1016/j.scitotenv.2016.09.187.
- Slangen, A. B. A., and Coauthors, 2017: Evaluating Model Simulations of Twentieth-Century Sea Level Rise. Part I: Global Mean Sea Level Change. J. Clim., 30, 8539-8563, doi:10.1175/jcli-d-17-0110.1.
- So, E. M., and M. S. Suh, 2017: Trends of Upper Jet Streams Characteristics (Intensity, Altitude, Latitude and Longitude) Over the Asia-North Pacific Region Based on Four Reanalysis Datasets. Atmosphere-Korea, 27, 1-16, doi:10.14191/Atmos.2017.27.1.001.
- Srinivasu, U., M. Ravichandran, W. Q. Han, S. Sivareddy, H. Rahman, Y. L. Li, and S. Nayak, 2017: Causes for the reversal of North Indian Ocean decadal sea level trend in recent two decades. Climate Dynamics, 49, 3887-3904, doi:10.1007/s00382-017-3551-y.
- Stankunavicius, G., D. Basharin, R. Skorupskas, and G. Vivaldo, 2017: Euro-Atlantic blocking events and their impact on surface air temperature and precipitation over the European region in the 20th century. Climate Research, 71, 203-218, doi:10.3354/cr01438.
- Steen-Larsen, H. C., C. Risi, M. Werner, K. Yoshimura, and V. Masson-Delmotte, 2017: Evaluating the skills of isotope-enabled general circulation models against in situ atmospheric water vapor isotope observations. Journal of Geophysical Research-Atmospheres, 122, 246-263, doi:10.1002/2016jd025443.
- Storto, A., and S. Masina, 2017: Objectively estimating the temporal evolution of accuracy and skill in a global ocean reanalysis. Meteorological Applications, 24, 101-113, doi:10.1002/met.1609.
- Strong, C., and G. J. McCabe, 2017: Observed variations in US frost timing linked to atmospheric circulation patterns. Nature Communications, 8, doi:10.1038/ncomms15307.
- Stryhal, J., and R. Huth, 2017: Classifications of Winter Euro-Atlantic Circulation Patterns: An Intercomparison of Five Atmospheric Reanalyses. J. Clim., 30, 7847-7861, doi:10.1175/jcli-d-17-0059.1.
- Sun, C., J. P. Li, R. Q. Ding, and Z. Jin, 2017: Cold season Africa-Asia multidecadal teleconnection pattern and its relation to the Atlantic multidecadal variability. Climate Dynamics, 48, 3903-3918, doi:10.1007/s00382-016-3309-y.
- Swingedouw, D., J. Mignot, E. Guilyardi, S. Nguyen, and L. Ormieres, 2017: Tentative reconstruction of the 1998-2012 hiatus in global temperature warming using the IPSL-CM5A-LR climate model. Comptes Rendus Geoscience, 349, 369-379, doi:10.1016/j.crte.2017.09.014.
- Swingedouw, D., J. Mignot, P. Ortega, M. Khodri, M. Menegoz, C. Cassou, and V. Hanquiez, 2017: Impact of explosive volcanic eruptions on the main climate variability modes. Global and Planetary Change, 150, 24-45, doi:10.1016/j.gloplacha.2017.01.006.
- Taszarek, M., and J. Gromadzki, 2017: Deadly Tornadoes in Poland from 1820 to 2015. Monthly Weather Review, 145, 1221-1243, doi:10.1175/mwr-d-16-0146.1.
- Terzago, S., J. von Hardenberg, E. Palazzi, and A. Provenzale, 2017: Snow water equivalent in the Alps as seen by gridded data sets, CMIP5 and CORDEX climate models. Cryosphere, 11, 1625-1645, doi:10.5194/tc-11-1625-2017.
- Thorne, P. W., and Coauthors, 2017: TOWARD AN INTEGRATED SET OF SURFACE METEOROLOGICAL OBSERVATIONS FOR CLIMATE SCIENCE AND APPLICATIONS. Bulletin of the American Meteorological Society, 98, 2689-2702, doi:10.1175/bams-d-16-0165.1.
- Tokinaga, H., S. P. Xie, and H. Mukougawa, 2017: Early 20th-century Arctic warming intensified by Pacific and Atlantic multidecadal variability. Proceedings of the National Academy of Sciences of the United States of America, 114, 6227-6232, doi:10.1073/pnas.1615880114. Toride, K., D. L. Cawthorne, K. Ishida, A. J. Diaz, L. M. Kavvas, and M. L. Anderson, 2017: Climate Change Trend Analysis on Extreme Precipitation over the Shasta Dam Watershed Based on 159-Year Long-Term Dynamic Downscaling. 427-436 pp.
- Toride, K., P. Neluwala, H. Kim, and K. Yoshimura, 2017: Feasibility Study of the Reconstruction of Historical Weather with Data Assimilation. Monthly Weather Review, 145, 3563-3580, doi:10.1175/mwr-d-16-0288.1.
- Trott, C. B., B. Subrahmanyam, and V. S. N. Murty, 2017: Variability of the Somali Current and eddies during the southwest monsoon regimes. Dynamics of Atmospheres and Oceans, 79, 43-55, doi:10.1016/j.dynatmoce.2017.07.002.
- Ummenhofer, C. C., H. Seo, Y. O. Kwon, R. Parfitt, S. Brands, and T. M. Joyce, 2017: Emerging European winter precipitation pattern linked to atmospheric circulation changes over the North Atlantic region in recent decades. Geophysical Research Letters, 44, 8557-8566, doi:10.1002/2017gl074188.
- van den Broeke, M., and Coauthors, 2017: Greenland Ice Sheet Surface Mass Loss: Recent Developments in Observation and Modeling. Current Climate Change Reports, 3, 345-356, doi:10.1007/s40641-017-0084-8.
- Verdon-Kidd, D. C., B. R. Scanlon, R. C. Tong, and D. N. Fernando, 2017: A comparative study of historical droughts over Texas, USA and Murray-Darling Basin, Australia: Factors influencing initialization and cessation. Global and Planetary Change, 149, 123-138, doi:10.1016/j.gloplacha.2017.01.001.
- Vitart, F., 2017: Madden - Julian Oscillation prediction and teleconnections in the S2S database. Quarterly Journal of the Royal Meteorological Society, 143, 2210-2220, doi:10.1002/qj.3079.
- von Storch, H., and Coauthors, 2017: Regional reanalysis without local data: Exploiting the downscaling paradigm. Journal of Geophysical Research-Atmospheres, 122, 8631-8649, doi:10.1002/2016jd026332.
- Walsh, J. E., F. Fetterer, J. S. Stewart, and W. L. Chapman, 2017: A DATABASE FOR DEPICTING ARCTIC SEA ICE VARIATIONS BACK TO 1850. Geographical Review, 107, 89-107, doi:10.1111/j.1931-0846.2016.12195.x. Wang, C. Z., C. Deser, J. Y. Yu, P. DiNezio, and A. Clement, 2017: El Nino and Southern Oscillation (ENSO): A Review. Vol. 8, 85-106 pp.
- Wang, C. Z., X. D. Wang, R. H. Weisberg, and M. L. Black, 2017: Variability of tropical cyclone rapid intensification in the North Atlantic and its relationship with climate variations. Climate Dynamics, 49, 3627-3645, doi:10.1007/s00382-017-3537-9.
- Wang, L., P. Q. Xu, W. Chen, and Y. Liu, 2017: Interdecadal Variations of the Silk Road Pattern. J. Clim., 30, 9915-9932, doi:10.1175/jcli-d-17-0340.1.
- Wang, P. X., B. Wang, H. Cheng, J. Fasullo, Z. T. Guo, T. Kiefer, and Z. Y. Liu, 2017: The global monsoon across time scales: Mechanisms and outstanding issues. Earth-Science Reviews, 174, 84-121, doi:10.1016/j.earscirev.2017.07.006.
- Wang, X. F., J. P. Li, C. Sun, and T. Liu, 2017: NAO and its relationship with the Northern Hemisphere mean surface temperature in CMIP5 simulations. Journal of Geophysical Research-Atmospheres, 122, 4202-4227, doi:10.1002/2016jd025979.
- Wegmann, M., S. Bronnimann, and G. P. Compo, 2017: Tropospheric circulation during the early twentieth century Arctic warming. Climate Dynamics, 48, 2405-2418, doi:10.1007/s00382-016-3212-6.
- Wegmann, M., Y. Orsolini, E. Dutra, O. Bulygina, A. Sterin, and S. Bronnimann, 2017: Eurasian snow depth in long-term climate reanalyses. Cryosphere, 11, 923-935, doi:10.5194/tc-11-923-2017.
- Whelan, J., and J. S. Frederiksen, 2017: Dynamics of the perfect storms: La Nia and Australia's extreme rainfall and floods of 1974 and 2011. Climate Dynamics, 48, 3935-3948, doi:10.1007/s00382-016-3312-3.
- Williams, A. P., B. I. Cook, J. E. Smerdon, D. A. Bishop, R. Seager, and J. S. Mankin, 2017: The 2016 Southeastern US Drought: An Extreme Departure From Centennial Wetting and Cooling. Journal of Geophysical Research-Atmospheres, 122, 10888-10905, doi:10.1002/2017jd027523.
- Williams, B., and Coauthors, 2017: North Pacific twentieth century decadal-scale variability is unique for the past 342 years. Geophysical Research Letters, 44, 3761-3769, doi:10.1002/2017gl073138.
- Wilton, D. J., A. Jowett, E. Hanna, G. R. Bigg, M. R. van den Broeke, X. Fettweis, and P. Huybrechts, 2017: High resolution (1 km) positive degree-day modelling of Greenland ice sheet surface mass balance, 1870-2012 using reanalysis data. Journal of Glaciology, 63, 176-193, doi:10.1017/jog.2016.133.
- Winski, D., and Coauthors, 2017: Industrial-age doubling of snow accumulation in the Alaska Range linked to tropical ocean warming. Scientific Reports, 7, doi:10.1038/s41598-017-18022-5.
- Woodworth, P. L., M. A. M. Maqueda, W. R. Gehrels, V. M. Roussenov, R. G. Williams, and C. W. Hughes, 2017: Variations in the difference between mean sea level measured either side of Cape Hatteras and their relation to the North Atlantic Oscillation. Climate Dynamics, 49, 2451-2469, doi:10.1007/s00382-016-3464-1.
- Wunderlich, F., and D. M. Mitchell, 2017: Revisiting the observed surface climate response to large volcanic eruptions. Atmospheric Chemistry and Physics, 17, 485-499, doi:10.5194/acp-17-485-2017.
- Xu, K., R. X. Huang, W. Q. Wang, C. W. Zhu, and R. Y. Lu, 2017: Thermocline Fluctuations in the Equatorial Pacific Related to the Two Types of El Nino Events. J. Clim., 30, 6611-6627, doi:10.1175/jcli-d-16-0291.1.
- Yang, C. X., S. Masina, and A. Storto, 2017: Historical ocean reanalyses (1900-2010) using different data assimilation strategies. Quarterly Journal of the Royal Meteorological Society, 143, 479-493, doi:10.1002/qj.2936.
- Yang, E. G., and H. M. Kim, 2017: Evaluation of a Regional Reanalysis and ERA-Interim over East Asia Using In Situ Observations during 2013-14. Journal of Applied Meteorology and Climatology, 56, 2821-2844, doi:10.1175/jamc-d-16-0227.1.
- Yang, L., M. F. Liu, J. A. Smith, and F. Q. Tian, 2017: Typhoon Nina and the August 1975 Flood over Central China. Journal of Hydrometeorology, 18, 451-472, doi:10.1175/jhm-d-16-0152.1.
- Yao, Y., Z. Zhong, X. Q. Yang, and W. Lu, 2017: An observational study of the North Pacific storm-track impact on the midlatitude oceanic front. Journal of Geophysical Research-Atmospheres, 122, 6962-6975, doi:10.1002/2016jd026192.
- You, Q. L., Z. H. Jiang, G. W. K. Moore, Y. T. Bao, L. Kong, and S. C. Kang, 2017: Revisiting the Relationship between Observed Warming and Surface Pressure in the Tibetan Plateau. J. Clim., 30, 1721-1737, doi:10.1175/jcli-d-15-0834.1.
- Yu, L. J., and Coauthors, 2017: Possible connections of the opposite trends in Arctic and Antarctic sea-ice cover. Scientific Reports, 7, doi:10.1038/srep45804.
- Yu, L. S., X. Z. Jin, S. A. Josey, T. Lee, A. Kumar, C. H. Wen, and Y. Xue, 2017: The Global Ocean Water Cycle in Atmospheric Reanalysis, Satellite, and Ocean Salinity. J. Clim., 30, 3829-3852, doi:10.1175/jcli-d-16-0479.1.
- Yu, P. L., L. F. Zhang, H. Liu, X. Liu, and J. Zhu, 2017: A dual-period response of the Kuroshio Extension SST to Aleutian Low activity in the winter season. Acta Oceanologica Sinica, 36, 1-9, doi:10.1007/s13131-017-1104-1.
- Yuchechen, A. E., and P. O. Canziani, 2017: A comparison between thermal tropopauses derived from mandatory and significant levels for the Indian subcontinent upper-air network. Atmospheric Science Letters, 18, 207-214, doi:10.1002/asl.743.
- Zahid, M., R. Blender, V. Lucarini, and M. C. Bramati, 2017: Return levels of temperature extremes in southern Pakistan. Earth System Dynamics, 8, 1263-1278, doi:10.5194/esd-8-1263-2017.
- Zampieri, M., A. Toreti, A. Schindler, E. Scoccimarro, and S. Gualdi, 2017: Atlantic multi-decadal oscillation influence on weather regimes over Europe and the Mediterranean in spring and summer. Global and Planetary Change, 151, 92-100, doi:10.1016/j.gloPlacha.2016.08.014.
- Zerbini, S., F. Raicich, C. M. Prati, S. Bruni, S. Del Conte, M. Errico, and E. Santi, 2017: Sea-level change in the Northern Mediterranean Sea from long-period tide gauge time series. Earth-Science Reviews, 167, 72-87, doi:10.1016/j.earscirev.2017.02.009.
- Zhang, L., T. Li, and M. M. Lu, 2017: Surface wind energy trends near Taiwan in winter since 1871. Terrestrial Atmospheric and Oceanic Sciences, 28, 295-302, doi:10.3319/tao.2016.04.29.01(a).
- Zhang, L., T. Rechtman, K. B. Karnauskas, L. F. Li, J. P. Donnelly, and J. P. Kossin, 2017: Longwave emission trends over Africa and implications for Atlantic hurricanes. Geophysical Research Letters, 44, 9075-9083, doi:10.1002/2017gl073869.
- Zhang, L. P., T. L. Delworth, and F. R. Zeng, 2017: The impact of multidecadal Atlantic meridional overturning circulation variations on the Southern Ocean. Climate Dynamics, 48, 2065-2085, doi:10.1007/s00382-016-3190-8.
- Zhang, P., M. Ionita, G. Lohmann, D. L. Chen, and H. W. Linderholm, 2017: Can tree-ring density data reflect summer temperature extremes and associated circulation patterns over Fennoscandia? Climate Dynamics, 49, 2721-2736, doi:10.1007/s00382-016-3452-5.
- Zhang, P., Z. W. Wu, and H. Chen, 2017: Interdecadal Variability of the ENSO-North Pacific Atmospheric Circulation in Winter. Atmosphere-Ocean, 55, 110-120, doi:10.1080/07055900.2017.1291411.
- Zhang, Q., and Z. Guan, 2017: Interdecadal Change in the Eurasia-Pacific Anti-Phase Relation of Atmospheric Mass and Its Possible Link with PDO. Journal of Meteorological Research, 31, 126-141, doi:10.1007/s13351-017-6079-5.
- Zhang, Y. Q., Q. L. You, C. C. Chen, and X. Li, 2017: Flash droughts in a typical humid and subtropical basin: A case study in the Gan River Basin, China. Journal of Hydrology, 551, 162-176, doi:10.1016/j.jhydrol.2017.05.044.
- Zhao, L., J. S. Wang, H. W. Liu, and Z. N. Xiao, 2017: Amplification of the Solar Signal in the Summer Monsoon Rainband in China by Synergistic Actions of Different Dynamical Responses. Journal of Meteorological Research, 31, 61-72, doi:10.1007/s13351-016-6046-6.
- Zhu, J., D. Q. Huang, P. W. Yan, Y. Huang, and X. Y. Kuang, 2017: Can reanalysis datasets describe the persistent temperature and precipitation extremes over China? Theoretical and Applied Climatology, 130, 655-671, doi:10.1007/s00704-016-1912-9.
- Zhu, Z. W., and T. Li, 2017: The Record-Breaking Hot Summer in 2015 over Hawaii and Its Physical Causes. J. Clim., 30, 4253-4266, doi:10.1175/jcli-d-16-0438.1.
- Zhu, Z. W., and T. Li, 2017: The statistical extended-range (10-30-day) forecast of summer rainfall anomalies over the entire China. Climate Dynamics, 48, 209-224, doi:10.1007/s00382-016-3070-2.
- Zolina, O., A. Dufour, S. K. Gulev, and G. Stenchikov, 2017: Regional Hydrological Cycle over the Red Sea in ERA-Interim. Journal of Hydrometeorology, 18, 65-83, doi:10.1175/jhm-d-16-0048.1.
- Allan, R., and Coauthors, 2016: Toward integrated historical climate research: the example of Atmospheric Circulation Reconstructions over the Earth. Wiley Interdisciplinary Reviews-Climate Change, 7, 164-174, doi:10.1002/wcc.379.
- Anderson, B. T., D. J. S. Gianotti, J. C. Furtado, and E. Di Lorenzo, 2016: A decadal precession of atmospheric pressures over the North Pacific. Geophysical Research Letters, 43, 3921-3927, doi:10.1002/2016GL068206.
- Anderson, B. T., D. J. S. Gianotti, G. Salvucci, and J. Furtado, 2016: Dominant Time Scales of Potentially Predictable Precipitation Variations across the Continental United States. J. Clim., 29, 8881-8897, doi:10.1175/JCLI-D-15-0635.1.
- Ashcroft, L., J. Gergis, and D. J. Karoly, 2016: Long-term stationarity of El Nino-Southern Oscillation teleconnections in southeastern Australia. Climate Dynamics, 46, 2991-3006, doi:10.1007/s00382-015-2746-3.
- Axell, L., and Y. Liu, 2016: Application of 3-D ensemble variational data assimilation to a Baltic Sea reanalysis 1989-2013. Tellus Series a-Dynamic Meteorology and Oceanography, 68, doi:10.3402/tellusa.v68.24220.
- Bach, L., C. Schraff, J. D. Keller, and A. Hense, 2016: Towards a probabilistic regional reanalysis system for Europe: evaluation of precipitation from experiments. Tellus Series a-Dynamic Meteorology and Oceanography, 68, doi:10.3402/tellusa.v68.32209. Ban, R. J., 2016: NEXT GENERATION EARTH SYSTEM PREDICTION STRATEGIES FOR SUBSEASONAL TO SEASONAL FORECASTS Preface. Next Generation Earth System Prediction: Strategies for Subseasonal to Seasonal Forecasts, XI-+.
- Bantges, R. J., H. E. Brindley, X. H. Chen, X. L. Huang, J. E. Harries, and J. E. Murray, 2016: On the Detection of Robust Multidecadal Changes in Earth's Outgoing Longwave Radiation Spectrum. J. Clim., 29, 4939-4947, doi:10.1175/JCLI-D-15-0713.1.
- Bartoszek, K., and D. Skiba, 2016: Circulation types classification for hourly precipitation events in Lublin (East Poland). Open Geosciences, 8, 214-230, doi:10.1515/geo-2016-0019.
- Batte, L., and M. Deque, 2016: Randomly correcting model errors in the ARPEGE-Climate v6.1 component of CNRM-CM: applications for seasonal forecasts. Geoscientific Model Development, 9, 2055-2076, doi:10.5194/gmd-9-2055-2016.
- Beal, L. M., and S. Elipot, 2016: Broadening not strengthening of the Agulhas Current since the early 1990s. Nature, 540, 570-+, doi:10.1038/nature19853.
- Befort, D. J., S. Wild, T. Kruschke, U. Ulbrich, and G. C. Leckebusch, 2016: Different long-term trends of extra-tropical cyclones and windstorms in ERA-20C and NOAA-20CR reanalyses. Atmospheric Science Letters, 17, 586-595, doi:10.1002/asl.694.
- Behnke, R., S. Vavrus, A. Allstadt, T. Albright, W. E. Thogmartin, and V. C. Radeloff, 2016: Evaluation of downscaled, gridded climate data for the - conterminous United States. Ecol Appl, 26, 1338-1351, doi:10.1002/15-1061.
- Bierstedt, S. E., B. Huenicke, E. Zorita, S. Wagner, and J. J. Gomez-Navarro, 2016: Variability of daily winter wind speed distribution over Northern Europe during the past millennium in regional and global climate simulations. Climate of the Past, 12, 317-338, doi:10.5194/cp-12-317-2016.
- Bodini, N., J. K. Lundquist, D. Zardi, and M. Handschy, 2016: Year-to-year correlation, record length, and overconfidence in wind resource assessment. Wind Energy Science, 1, 115-128, doi:10.5194/wes-1-115-2016.
- Boisier, J. P., R. Rondanelli, R. D. Garreaud, and F. Munoz, 2016: Anthropogenic and natural contributions to the Southeast Pacific precipitation decline and recent megadrought in central Chile. Geophysical Research Letters, 43, 413-421, doi:10.1002/2015GL067265.
- Boudou, M., M. Lang, F. Vinet, and D. Coeur, 2016: Comparative hazard analysis of processes leading to remarkable flash floods (France, 1930-1999). Journal of Hydrology, 541, 533-552, doi:10.1016/j.jhydrol.2016.05.032.
- Brigode, P., F. Brissette, A. Nicault, L. Perreault, A. Kuentz, T. Mathevet, and J. Gailhard, 2016: Streamflow variability over the 1881-2011 period in northern Quebec: comparison of hydrological reconstructions based on tree rings and geopotential height field reanalysis. Climate of the Past, 12, 1785-1804, doi:10.5194/cp-12-1785-2016.
- Bronnimann, S., and Coauthors, 2016: Multidecadal variations of the effects of the Quasi-Biennial Oscillation on the climate system. Atmospheric Chemistry and Physics, 16, 15529-15543, doi:10.5194/acp-16-15529-2016.
- Browning, S. A., and I. D. Goodwin, 2016: Large-scale drivers of Australian East Coast Cyclones since 1851. Journal of Southern Hemisphere Earth Systems Science, 66, 125-151, doi:Burcea, S., R. Cica, and R. Bojariu, 2016: Hail Climatology and Trends in Romania: 1961-2014. Monthly Weather Review, 144, 4289-4299, doi:10.1175/MWR-D-16-0126.1.
- Caillouet, L., J.-P. Vidal, E. Sauquet, and B. Graff, 2016: Probabilistic precipitation and temperature downscaling of the Twentieth Century Reanalysis over France. Climate of the Past, 12, 635-662, doi:10.5194/cp-12-635-2016.
- Campanico, H., P. M. M. Soares, P. Hollmuller, and R. M. Cardoso, 2016: Climatic cooling potential and building cooling demand savings: High resolution spatiotemporal analysis of direct ventilation and evaporative cooling for the Iberian Peninsula. Renewable Energy, 85, 766-776, doi:10.1016/j.renene.2015.07.038.
- Cao, J., S. Gui, Q. Su, and Y. Yang, 2016: The Variability of the Indian-East Asian Summer Monsoon Interface in Relation to the Spring Seesaw Mode between the Indian Ocean and the Central-Western Pacific. J. Clim., 29, 5027-5040, doi:10.1175/JCLI-D-15-0839.1.
- Capa-Morocho, M., B. Rodriguez-Fonseca, and M. Ruiz-Ramos, 2016: Sea surface temperature impacts on winter cropping systems in the Iberian Peninsula. Agricultural and Forest Meteorology, 226, 213-228, doi:10.1016/j.agrformet.2016.06.007.
- Capa-Morocho, M., B. Rodriguez-Fonseca, and M. Ruiz-Ramos, 2016: El Nino influence on potential maize yield in Iberian Peninsula. International Journal of Climatology, 36, 1313-1330, doi:10.1002/joc.4426.
- Carril, A. F., and Coauthors, 2016: Extreme events in the La Plata basin: a retrospective analysis of what we have learned during CLARIS-LPB project. Climate Research, 68, 95-116, doi:10.3354/cr01374.
- Cauquoin, A., P. Jean-Baptiste, C. Risi, E. Fourre, and A. Landais, 2016: Modeling the global bomb tritium transient signal with the AGCM LMDZ-iso: A method to evaluate aspects of the hydrological cycle. Journal of Geophysical Research-Atmospheres, 121, 12612-12629, doi:10.1002/2016JD025484.
- Chafik, L., and Coauthors, 2016: Global linkages originating from decadal oceanic variability in the subpolar North Atlantic. Geophysical Research Letters, 43, 10909-10919, doi:10.1002/2016GL071134.
- Chen, D., H.-J. Wang, S. Yang, and Y. Gao, 2016: A multidecadal oscillation in the northeastern Pacific. Atmospheric and Oceanic Science Letters, 9, 315-326, doi:10.1080/16742834.2016.1194716.
- Chen, J.-M., P.-H. Tan, C.-F. Shih, and H.-S. Chen, 2016: Large-Scale Processes Associated with Inter-Decadal and Inter-Annual Early Spring Rainfall Variability in Taiwan. Terrestrial Atmospheric and Oceanic Sciences, 27, 87-98, doi:10.3319/TAO.2015.06.17.01(A).
- Chervenkov, H., I. Tsonevsky, and K. Slavov, 2016: Drought Events Assessment and Trend Estimation - Results from the Analysis of Long-Term Time Series of the Standardized Precipitation Index. Comptes Rendus De L Academie Bulgare Des Sciences, 69, 983-994, doi:Ciarlo, J. M., and N. J. Aquilina, 2016: An analysis of teleconnections in the Mediterranean region using RegCM4. International Journal of Climatology, 36, 797-808, doi:10.1002/joc.4383.
- Comas-Bru, L., F. McDermott, and M. Werner, 2016: The effect of the East Atlantic pattern on the precipitation delta O-18-NAO relationship in Europe. Climate Dynamics, 47, 2059-2069, doi:10.1007/s00382-015-2950-1.
- Corella, J. P., B. L. Valero-Garces, S. M. Vicente-Serrano, A. Brauer, and G. Benito, 2016: Three millennia of heavy rainfalls in Western Mediterranean: frequency, seasonality and atmospheric drivers. Scientific Reports, 6, doi:10.1038/srep38206.
- Dafka, S., E. Xoplaki, A. Toreti, P. Zanis, E. Tyrlis, C. Zerefos, and J. Luterbacher, 2016: The Etesians: from observations to reanalysis. Climate Dynamics, 47, 1569-1585, doi:10.1007/s00382-015-2920-7.
- Dangendorf, S., A. Arns, J. G. Pinto, P. Ludwig, and J. Jensen, 2016: The exceptional influence of storm 'Xaver' on design water levels in the German Bight. Environmental Research Letters, 11, doi:10.1088/1748-9326/11/5/054001.
- Dell'Aquila, A., and Coauthors, 2016: Benchmarking Northern Hemisphere midlatitude atmospheric synoptic variability in centennial reanalysis and numerical simulations. Geophysical Research Letters, 43, 5442-5449, doi:10.1002/2016GL068829.
- Deser, C., L. Terray, and A. S. Phillips, 2016: Forced and Internal Components of Winter Air Temperature Trends over North America during the past 50 Years: Mechanisms and Implications. J. Clim., 29, 2237-2258, doi:10.1175/JCLI-D-15-0304.1.
- Diaz, H. F., E. R. Wahl, E. Zorita, T. W. Giambelluca, and J. K. Eischeid, 2016: A Five-Century Reconstruction of Hawaiian Islands Winter Rainfall. J. Clim., 29, 5661-5674, doi:10.1175/JCLI-D-15-0815.1.
- Diaz-Argandona, J., A. Ezcurra, J. Saenz, G. Ibarra-Berastegi, and I. Errasti, 2016: Climatology and temporal evolution of the atmospheric semidiurnal tide in present-day reanalyses. Journal of Geophysical Research-Atmospheres, 121, 4614-4626, doi:10.1002/2015JD024513.
- Dieppois, B., B. Pohl, M. Rouault, M. New, D. Lawler, and N. Keenlyside, 2016: Interannual to interdecadal variability of winter and summer southern African rainfall, and their teleconnections. Journal of Geophysical Research-Atmospheres, 121, 6215-6239, doi:10.1002/2015JD024576.
- Dima, M., and M. Voiculescu, 2016: Global patterns of solar influence on high cloud cover. Climate Dynamics, 47, 667-678, doi:10.1007/s00382-015-2862-0.
- Ding, R., J. Li, Y.-h. Tseng, K.-J. Ha, S. Zhao, and J.-Y. Lee, 2016: Interdecadal change in the lagged relationship between the Pacific-South American pattern and ENSO. Climate Dynamics, 47, 2867-2884, doi:10.1007/s00382-016-3002-1.
- Dirmeyer, P. A., and Coauthors, 2016: Confronting Weather and Climate Models with Observational Data from Soil Moisture Networks over the United States. Journal of Hydrometeorology, 17, 1049-1067, doi:10.1175/JHM-D-15-0196.1.
- Dolinar, E. K., X. Dong, and B. Xi, 2016: Evaluation and intercomparison of clouds, precipitation, and radiation budgets in recent reanalyses using satellite-surface observations. Climate Dynamics, 46, 2123-2144, doi:10.1007/s00382-015-2693-z.
- Donat, M. G., L. V. Alexander, N. Herold, and A. J. Dittus, 2016: Temperature and precipitation extremes in century-long gridded observations, reanalyses, and atmospheric model simulations. Journal of Geophysical Research-Atmospheres, 121, 11174-11189, doi:10.1002/2016JD025480.
- Donat, M. G., A. D. King, J. T. Overpeck, L. V. Alexander, I. Durre, and D. J. Karoly, 2016: Extraordinary heat during the 1930s US Dust Bowl and associated large-scale conditions. Climate Dynamics, 46, 413-426, doi:10.1007/s00382-015-2590-5. Dong, W., J. Huang, Y. Guo, and F. Ren, 2016: Data and Methods. Atlas of Climate Change: Responsibility and Obligation of Human Society, 1-7.
- Dong, X., and F. Xue, 2016: Phase Transition of the Pacific Decadal Oscillation and Decadal Variation of the East Asian Summer Monsoon in the 20th Century. Advances in Atmospheric Sciences, 33, 330-338, doi:10.1007/s00376-015-5130-7.
- Dufour, A., O. Zolina, and S. K. Gulev, 2016: Atmospheric Moisture Transport to the Arctic: Assessment of Reanalyses and Analysis of Transport Components. J. Clim., 29, 5061-5081, doi:10.1175/JCLI-D-15-0559.1.
- Dunn, R. J. H., K. M. Willett, D. E. Parker, and L. Mitchell, 2016: Expanding HadISD: quality-controlled, sub-daily station data from 1931. Geoscientific Instrumentation Methods and Data Systems, 5, doi:10.5194/gi-5-473-2016.
- Edvardsson, J., F. Adolphi, H. W. Linderholm, C. Corona, R. Muscheler, and M. Stoffel, 2016: Periodicities in mid- to late-Holocene peatland hydrology identified from Swedish and Lithuanian tree-ring data. Quaternary Science Reviews, 137, 200-208, doi:10.1016/j.quascirev.2016.02.020.
- Emery, C. M., S. Biancamaria, A. Boone, P.-A. Garambois, S. Ricci, M. C. Rochoux, and B. Decharme, 2016: Temporal Variance-Based Sensitivity Analysis of the River-Routing Component of the Large-Scale Hydrological Model ISBA-TRIP: Application on the Amazon Basin. Journal of Hydrometeorology, 17, 3007-3027, doi:10.1175/JHM-D-16-0050.1.
- Evan, A. T., C. Flamant, M. Gaetani, and F. Guichard, 2016: The past, present and future of African dust. Nature, 531, 493-+, doi:10.1038/nature17149.
- Eyring, V., and Coauthors, 2016: ESMValTool (v1.0) - a community diagnostic and performance metrics tool for routine evaluation of Earth system models in CMIP. Geoscientific Model Development, 9, 1747-1802, doi:10.5194/gmd-9-1747-2016.
- Fang, M., and X. Li, 2016: Paleoclimate data assimilation: Its motivation, progress and prospects. Science China-Earth Sciences, 59, 1817-1826, doi:10.1007/s11430-015-5432-6.
- Faranda, D., M. C. Alvarez-Castro, and P. Yiou, 2016: Return times of hot and cold days via recurrences and extreme value theory. Climate Dynamics, 47, 3803-3815, doi:10.1007/s00382-016-3042-6.
- Finkenbinder, M. S., M. B. Abbott, and B. A. Steinman, 2016: Holocene climate change in Newfoundland reconstructed using oxygen isotope analysis of lake sediment cores. Global and Planetary Change, 143, 251-261, doi:10.1016/j.gloplacha.2016.06.014.
- Fleming, L. E., and K. J. Anchukaitis, 2016: North Pacific decadal variability in the CMIP5 last millennium simulations. Climate Dynamics, 47, 3783-3801, doi:10.1007/s00382-016-3041-7.
- Fogt, R. L., C. A. Goergens, M. E. Jones, G. A. Witte, M. Y. Lee, and J. M. Jones, 2016: Antarctic station-based seasonal pressure reconstructions since 1905: 1. Reconstruction evaluation. Journal of Geophysical Research-Atmospheres, 121, 2814-2835, doi:10.1002/2015JD024564.
- Fogt, R. L., J. M. Jones, C. A. Goergens, M. E. Jones, G. A. Witte, and M. Y. Lee, 2016: Antarctic station-based seasonal pressure reconstructions since 1905: 2. Variability and trends during the twentieth century. Journal of Geophysical Research-Atmospheres, 121, 2836-2856, doi:10.1002/2015JD024565.
- Francois, B., 2016: Influence of winter North-Atlantic Oscillation on Climate-Related Energy penetration in Europe. Renewable Energy, 99, 602-613, doi:10.1016/j.renene.2016.07.010.
- Francois, B., B. Hingray, D. Raynaud, M. Borga, and J. D. Creutin, 2016: Increasing climate-related-energy penetration by integrating run-of-the river hydropower to wind/solar mix. Renewable Energy, 87, 686-696, doi:10.1016/j.renene.2015.10.064.
- Frederikse, T., R. Riva, M. Kleinherenbrink, Y. Wada, M. van den Broeke, and B. Marzeion, 2016: Closing the sea level budget on a regional scale: Trends and variability on the Northwestern European continental shelf. Geophysical Research Letters, 43, 10864-10872, doi:10.1002/2016GL070750.
- Fredriksen, H.-B., and K. Rypdal, 2016: Spectral Characteristics of Instrumental and Climate Model Surface Temperatures. J. Clim., 29, 1253-1268, doi:10.1175/JCLI-D-15-0457.1.
- Fuentes-Franco, R., F. Giorgi, E. Coppola, and F. Kucharski, 2016: The role of ENSO and PDO in variability of winter precipitation over North America from twenty first century CMIP5 projections. Climate Dynamics, 46, 3259-3277, doi:10.1007/s00382-015-2767-y.
- Gao, Y., P.-C. Hsu, and H.-H. Hsu, 2016: Assessments of surface latent heat flux associated with the Madden-Julian Oscillation in reanalyses. Climate Dynamics, 47, 1755-1774, doi:10.1007/s00382-015-2931-4.
- Gibson, P. B., S. E. Perkins-Kirkpatrick, and J. A. Renwick, 2016: Projected changes in synoptic weather patterns over New Zealand examined through self-organizing maps. International Journal of Climatology, 36, 3934-3948, doi:10.1002/joc.4604.
- Gibson, P. B., P. Uotila, S. E. Perkins-Kirkpatrick, L. V. Alexander, and A. J. Pitman, 2016: Evaluating synoptic systems in the CMIP5 climate models over the Australian region. Climate Dynamics, 47, 2235-2251, doi:10.1007/s00382-015-2961-y.
- Giese, B. S., H. F. Seidel, G. P. Compo, and P. D. Sardeshmukh, 2016: An ensemble of ocean reanalyses for 1815-2013 with sparse observational input. Journal of Geophysical Research-Oceans, 121, 6891-6910, doi:10.1002/2016JC012079.
- Glovin, G. M., T. E. Arbetter, and A. H. Lynch, 2016: Wavelet analysis of polar vortex variability over the twentieth century. Journal of Geophysical Research-Atmospheres, 121, 722-732, doi:10.1002/2014JD022971.
- Grotjahn, R., and Coauthors, 2016: North American extreme temperature events and related large scale meteorological patterns: a review of statistical methods, dynamics, modeling, and trends. Climate Dynamics, 46, 1151-1184, doi:10.1007/s00382-015-2638-6.
- Guo, Y., J. Cao, H. Li, J. Wang, and Y. Ding, 2016: Simulation of the Interface between the Indian Summer Monsoon and the East Asian Summer Monsoon: Intercomparison between MPI-ESM and ECHAM5/MPI-OM. Advances in Atmospheric Sciences, 33, 294-308, doi:10.1007/s00376-015-5073-z.
- Guo, Y., J. Li, J. Feng, F. Xie, C. Sun, and J. Zheng, 2016: The Multidecadal Variability of the Asymmetric Mode of the Boreal Autumn Hadley Circulation and Its Link to the Atlantic Multidecadal Oscillation. J. Clim., 29, 5625-5641, doi:10.1175/JCLI-D-15-0025.1.
- Guo, Y., S. Zhang, J. Yan, Z. Chen, and X. Ruan, 2016: A comparison of atmospheric temperature over China between radiosonde observations and multiple reanalysis datasets. Journal of Meteorological Research, 30, 242-257, doi:10.1007/s13351-016-5169-0.
- Haigh, I. D., and Coauthors, 2016: Analysis: Spatial and temporal analysis of extreme sea level and storm surge events around the coastline of the UK. Scientific Data, 3, doi:10.1038/sdata.2016.107.
- Hakim, G. J., and Coauthors, 2016: The lastmillennium climate reanalysis project: Framework and first results. Journal of Geophysical Research-Atmospheres, 121, 6745-6764, doi:10.1002/2016JD024751.
- Halder, S., S. K. Saha, P. A. Dirmeyer, T. N. Chase, and B. N. Goswami, 2016: Investigating the impact of land-use land-cover change on Indian summer monsoon daily rainfall and temperature during 1951-2005 using a regional climate model. Hydrology and Earth System Sciences, 20, 1765-1784, doi:10.5194/hess-20-1765-2016.
- Hanna, E., T. E. Cropper, R. J. Hall, and J. Cappelen, 2016: Greenland Blocking Index 1851-2015: a regional climate change signal. International Journal of Climatology, 36, 4847-4861, doi:10.1002/joc.4673.
- Harada, Y., and Coauthors, 2016: The JRA-55 Reanalysis: Representation of Atmospheric Circulation and Climate Variability. Journal of the Meteorological Society of Japan, 94, 269-302, doi:10.2151/jmsj.2016-015.
- Harel, M. A., S. M. Mudd, and M. Attal, 2016: Global analysis of the stream power law parameters based on worldwide Be-10 denudation rates. Geomorphology, 268, 184-196, doi:10.1016/j.geomorph.2016.05.035.
- Harrington, L. J., P. B. Gibson, S. M. Dean, D. Mitchell, S. M. Rosier, and D. J. Frame, 2016: Investigating event-specific drought attribution using self-organizing maps. Journal of Geophysical Research-Atmospheres, 121, 12766-12780, doi:10.1002/2016JD025602.
- Hatchett, B. J., D. P. Boyle, C. B. Garner, M. L. Kaplan, A. E. Putnam, and S. D. Bassett, 2016: Magnitude and frequency of wet years under a megadrought climate in the western Great Basin, USA. Quaternary Science Reviews, 152, 197-202, doi:10.1016/j.quascirev.2016.09.017.
- He, S., and H. Wang, 2016: Linkage between the East Asian January temperature extremes and the preceding Arctic Oscillation. International Journal of Climatology, 36, 1026-1032, doi:10.1002/joc.4399.
- He, Y.-C., H. Drange, Y. Gao, and M. Bentsen, 2016: Simulated Atlantic Meridional Overturning Circulation in the 20th century with an ocean model forced by reanalysis-based atmospheric data sets. Ocean Modelling, 100, 31-48, doi:10.1016/j.ocemod.2015.12.011.
- Hernandez, A., H. Kutiel, R. M. Trigo, M. A. Valente, J. Sigro, T. Cropper, and F. E. Santo, 2016: New Azores archipelago daily precipitation dataset and its links with large-scale modes of climate variability. International Journal of Climatology, 36, 4439-4454, doi:10.1002/joc.4642.
- Herold, N., L. V. Alexander, M. G. Donat, S. Contractor, and A. Becker, 2016: How much does it rain over land? Geophysical Research Letters, 43, 341-348, doi:10.1002/2015GL066615.
- Hoy, A., O. Katel, P. Thapa, N. Dendup, and J. Matschullat, 2016: Climatic changes and their impact on socio-economic sectors in the Bhutan Himalayas: an implementation strategy. Regional Environmental Change, 16, 1401-1415, doi:10.1007/s10113-015-0868-0.
- Huang, J., M. Ji, Y. Xie, S. Wang, Y. He, and J. Ran, 2016: Global semi-arid climate change over last 60 years. Climate Dynamics, 46, 1131-1150, doi:10.1007/s00382-015-2636-8.
- Huang, W., B. Wang, and J. S. Wright, 2016: A potential vorticity-based index for the East Asian winter monsoon. Journal of Geophysical Research-Atmospheres, 121, 9382-9399, doi:10.1002/2016JD025053. Ishida, K., and M. L. Kavvas, 2016: Climate Change Analysis on Historical Precipitation over Mountainous Watersheds by Means of Dynamical Downscaling of Long-Term Reanalysis. World Environmental and Water Resources Congress 2016: Hydraulics and Waterways and Hydro-Climate/Climate Change, 626-632.
- Jackson, D. L., M. Hughes, and G. A. Wick, 2016: Evaluation of landfalling atmospheric rivers along the US West Coast in reanalysis data sets. Journal of Geophysical Research-Atmospheres, 121, 2705-2718, doi:10.1002/2015JD024412.
- Jacques, A. A., J. D. Horel, E. T. Crosman, F. Vernon, and J. Tytell, 2016: The Earthscope US transportable array 1 Hz surface pressure dataset. Geoscience Data Journal, 3, 29-36, doi:10.1002/gdj3.37.
- Jacques-Coper, M., S. Broennimann, O. Martius, C. Vera, and B. Cerne, 2016: Summer heat waves in southeastern Patagonia: an analysis of the intraseasonal timescale. International Journal of Climatology, 36, 1359-1374, doi:10.1002/joc.4430.
- Jarvinen, H., T. Seitola, J. Silen, and J. Raisanen, 2016: Multi-annual modes in the 20th century temperature variability in reanalyses and CMIP5 models. Geoscientific Model Development, 9, 4097-4109, doi:10.5194/gmd-9-4097-2016.
- Jia, F., L. Wu, B. Gan, and W. Cai, 2016: Global Warming Attenuates the Tropical Atlantic-Pacific Teleconnection. Scientific Reports, 6, doi:10.1038/srep20078.
- Jones, P., 2016: The Reliability of Global and Hemispheric Surface Temperature Records. Advances in Atmospheric Sciences, 33, 269-282, doi:10.1007/s00376-015-5194-4.
- Jones, P. D., and Coauthors, 2016: Long-term trends in precipitation and temperature across the Caribbean. International Journal of Climatology, 36, 3314-3333, doi:10.1002/joc.4557.
- Jones, P. D., C. Harpham, and D. Lister, 2016: Long-term trends in gale days and storminess for the Falkland Islands. International Journal of Climatology, 36, 1413-1427, doi:10.1002/joc.4434.
- Jourdain, N. C., M. Lengaigne, J. Vialard, T. Izumo, and A. Sen Gupta, 2016: Further Insights on the Influence of the Indian Ocean Dipole on the Following Year's ENSO from Observations and CMIP5 Models. J. Clim., 29, 637-658, doi:10.1175/JCLI-D-15-0481.1.
- Kam, J., and J. Sheffield, 2016: Increased Drought and Pluvial Risk over California due to Changing Oceanic Conditions. J. Clim., 29, 8269-8279, doi:10.1175/JCLI-D-15-0879.1.
- Karspeck, A. R., 2016: An Ensemble Approach for the Estimation of Observational Error Illustrated for a Nominal 1 degrees Global Ocean Model. Monthly Weather Review, 144, 1713-1728, doi:10.1175/MWR-D-14-00336.1.
- Kayano, M. T., V. B. Capistrano, R. V. Andreoli, and R. A. F. de Souza, 2016: A further analysis of the tropical Atlantic SST modes and their relations to north-eastern Brazil rainfall during different phases of Atlantic Multidecadal Oscillation. International Journal of Climatology, 36, 4006-4018, doi:10.1002/joc.4610.
- Kern, Z., A. Nemeth, M. H. Gulyas, I. Popa, T. Levanic, and I. G. Hatvani, 2016: Natural proxy records of temperature- and hydroclimate variability with annual resolution from the Northern Balkan-Carpathian region for the past millennium - Review & recalibration. Quaternary International, 415, 109-125, doi:10.1016/j.quaint.2016.01.012.
- Khouakhi, A., and G. Villarini, 2016: On the relationship between atmospheric rivers and high sea water levels along the US West Coast. Geophysical Research Letters, 43, 8815-8822, doi:10.1002/2016GL070086.
- Kim, J., and K.-Y. Kim, 2016: The tropospheric biennial oscillation defined by a biennial mode of sea surface temperature and its impact on the atmospheric circulation and precipitation in the tropical eastern Indo-western Pacific region. Climate Dynamics, 47, 2601-2615, doi:10.1007/s00382-016-2987-9.
- Klotzbach, P. J., E. C. J. Oliver, R. D. Leeper, and C. J. Schreck, III, 2016: The Relationship between the Madden-Julian Oscillation (MJO) and Southeastern New England Snowfall. Monthly Weather Review, 144, 1355-1362, doi:10.1175/MWR-D-15-0434.1.
- Krishnamurthy, L., and V. Krishnamurthy, 2016: Teleconnections of Indian monsoon rainfall with AMO and Atlantic tripole. Climate Dynamics, 46, 2269-2285, doi:10.1007/s00382-015-2701-3.
- Krishnamurthy, L., and V. Krishnamurthy, 2016: Decadal and interannual variability of the Indian Ocean SST. Climate Dynamics, 46, 57-70, doi:10.1007/s00382-015-2568-3.
- Kruschke, T., H. W. Rust, C. Kadow, W. A. Mueller, H. Pohlmann, G. C. Leckebusch, and U. Ulbrich, 2016: Probabilistic evaluation of decadal prediction skill regarding Northern Hemisphere winter storms. Meteorologische Zeitschrift, 25, 721-738, doi:10.1127/metz/2015/0641.
- Kubota, H., Y. Kosaka, and S.-P. Xie, 2016: A 117-year long index of the Pacific-Japan pattern with application to interdecadal variability. International Journal of Climatology, 36, 1575-1589, doi:10.1002/joc.4441.
- Kucharski, F., and Coauthors, 2016: Atlantic forcing of Pacific decadal variability. Climate Dynamics, 46, 2337-2351, doi:10.1007/s00382-015-2705-z.
- Kucharski, F., and Coauthors, 2016: The Teleconnection of the Tropical Atlantic to Indo-Pacific Sea Surface Temperatures on Inter-Annual to Centennial Time Scales: A Review of Recent Findings. Atmosphere, 7, doi:10.3390/atmos7020029.
- Kutta, E., and J. A. Hubbart, 2016: Reconsidering meteorological seasons in a changing climate. Climatic Change, 137, 511-524, doi:10.1007/s10584-016-1704-3.
- Kwon, E. Y., Y. H. Kim, Y.-G. Park, Y.-H. Park, J. Dunne, and K.-I. Chang, 2016: Multidecadal wind-driven shifts in northwest Pacific temperature, salinity, O-2, and PO4. Global Biogeochemical Cycles, 30, 1599-1619, doi:10.1002/2016GB005442.
- Lee, S.-K., A. T. Wittenberg, D. B. Enfield, S. J. Weaver, C. Wang, and R. Atlas, 2016: US regional tornado outbreaks and their links to spring ENSO phases and North Atlantic SST variability. Environmental Research Letters, 11, doi:10.1088/1748-9326/11/4/044008.
- Li, A. K., H. Paek, and J.-Y. Yu, 2016: The changing influences of the AMO and PDO on the decadal variation of the Santa Ana winds. Environmental Research Letters, 11, doi:10.1088/1748-9326/11/6/064019.
- Li, B., X. Zhang, and J. E. Smerdon, 2016: Comparison between spatio-temporal random processes and application to climate model data. Environmetrics, 27, 267-279, doi:10.1002/env.2395.
- Lin, J.-S., B. Wu, and T.-J. Zhou, 2016: Is the interdecadal circumglobal teleconnection pattern excited by the Atlantic multidecadal Oscillation? Atmospheric and Oceanic Science Letters, 9, 451-457, doi:10.1080/16742834.2016.1233800.
- Lopez, H., S. Dong, S.-K. Lee, and E. Campos, 2016: Remote influence of Interdecadal Pacific Oscillation on the South Atlantic meridional overturning circulation variability. Geophysical Research Letters, 43, 8250-8258, doi:10.1002/2016GL069067.
- Lopez-Parages, J., B. Rodriguez-Fonseca, D. Dommenget, and C. Frauen, 2016: ENSO influence on the North Atlantic European climate: a non-linear and non-stationary approach. Climate Dynamics, 47, 2071-2084, doi:10.1007/s00382-015-2951-0.
- Lorrey, A. M., and P. R. Chappell, 2016: The "dirty weather" diaries of Reverend Richard Davis: insights about early colonial-era meteorology and climate variability for northern New Zealand, 1839-1851. Climate of the Past, 12, 553-573, doi:10.5194/cp-12-553-2016.
- Ma, S., and T. Zhou, 2016: Robust Strengthening and Westward Shift of the Tropical Pacific Walker Circulation during 1979-2012: A Comparison of 7 Sets of Reanalysis Data and 26 CMIP5 Models. J. Clim., 29, 3097-3118, doi:10.1175/JCLI-D-15-0398.1.
- Magee, A. D., D. C. Verdon-Kidd, and A. S. Kiem, 2016: An intercomparison of tropical cyclone best-track products for the southwest Pacific. Natural Hazards and Earth System Sciences, 16, 1431-1447, doi:10.5194/nhess-16-1431-2016.
- Malherbe, J., B. Dieppois, P. Maluleke, M. Van Staden, and D. L. Pillay, 2016: South African droughts and decadal variability. Natural Hazards, 80, 657-681, doi:10.1007/s11069-015-1989-y.
- Martin-Benito, D., C. C. Ummenhofer, N. Kose, H. T. Guner, and N. Pederson, 2016: Tree-ring reconstructed May-June precipitation in the Caucasus since 1752 CE. Climate Dynamics, 47, 3011-3027, doi:10.1007/s00382-016-3010-1.
- Martineau, P., S.-W. Son, and M. Taguchi, 2016: Dynamical Consistency of Reanalysis Datasets in the Extratropical Stratosphere. J. Clim., 29, 3057-3074, doi:10.1175/JCLI-D-15-0469.1.
- Matthews, T., D. Mullan, R. L. Wilby, C. Broderick, and C. Murphy, 2016: Past and future climate change in the context of memorable seasonal extremes. Clim Risk Manag, 11, 37-52, doi:10.1016/j.crm.2016.01.004.
- Matthews, T., C. Murphy, R. L. Wilby, and S. Harrigan, 2016: A cyclone climatology of the British-Irish Isles 1871-2012. International Journal of Climatology, 36, 1299-1312, doi:10.1002/joc.4425.
- McCusker, K. E., J. C. Fyfe, and M. Sigmond, 2016: Twenty-five winters of unexpected Eurasian cooling unlikely due to Arctic sea-ice loss. Nature Geoscience, 9, 838-+, doi:10.1038/NGEO2820.
- Menezes, V. V., H. E. Phillips, M. L. Vianna, and N. L. Bindoff, 2016: Interannual variability of the South Indian Countercurrent. Journal of Geophysical Research-Oceans, 121, 3465-3487, doi:10.1002/2015JC011417.
- Mikhailova, N. V., and A. V. Yurovsky, 2016: The East Atlantic Oscillation: Mechanism and Impact on the European Climate in Winter. Physical Oceanography, 25-33, doi:10.22449/1573-160X-2016-4-25-33.
- Mikhailova, N. V., A. V. Yurovsky, and А. В. Юровский, 2016: East Atlantic Oscillation: mechanism and impact on the European climate in winter. Physical Oceanography, 27-37, doi:Miksovsky, J., E. Holtanova, and P. Pisoft, 2016: Imprints of climate forcings in global gridded temperature data. Earth System Dynamics, 7, 231-249, doi:10.5194/esd-7-231-2016.
- Mo, K. C., and D. P. Lettenmaier, 2016: Precipitation Deficit Flash Droughts over the United States. Journal of Hydrometeorology, 17, 1169-1184, doi:10.1175/JHM-D-15-0158.1.
- Mohino, E., N. Keenlyside, and H. Pohlmann, 2016: Decadal prediction of Sahel rainfall: where does the skill (or lack thereof) come from? Climate Dynamics, 47, 3593-3612, doi:10.1007/s00382-016-3416-9.
- Moore, G. W. K., 2016: The March 1972 northwest Greenland windstorm: evidence of downslope winds associated with a trapped lee wave. Quarterly Journal of the Royal Meteorological Society, 142, 1428-1438, doi:10.1002/qj.2744.
- Mudd, S. M., M.-A. Harel, M. D. Hurst, S. W. D. Grieve, and S. M. Marrero, 2016: The CAIRN method: automated, reproducible calculation of catchment-averaged denudation rates from cosmogenic nuclide concentrations. Earth Surface Dynamics, 4, 655-674, doi:10.5194/esurf-4-655-2016.
- Mueller Schmied, H., and Coauthors, 2016: Variations of global and continental water balance components as impacted by climate forcing uncertainty and human water use. Hydrology and Earth System Sciences, 20, 2877-2898, doi:10.5194/hess-20-2877-2016.
- Munoz, A. G., J. Diaz-Lobaton, X. Chourio, and M. J. Stock, 2016: Seasonal prediction of lightning activity in North Western Venezuela: Large-scale versus local drivers. Atmospheric Research, 172, 147-162, doi:10.1016/j.atmosres.2015.12.018.
- Naik, M., and B. J. Abiodun, 2016: Potential impacts of forestation on future climate change in Southern Africa. International Journal of Climatology, 36, 4560-4576, doi:10.1002/joc.4652.
- Najafi, M. R., F. W. Zwiers, and N. P. Gillett, 2016: Attribution of the spring snow cover extent decline in the Northern Hemisphere, Eurasia and North America to anthropogenic influence. Climatic Change, 136, 571-586, doi:10.1007/s10584-016-1632-2.
- Nath, D., and Coauthors, 2016: Subtropical Potential Vorticity Intrusion Drives Increasing Tropospheric Ozone over the Tropical Central Pacific. Scientific Reports, 6, doi:10.1038/srep21370.
- Nnamchi, H. C., J. Li, F. Kucharski, I.-S. Kang, N. S. Keenlyside, P. Chang, and R. Farneti, 2016: An Equatorial-Extratropical Dipole Structure of the Atlantic Nino. J. Clim., 29, 7295-7311, doi:10.1175/JCLI-D-15-0894.1.
- Nygard, T., and Coauthors, 2016: Validation of eight atmospheric reanalyses in the Antarctic Peninsula region. Quarterly Journal of the Royal Meteorological Society, 142, 684-692, doi:10.1002/qj.2691. Oki, T., and H. Kim, 2016: Macroscale Hydrological Modeling and Global Water Balance. Terrestrial Water Cycle and Climate Change: Natural and Human-Induced Impacts, 3-16.
- Oliver, E. C. J., 2016: Blind use of reanalysis data: apparent trends in Madden-Julian Oscillation activity driven by observational changes. International Journal of Climatology, 36, 3458-3468, doi:10.1002/joc.4568.
- Ordonez, P., D. Gallego, P. Ribera, C. Pena-Ortiz, and R. Garcia-Herrera, 2016: Tracking the Indian Summer Monsoon Onset Back to the Preinstrument Period. J. Clim., 29, 8115-8127, doi:10.1175/JCLI-D-15-0788.1.
- OrtizBevia, M. J., A. RuizdeElvira, F. J. Alvarez-Garcia, and M. Tasambay-Salazar, 2016: The multidecadal component of the Mediterranean summer variability. Climate Dynamics, 47, 3373-3386, doi:10.1007/s00382-016-3341-y.
- Painter, S. C., M. Finlay, V. S. Hemsley, and A. P. Martin, 2016: Seasonality, phytoplankton succession and the biogeochemical impacts of an autumn storm in the northeast Atlantic Ocean. Prog Oceanogr, 142, 72-104, doi:10.1016/j.pocean.2016.02.001.
- Pal, J., S. Chaudhuri, A. R. Chowdhury, and T. Bandyopadhyay, 2016: Cloud - Aerosol interaction during lightning activity over land and ocean: Precipitation pattern assessment. Asia-Pacific Journal of Atmospheric Sciences, 52, 251-261, doi:10.1007/s13143-015-0087-0.
- Palmer, J. G., and Coauthors, 2016: Changes in El Nino - Southern Oscillation (ENSO) conditions during the Greenland Stadial 1 (GS-1) chronozone revealed by NeW Zealand tree-rings. Quaternary Science Reviews, 153, 139-155, doi:10.1016/j.quascirev.2016.10.003.
- Park, M., Y. Choi, and S.-W. Son, 2016: The Impact of Satellite Observations on Large-Scale Atmospheric Circulation in the Reanalysis Data: A Comparison Between JRA-55 and JRA-55C. Atmosphere-Korea, 26, 523-540, doi:10.14191/Atmos.2016.26.4.523.
- Parker, W. S., 2016: REANALYSES AND OBSERVATIONS What's the Difference? Bulletin of the American Meteorological Society, 97, 1565-+, doi:10.1175/BAMS-D-14-00226.1.
- Peings, Y., G. Simpkins, and G. Magnusdottir, 2016: Multidecadal fluctuations of the North Atlantic Ocean and feedback on the winter climate in CMIP5 control simulations. Journal of Geophysical Research-Atmospheres, 121, 2571-2592, doi:10.1002/2015JD024107.
- Pena-Angulo, D., R. M. Trigo, N. Cortesi, and J. C. Gonzalez-Hidalgo, 2016: The influence of weather types on the monthly average maximum and minimum temperatures in the Iberian Peninsula. Atmospheric Research, 178, 217-230, doi:10.1016/j.atmosres.2016.03.022.
- Pereira, S., A. M. Ramos, J. L. Zezere, R. M. Trigo, and J. M. Vaquero, 2016: Spatial impact and triggering conditions of the exceptional hydro-geomorphological event of December 1909 in Iberia. Natural Hazards and Earth System Sciences, 16, 371-390, doi:10.5194/nhess-16-371-2016.
- Perez-Zanon, N., M. Carmen Casas-Castillo, R. Rodriguez-Sola, J. Carlos Pena, A. Rius, J. German Sole, and A. Redano, 2016: Analysis of extreme rainfall in the Ebre Observatory (Spain). Theoretical and Applied Climatology, 124, 935-944, doi:10.1007/s00704-015-1476-0.
- Piecuch, C. G., S. Dangendorf, R. M. Ponte, and M. Marcos, 2016: Annual Sea Level Changes on the North American Northeast Coast: Influence of Local Winds and Barotropic Motions. J. Clim., 29, 4801-4816, doi:10.1175/JCLI-D-16-0048.1.
- Piecuch, C. G., P. R. Thompson, and K. A. Donohue, 2016: Air pressure effects on sea level changes during the twentieth century. Journal of Geophysical Research-Oceans, 121, 7917-7930, doi:10.1002/2016JC012131.
- Pino, D., and Coauthors, 2016: Meteorological and hydrological analysis of major floods in NE Iberian Peninsula. Journal of Hydrology, 541, 63-89, doi:10.1016/j.jhydrol.2016.02.008.
- Pirloaga, R., and V. Dobrica, 2016: The North Temperate Climate on Long-Term Timescales. Connection to Solar Variability. Romanian Journal of Physics, 61, 1098-1107, doi:Poli, P., and Coauthors, 2016: ERA-20C: An Atmospheric Reanalysis of the Twentieth Century. J. Clim., 29, 4083-4097, doi:10.1175/JCLI-D-15-0556.1.
- Prasanna, V., 2016: South Asian Summer Monsoon Rainfall Variability and Trend: Its Links to Indo-Pacific SST Anomalies and Moist Processes. Pure and Applied Geophysics, 173, 2167-2193, doi:10.1007/s00024-015-1232-5.
- Przybylak, R., P. Wyszynski, O. Nordli, and T. Strzyzewski, 2016: Air temperature changes in Svalbard and the surrounding seas from 1865 to 1920. International Journal of Climatology, 36, 2899-2916, doi:10.1002/joc.4527.
- Qian, W., K. Wu, J. C.-H. Leung, and J. Shi, 2016: Long-term trends of the Polar and Arctic cells influencing the Arctic climate since 1989. Journal of Geophysical Research-Atmospheres, 121, 2679-2690, doi:10.1002/2015JD024252. Quante, M., and Coauthors, 2016: Introduction to the Assessment-Characteristics of the Region. North Sea Region Climate Change Assessment, 1-52.
- Ren, Y., D. Parker, G. Ren, and R. Dunn, 2016: Tempo-spatial characteristics of sub-daily temperature trends in mainland China. Climate Dynamics, 46, 2737-2748, doi:10.1007/s00382-015-2726-7.
- Rimbu, N., M. Czymzik, M. Ionita, G. Lohmann, and A. Brauer, 2016: Atmospheric circulation patterns associated with the variability of River Ammer floods: evidence from observed and proxy data. Climate of the Past, 12, 377-385, doi:10.5194/cp-12-377-2016.
- Rimbu, N., S. Stefan, A. Busuioc, and F. Georgescu, 2016: Links between blocking circulation and precipitation extremes over Romania in summer. International Journal of Climatology, 36, 369-376, doi:10.1002/joc.4353. Robertson, A. W., Y. Kushnir, U. Lall, and J. Nakamura, 2016: Weather and Climatic Drivers of Extreme Flooding Events over the Midwest of the United States. Extreme Events: Observations, Modeling, and Economics, 115-124.
- Robertson, F. R., M. G. Bosilovich, and J. B. Roberts, 2016: Reconciling Land-Ocean Moisture Transport Variability in Reanalyses with P - ET in Observationally Driven Land Surface Models. J. Clim., 29, 8625-8646, doi:10.1175/JCLI-D-16-0379.1.
- Rodwell, M. J., and Coauthors, 2016: Reliability in ensemble data assimilation. Quarterly Journal of the Royal Meteorological Society, 142, 443-454, doi:10.1002/qj.2663.
- Rueda, A., P. Camus, F. J. Mendez, A. Tomas, and A. Luceno, 2016: An extreme value model for maximum wave heights based on weather types. Journal of Geophysical Research-Oceans, 121, 1262-1273, doi:10.1002/2015JC010952.
- Saarni, S., F. Muschitiello, S. Weege, A. Brauer, and T. Saarinen, 2016: A late Holocene record of solar-forced atmospheric blocking variability over Northern Europe inferred from varved lake sediments of Lake Kuninkaisenlampi. Quaternary Science Reviews, 154, 100-110, doi:10.1016/j.quascirev.2016.10.019.
- Saffioti, C., E. M. Fischer, S. C. Scherrer, and R. Knutti, 2016: Reconciling observed and modeled temperature and precipitation trends over Europe by adjusting for circulation variability. Geophysical Research Letters, 43, 8189-8198, doi:10.1002/2016GL069802.
- Saha, M., P. Mitra, and R. S. Nanjundiah, 2016: Autoencoder-based identification of predictors of Indian monsoon. Meteorology and Atmospheric Physics, 128, 613-628, doi:10.1007/s00703-016-0431-7.
- Sasaki, W., 2016: Impact of Satellite Data Assimilation in Atmospheric Reanalysis on the Marine Wind and Wave Climate. J. Clim., 29, 6351-6361, doi:10.1175/JCLI-D-16-0056.1.
- Scherrer, S. C., M. Begert, M. Croci-Maspoli, and C. Appenzeller, 2016: Long series of Swiss seasonal precipitation: regionalization, trends and influence of large-scale flow. International Journal of Climatology, 36, 3673-3689, doi:10.1002/joc.4584.
- Schindelegger, M., D. Einspigel, D. Salstein, and J. Boehm, 2016: The Global S Tide in Earth's Nutation. Surv Geophys, 37, 643-680, doi:10.1007/s10712-016-9365-3.
- Schulte, J. A., R. G. Najjar, and M. Li, 2016: The influence of climate modes on streamflow in the Mid-Atlantic region of the United States. J Hydrol-Reg Stud, 5, 80-99, doi:10.1016/j.ejrh.2015.11.003. Serykh, I. V., 2016: Influence of the North Atlantic dipole on climate changes over Eurasia. International Conference and Early Career Scientists School on Environmental Observations, Modelling and Information Systems.
- Shen, S. S. P., O. Wied, A. Weithmann, T. Regele, B. A. Bailey, and J. H. Lawrimore, 2016: Six temperature and precipitation regimes of the contiguous United States between 1895 and 2010: a statistical inference study. Theoretical and Applied Climatology, 125, 197-211, doi:10.1007/s00704-015-1502-2.
- Si, D., and Y. Ding, 2016: Oceanic Forcings of the Interdecadal Variability in East Asian Summer Rainfall. J. Clim., 29, 7633-7649, doi:10.1175/JCLI-D-15-0792.1.
- Sigmond, M., and J. C. Fyfe, 2016: Tropical Pacific impacts on cooling North American winters. Nature Climate Change, 6, 970-+, doi:10.1038/NCLIMATE3069.
- Simmons, A., J.-L. Fellous, V. Ramaswamy, and K. Trenberth, 2016: Observation and integrated Earth-system science: A roadmap for 2016-2025. Advances in Space Research, 57, 2037-2103, doi:10.1016/j.asr.2016.03.008.
- Siqueira, L., and B. P. Kirtman, 2016: Atlantic near-term climate variability and the role of a resolved Gulf Stream. Geophysical Research Letters, 43, 3964-3972, doi:10.1002/2016GL068694.
- Slater, A. G., 2016: Surface Solar Radiation in North America: A Comparison of Observations, Reanalyses, Satellite, and Derived Products. Journal of Hydrometeorology, 17, 401-420, doi:10.1175/JHM-D-15-0087.1.
- Smith, S. M., 2016: Contributions of recent barometric pressure trends to rates of sea level rise in southeastern Massachusetts (USA). Regional Studies in Marine Science, 8, 41-50, doi:10.1016/j.rsma.2016.09.005.
- Solman, S. A., and I. Orlanski, 2016: Climate Change over the Extratropical Southern Hemisphere: The Tale from an Ensemble of Reanalysis Datasets. J. Clim., 29, 1673-1687, doi:10.1175/JCLI-D-15-0588.1.
- Staehling, E. M., and R. E. Truchelut, 2016: Diagnosing United States hurricane landfall risk: An alternative to count-based methodologies. Geophysical Research Letters, 43, 8798-8805, doi:10.1002/2016GL070117.
- Steinman, B. A., and Coauthors, 2016: Oxygen isotope records of Holocene climate variability in the Pacific Northwest. Quaternary Science Reviews, 142, 40-60, doi:10.1016/j.quascirev.2016.04.012. Stendel, M., and Coauthors, 2016: Recent Change-Atmosphere. North Sea Region Climate Change Assessment, 55-84.
- Storto, A., C. Yang, and S. Masina, 2016: Sensitivity of global ocean heat content from reanalyses to the atmospheric reanalysis forcing: A comparative study. Geophysical Research Letters, 43, 5261-5270, doi:10.1002/2016GL068605.
- Stott, P. A., and Coauthors, 2016: Attribution of extreme weather and climate-related events. Wiley Interdisciplinary Reviews-Climate Change, 7, 23-41, doi:10.1002/wcc.380.
- Stramma, L., R. Czeschel, T. Tanhua, P. Brandt, M. Visbeck, and B. S. Giese, 2016: The flow field of the upper hypoxic eastern tropical North Atlantic oxygen minimum zone. Ocean Science, 12, 153-167, doi:10.5194/os-12-153-2016.
- Stryhal, J., and R. Huth, 2016: Classifications of atmospheric circulation. Geografie, 121, 300-323, doi:Stucki, P., S. Dierer, C. Welker, J. J. Gomez-Navarro, C. C. Raible, O. Martius, and S. Bronnimann, 2016: Evaluation of downscaled wind speeds and parameterised gusts for recent and historical windstorms in Switzerland. Tellus Series a-Dynamic Meteorology and Oceanography, 68, doi:10.3402/tellusa.v68.31820.
- Sun, J., S. Wu, and J. Ao, 2016: Role of the North Pacific sea surface temperature in the East Asian winter monsoon decadal variability. Climate Dynamics, 46, 3793-3805, doi:10.1007/s00382-015-2805-9.
- Takahashi, C., and M. Watanabe, 2016: Pacific trade winds accelerated by aerosol forcing over the past two decades. Nature Climate Change, 6, 768-+, doi:10.1038/NCLIMATE2996.
- Tao, Y., J. Cao, G. Lan, and Q. Su, 2016: The zonal movement of the Indian-East Asian summer monsoon interface in relation to the land-sea thermal contrast anomaly over East Asia. Climate Dynamics, 46, 2759-2771, doi:10.1007/s00382-015-2729-4.
- Tapiador, F. J., A. Behrangi, Z. S. Haddad, D. Katsanos, and M. de Castro, 2016: Disruptions in precipitation cycles: Attribution to anthropogenic forcing. Journal of Geophysical Research-Atmospheres, 121, 2161-2177, doi:10.1002/2015JD023406.
- Thomas, J. A., A. A. Berg, and W. J. Merryfield, 2016: Influence of snow and soil moisture initialization on sub-seasonal predictability and forecast skill in boreal spring. Climate Dynamics, 47, 49-65, doi:10.1007/s00382-015-2821-9.
- Tian, D., M. Pan, L. Jia, G. Vecchi, and E. F. Wood, 2016: Assessing GFDL high-resolution climate model water and energy budgets from AMIP simulations over Africa. Journal of Geophysical Research-Atmospheres, 121, 8444-8459, doi:10.1002/2016JD025068. Titley, D. W., 2016: ATTRIBUTION OF Extreme Weather Events IN THE CONTEXT OF Climate Change Preface. Attribution of Extreme Weather Events in the Context of Climate Change, IX-+.
- Turney, C. S. M., and Coauthors, 2016: Anomalous mid-twentieth century atmospheric circulation change over the South Atlantic compared to the last 6000 years. Environmental Research Letters, 11, doi:10.1088/1748-9326/11/6/064009.
- Turney, C. S. M., and Coauthors, 2016: Intensification of Southern Hemisphere westerly winds 2000-1000 years ago: evidence from the subantarctic Campbell and Auckland Islands (52-50 degrees S). Journal of Quaternary Science, 31, 12-19, doi:10.1002/jqs.2828.
- van den Hurk, B., and Coauthors, 2016: LS3MIP (v1.0) contribution to CMIP6: the Land Surface, Snow and Soil moisture Model Intercomparison Project - aims, setup and expected outcome. Geoscientific Model Development, 9, 2809-2832, doi:10.5194/gmd-9-2809-2016.
- Viana, D. R., and C. A. Sansigolo, 2016: Monthly and Seasonal Rainfall Forecasting in Southern Brazil Using Multiple Discriminant Analysis. Weather Forecast, 31, 1947-1960, doi:10.1175/WAF-D-15-0155.1.
- Vijayakumar, D. B. I. P., F. Raulier, P. Bernier, D. Pare, S. Gauthier, Y. Bergeron, and D. Pothier, 2016: Cover density recovery after fire disturbance controls landscape aboveground biomass carbon in the boreal forest of eastern Canada. Forest Ecology and Management, 360, 170-180, doi:10.1016/j.foreco.2015.10.035.
- Wahl, T., and D. P. Chambers, 2016: Climate controls multidecadal variability in U. S. extreme sea level records. Journal of Geophysical Research-Oceans, 121, 1274-1290, doi:10.1002/2015JC011057.
- Wang, H., S.-P. Xie, H. Tokinaga, Q. Liu, and Y. Kosaka, 2016: Detecting cross-equatorial wind change as a fingerprint of climate response to anthropogenic aerosol forcing. Geophysical Research Letters, 43, 3444-3450, doi:10.1002/2016GL068521.
- Wang, X., and H. Liu, 2016: Seasonal-to-interannual variability of the barrier layer in the western Pacific warm pool associated with ENSO. Climate Dynamics, 47, 375-392, doi:10.1007/s00382-015-2842-4.
- Wang, X., and H. Liu, 2016: PDO modulation of ENSO effect on tropical cyclone rapid intensification in the western North Pacific. Climate Dynamics, 46, 15-28, doi:10.1007/s00382-015-2563-8.
- Wang, X. L., Y. Feng, R. Chan, and V. Isaac, 2016: Inter-comparison of extra-tropical cyclone activity in nine reanalysis datasets. Atmospheric Research, 181, 133-153, doi:10.1016/j.atmosres.2016.06.010.
- Welker, C., O. Martius, P. Stucki, D. Bresch, S. Dierer, and S. Bronnimann, 2016: Modelling economic losses of historic and present-day high-impact winter windstorms in Switzerland. Tellus Series a-Dynamic Meteorology and Oceanography, 68, doi:10.3402/tellusa.v68.29546.
- Weller, H., P. Browne, C. Budd, and M. Cullen, 2016: Mesh adaptation on the sphere using optimal transport and the numerical solution of a Monge-Ampere type equation. Journal of Computational Physics, 308, 102-123, doi:10.1016/j.jcp.2015.12.018.
- Werner, A. T., and A. J. Cannon, 2016: Hydrologic extremes - an intercomparison of multiple gridded statistical downscaling methods. Hydrology and Earth System Sciences, 20, 1483-1508, doi:10.5194/hess-20-1483-2016.
- Wickert, A. D., 2016: Open-source modular solutions for flexural isostasy: gFlex v1.0. Geoscientific Model Development, 9, 997-1017, doi:10.5194/gmd-9-997-2016.
- Williamson, F., 2016: Cross-disciplinary working in the sciences and humanities: historical data rescue activities in Southeast Asia and beyond. Geoscience Letters, 3, doi:10.1186/s40562-016-0062-3.
- Wu, B., J. Lin, and T. Zhou, 2016: Interdecadal circumglobal teleconnection pattern during boreal summer. Atmospheric Science Letters, 17, 446-452, doi:10.1002/asl.677.
- Wu, B., T. Zhou, and T. Li, 2016: Impacts of the Pacific-Japan and Circumglobal Teleconnection Patterns on the Interdecadal Variability of the East Asian Summer Monsoon. J. Clim., 29, 3253-3271, doi:10.1175/JCLI-D-15-0105.1. Wu, L., X. Li, and T. Wu, 2016: South China Sea Wave Height Trends Analysis Using 20CR Reanalysis. Proceedings of the 2016 International Conference on Automatic Control and Information Engineering, 57-61.
- Wu, X., and J. Mao, 2016: Interdecadal modulation of ENSO-related spring rainfall over South China by the Pacific Decadal Oscillation. Climate Dynamics, 47, 3203-3220, doi:10.1007/s00382-016-3021-y.
- Wu, Y., M. Latif, and W. Park, 2016: Multiyear predictability of Northern Hemisphere surface air temperature in the Kiel Climate Model. Climate Dynamics, 47, 793-804, doi:10.1007/s00382-015-2871-z.
- Wu, Z., X. Li, Y. Li, and Y. Li, 2016: Potential Influence of Arctic Sea Ice to the Interannual Variations of East Asian Spring Precipitation*. J. Clim., 29, 2797-2813, doi:10.1175/JCLI-D-15-0128.1.
- Wu, Z., P. Zhang, H. Chen, and Y. Li, 2016: Can the Tibetan Plateau snow cover influence the interannual variations of Eurasian heat wave frequency? Climate Dynamics, 46, 3405-3417, doi:10.1007/s00382-015-2775-y.
- Xia, J., K. Tu, Z. Yan, and Y. Qi, 2016: The super-heat wave in eastern China during July-August 2013: a perspective of climate change. International Journal of Climatology, 36, 1291-1298, doi:10.1002/joc.4424.
- Xie, A., and Coauthors, 2016: Can temperature extremes in East Antarctica be replicated from ERA Interim reanalysis? Arct Antarct Alp Res, 48, 603-621, doi:10.1657/AAAR0015-048.
- Yamamoto, A., and J. B. Palter, 2016: The absence of an Atlantic imprint on the multidecadal variability of wintertime European temperature. Nature Communications, 7, doi:10.1038/ncomms10930.
- Yang, H., K. R. Johnson, M. L. Griffiths, and K. Yoshimura, 2016: Interannual controls on oxygen isotope variability in Asian monsoon precipitation and implications for paleoclimate reconstructions. Journal of Geophysical Research-Atmospheres, 121, 8410-8428, doi:10.1002/2015JD024683.
- Yang, H., G. Lohmann, W. Wei, M. Dima, M. Ionita, and J. Liu, 2016: Intensification and poleward shift of subtropical western boundary currents in a warming climate. Journal of Geophysical Research-Oceans, 121, 4928-4945, doi:10.1002/2015JC011513.
- Yang, Y., and Y. Du, 2016: Decadal variability of oceanic advection in the South China Sea associated with ENSO and Indian-Ocean Basin and its impacts on SST. Journal of Tropical Oceanography, 35, 72-81, doi:Yu, B., H. Lin, Z. W. Wu, and W. J. Merryfield, 2016: Relationship between North American winter temperature and large-scale atmospheric circulation anomalies and its decadal variation. Environmental Research Letters, 11, doi:10.1088/1748-9326/11/7/074001.
- Yu, P., L. Zhang, Y. Zhang, and B. Deng, 2016: Interdecadal change of winter SST variability in the Kuroshio Extension region and its linkage with Aleutian atmospheric low pressure system. Acta Oceanologica Sinica, 35, 24-37, doi:10.1007/s13131-016-0859-0.
- Zambri, B., and A. Robock, 2016: Winter warming and summer monsoon reduction after volcanic eruptions in Coupled Model Intercomparison Project 5 (CMIP5) simulations. Geophysical Research Letters, 43, 10920-10928, doi:10.1002/2016GL070460.
- Zampieri, M., S. Russo, S. di Sabatino, M. Michetti, E. Scoccimarro, and S. Gualdi, 2016: Global assessment of heat wave magnitudes from 1901 to 2010 and implications for the river discharge of the Alps. Science of the Total Environment, 571, 1330-1339, doi:10.1016/j.scitotenv.2016.07.008.
- Zhan, W., K. Guan, J. Sheffield, and E. F. Wood, 2016: Depiction of drought over sub-Saharan Africa using reanalyses precipitation data sets. Journal of Geophysical Research-Atmospheres, 121, 10555-10574, doi:10.1002/2016JD024858.
- Zhang, L., H. Ma, and L. Wu, 2016: Dynamics and mechanisms of decadal variability of the Pacific-South America mode over the 20th century. Climate Dynamics, 46, 3657-3667, doi:10.1007/s00382-015-2794-8.
- Zhang, X., L. Jin, and W. Jia, 2016: Centennial-scale teleconnection between North Atlantic sea surface temperatures and the Indian summer monsoon during the Holocene. Climate Dynamics, 46, 3323-3336, doi:10.1007/s00382-015-2771-2.
- Zhao, L., Y. Zhu, H. Liu, Z. Liu, Y. Liu, X. Li, and Z. Chen, 2016: A stable snow-atmosphere coupled mode. Climate Dynamics, 47, 2085-2104, doi:10.1007/s00382-015-2952-z.
- Zhao, P., and Coauthors, 2016: Summer precipitation anomalies in Asia and North America induced by Eurasian non-monsoon land heating versus ENSO. Scientific Reports, 6, doi:10.1038/srep21346.
- Zhou, B., Y. Xu, J. Wu, S. Dong, and Y. Shi, 2016: Changes in temperature and precipitation extreme indices over China: analysis of a high-resolution grid dataset. International Journal of Climatology, 36, 1051-1066, doi:10.1002/joc.4400.
- Zhou, T., and Coauthors, 2016: GMMIP (v1.0) contribution to CMIP6: Global Monsoons Model Inter-comparison Project. Geoscientific Model Development, 9, doi:10.5194/gmd-9-3589-2016.
- Zhou, Y., and Z. Wu, 2016: Possible impacts of mega-El Nino/Southern Oscillation and Atlantic Multidecadal Oscillation on Eurasian heatwave frequency variability. Quarterly Journal of the Royal Meteorological Society, 142, 1647-1661, doi:10.1002/qj.2759.
- Agosta, C., X. Fettweis, and R. Datta, 2015: Evaluation of the CMIP5 models in the aim of regional modelling of the Antarctic surface mass balance. Cryosphere, 9, 2311-2321, doi:10.5194/tc-9-2311-2015.
- Alexeev, V. A., E. S. Euskirchen, J. E. Cherry, and R. C. Busey, 2015: Tundra burning in 2007-Did sea ice retreat matter? Polar Science, 9, 185-195, doi:10.1016/j.polar.2015.02.002.
- Allen, R. J., A. T. Evan, and B. B. B. Booth, 2015: Interhemispheric Aerosol Radiative Forcing and Tropical Precipitation Shifts during the Late Twentieth Century. J. Clim., 28, 8219-8246, doi:10.1175/JCLI-D-15-0148.1.
- Alsan, M., 2015: The Effect of the TseTse Fly on African Development. American Economic Review, 105, 382-410, doi:10.1257/aer.20130604.
- Amiruddin, A. M., I. D. Haigh, M. N. Tsimplis, F. M. Calafat, and S. Dangendorf, 2015: The seasonal cycle and variability of sea level in the South China Sea. Journal of Geophysical Research-Oceans, 120, 5490-5513, doi:10.1002/2015JC010923.
- Anchukaitis, K. J., M. J. Taylor, C. Leland, D. Pons, J. Martin-Fernandez, and E. Castellanos, 2015: Tree-ring reconstructed dry season rainfall in Guatemala. Climate Dynamics, 45, 1537-1546, doi:10.1007/s00382-014-2407-y.
- Andres, H. J., and W. R. Peltier, 2015: Attributing observed Greenland responses to natural and anthropogenic climate forcings. Climate Dynamics, 45, 2919-2936, doi:10.1007/s00382-015-2514-4.
- Arndt, D. S., and Coauthors, 2015: State of the Climate in 2014. Bulletin of the American Meteorological Society, 96, S1-S267, doi:10.1175/2015BAMSStateoftheClimate.1.
- Arns, A., T. Wahl, S. Dangendorf, and J. Jensen, 2015: The impact of sea level rise on storm surge water levels in the northern part of the German Bight. Coastal Engineering, 96, 118-131, doi:10.1016/j.coastaleng.2014.12.002.
- Arns, A., T. Wahl, I. D. Haigh, and J. Jensen, 2015: Determining return water levels at ungauged coastal sites: a case study for northern Germany. Ocean Dynamics, 65, 539-554, doi:10.1007/s10236-015-0814-1.
- Bao, M., and J. M. Wallace, 2015: Cluster Analysis of Northern Hemisphere Wintertime 500-hPa Flow Regimes during 1920-2014*. J Atmos Sci, 72, 3597-3608, doi:10.1175/JAS-D-15-0001.1.
- Belleflamme, A., X. Fettweis, and M. Erpicum, 2015: Recent summer Arctic atmospheric circulation anomalies in a historical perspective. Cryosphere, 9, 53-64, doi:10.5194/tc-9-53-2015.
- Bellomo, K., and A. C. Clement, 2015: Evidence for weakening of the Walker circulation from cloud observations. Geophysical Research Letters, 42, 7758-7766, doi:10.1002/2015GL065463.
- Benestad, R. E., and A. Mezghani, 2015: On downscaling probabilities for heavy 24-hour precipitation events at seasonal-to-decadal scales. Tellus Series a-Dynamic Meteorology and Oceanography, 67, doi:10.3402/tellusa.v67.25954. Bhend, J., 2015: Regional Evidence of Global Warming. Second Assessment of Climate Change for the Baltic Sea Basin, 427-439.
- Bierstedt, S. E., B. Huenicke, and E. Zorita, 2015: Variability of wind direction statistics of mean and extreme wind events over the Baltic Sea region. Tellus Series a-Dynamic Meteorology and Oceanography, 67, doi:10.3402/tellusa.v67.29073.
- Bliznak, V., M. A. Valente, and J. Bethke, 2015: Homogenization of time series from Portugal and its former colonies for the period from the late 19th to the early 21st century. International Journal of Climatology, 35, 2400-2418, doi:10.1002/joc.4151.
- Brnoenimann, S., 2015: Pacemakers of warming. Nature Geoscience, 8, 87-89, doi:10.1038/ngeo2330.
- Broennimann, S., A. M. Fischer, E. Rozanov, P. Poli, G. P. Compo, and P. D. Sardeshmukh, 2015: Southward shift of the northern tropical belt from 1945 to 1980. Nature Geoscience, 8, 969-U110, doi:10.1038/NGEO2568.
- Brugnara, Y., and Coauthors, 2015: A collection of sub-daily pressure and temperature observations for the early instrumental period with a focus on the "year without a summer" 1816. Climate of the Past, 11, 1027-1047, doi:10.5194/cp-11-1027-2015.
- Burgess, M. L., and N. P. Klingaman, 2015: Atmospheric circulation patterns associated with extreme cold winters in the UK. Weather, 70, 211-217, doi:10.1002/wea.2476.
- Burn, M. J., and S. E. Palmer, 2015: Atlantic hurricane activity during the last millennium. Scientific Reports, 5, doi:10.1038/srep12838.
- Burt, T. P., P. D. Jones, and N. J. K. Howden, 2015: An analysis of rainfall across the British Isles in the 1870s. International Journal of Climatology, 35, 2934-2947, doi:10.1002/joc.4184.
- Campagne, P., and Coauthors, 2015: Glacial ice and atmospheric forcing on the Mertz Glacier Polynya over the past 250 years. Nature Communications, 6, doi:10.1038/ncomms7642.
- Capotondi, A., and Coauthors, 2015: Understanding ENSO Diversity. Bulletin of the American Meteorological Society, 96, 921-938, doi:10.1175/BAMS-D-13-00117.1.
- Carlos Pena, J., M. Aran, J. Miguel Raso, and N. Perez-Zanon, 2015: Principal sequence pattern analysis of episodes of excess mortality due to heat in the Barcelona metropolitan area. International Journal of Biometeorology, 59, 435-446, doi:10.1007/s00484-014-0857-x.
- Cauquoin, A., P. Jean-Baptiste, C. Risi, E. Fourre, B. Stenni, and A. Landais, 2015: The global distribution of natural tritium in precipitation simulated with an Atmospheric General Circulation Model and comparison with observations. Earth and Planetary Science Letters, 427, 160-170, doi:10.1016/j.epsl.2015.06.043.
- Champion, A. J., R. P. Allan, and D. A. Lavers, 2015: Atmospheric rivers do not explain UK summer extreme rainfall. Journal of Geophysical Research-Atmospheres, 120, 6731-6741, doi:10.1002/2014JD022863.
- Chen, S., R. Wu, and W. Chen, 2015: The Changing Relationship between Interannual Variations of the North Atlantic Oscillation and Northern Tropical Atlantic SST. J. Clim., 28, 485-504, doi:10.1175/JCLI-D-14-00422.1.
- Chen, X., and J. M. Wallace, 2015: ENSO-Like Variability: 1900-2013. J. Clim., 28, 9623-9641, doi:10.1175/JCLI-D-15-0322.1.
- Colgan, W., and Coauthors, 2015: Greenland high-elevation mass balance: inference and implication of reference period (1961-90) imbalance. Annals of Glaciology, 56, 105-117, doi:10.3189/2015AoG70A967.
- Cram, T. A., and Coauthors, 2015: The International Surface Pressure Databank version 2. Geoscience Data Journal, 2, 31-46, doi:10.1002/gdj3.25.
- Cropper, T., E. Hanna, M. A. Valente, and T. Jonsson, 2015: A daily Azores-Iceland North Atlantic Oscillation index back to 1850. Geoscience Data Journal, 2, 12-24, doi:10.1002/gdj3.23.
- D'Arrigo, R., and C. C. Ummenhofer, 2015: The climate of Myanmar: evidence for effects of the Pacific Decadal Oscillation. International Journal of Climatology, 35, 634-640, doi:10.1002/joc.3995.
- Dangendorf, S., M. Marcos, A. Mueller, E. Zorita, R. Riva, K. Berk, and J. Jensen, 2015: Detecting anthropogenic footprints in sea level rise. Nature Communications, 6, doi:10.1038/ncomms8849.
- Dawson, A., and T. N. Palmer, 2015: Simulating weather regimes: impact of model resolution and stochastic parameterization. Climate Dynamics, 44, 2177-2193, doi:10.1007/s00382-014-2238-x.
- Dayon, G., J. Boe, and E. Martin, 2015: Transferability in the future climate of a statistical downscaling method for precipitation in France. Journal of Geophysical Research-Atmospheres, 120, 1023-1043, doi:10.1002/2014JD022236.
- de Lima, M. I. P., and S. Lovejoy, 2015: Macroweather precipitation variability up to global and centennial scales. Water Resources Research, 51, 9490-9513, doi:10.1002/2015WR017455.
- DeRose, R. J., and Coauthors, 2015: A millennium-length reconstruction of Bear River stream flow, Utah. Journal of Hydrology, 529, 524-534, doi:10.1016/j.jhydrol.2015.01.014.
- Diaconescu, E. P., P. Gachon, J. Scinocca, and R. Laprise, 2015: Evaluation of daily precipitation statistics and monsoon onset/retreat over western Sahel in multiple data sets. Climate Dynamics, 45, 1325-1354, doi:10.1007/s00382-014-2383-2.
- Diaz, H. F., and E. R. Wahl, 2015: Recent California Water Year Precipitation Deficits: A 440-Year Perspective*. J. Clim., 28, 4637-4652, doi:10.1175/JCLI-D-14-00774.1.
- Dominguez-Castro, F., A. M. Ramos, R. Garcia-Herrera, and R. M. Trigo, 2015: Iberian extreme precipitation 1855/1856: an analysis from early instrumental observations and documentary sources. International Journal of Climatology, 35, 142-153, doi:10.1002/joc.3973.
- Dong, B., and A. Dai, 2015: The influence of the Interdecadal Pacific Oscillation on Temperature and Precipitation over the Globe. Climate Dynamics, 45, 2667-2681, doi:10.1007/s00382-015-2500-x.
- Dong, B., and R. Sutton, 2015: Dominant role of greenhouse-gas forcing in the recovery of Sahel rainfall. Nature Climate Change, 5, 757-U173, doi:10.1038/NCLIMATE2664.
- Du, Y., Y. Zhang, M. Feng, T. Wang, N. Zhang, and S. Wijffels, 2015: Decadal trends of the upper ocean salinity in the tropical Indo-Pacific since mid-1990s. Scientific Reports, 5, doi:10.1038/srep16050.
- Duan, K., B. Xu, and G. Wu, 2015: Snow accumulation variability at altitude of 7010 m a.s.l. in Muztag Ata Mountain in Pamir Plateau during 1958-2002. Journal of Hydrology, 531, 912-918, doi:10.1016/j.jhydrol.2015.10.013.
- Elbert, J., M. Jacques-Coper, M. Van Daele, R. Urrutia, and M. Grosjean, 2015: A 600 years warm-season temperature record from varved sediments of Lago Plomo, Northern Patagonia, Chile (47 degrees S). Quaternary International, 377, 28-37, doi:10.1016/j.quaint.2015.01.004.
- Erler, A. R., W. R. Peltier, and M. D'Orgeville, 2015: Dynamically Downscaled High-Resolution Hydroclimate Projections for Western Canada. J. Clim., 28, 423-450, doi:10.1175/JCLI-D-14-00174.1.
- Fang, K., H. Seppa, and D. Chen, 2015: Interdecadal hydroclimate teleconnections between Asia and North America over the past 600 years. Climate Dynamics, 44, 1777-1787, doi:10.1007/s00382-014-2266-6.
- Feng, X., M. N. Tsimplis, M. Marcos, F. M. Calafat, J. Zheng, G. Jorda, and P. Cipollini, 2015: Spatial and temporal variations of the seasonal sea level cycle in the northwest Pacific. Journal of Geophysical Research-Oceans, 120, 7091-7112, doi:10.1002/2015JC011154.
- Ferranti, L., S. Corti, and M. Janousek, 2015: Flow-dependent verification of the ECMWF ensemble over the Euro-Atlantic sector. Quarterly Journal of the Royal Meteorological Society, 141, 916-924, doi:10.1002/qj.2411.
- Feser, F., M. Barcikowska, O. Krueger, F. Schenk, R. Weisse, and L. Xia, 2015: Storminess over the North Atlantic and northwestern Europe - A review. Quarterly Journal of the Royal Meteorological Society, 141, 350-382, doi:10.1002/qj.2364.
- Fleig, A. K., L. M. Tallaksen, P. James, H. Hisdal, and K. Stahl, 2015: Attribution of European precipitation and temperature trends to changes in synoptic circulation. Hydrology and Earth System Sciences, 19, 3093-3107, doi:10.5194/hess-19-3093-2015.
- Folland, C. K., and Coauthors, 2015: Multi-annual droughts in the English Lowlands: a review of their characteristics and climate drivers in the winter half-year. Hydrology and Earth System Sciences, 19, 2353-2375, doi:10.5194/hess-19-2353-2015.
- Freitas, A. C. V., J. S. Frederiksen, J. Whelan, T. J. O'Kane, and T. Ambrizzi, 2015: Observed and simulated inter-decadal changes in the structure of Southern Hemisphere large-scale circulation. Climate Dynamics, 45, 2993-3017, doi:10.1007/s00382-015-2519-z.
- Fruendt, B., J. W. Dippner, D. E. Schulz-Bull, and J. J. Waniek, 2015: Chlorophyll a reconstruction from in situ measurements: 2. Marked carbon uptake decrease in the last century. Journal of Geophysical Research-Biogeosciences, 120, 246-253, doi:10.1002/2014JG002692.
- Fujiwara, M., T. Hibino, S. K. Mehta, L. Gray, D. Mitchell, and J. Anstey, 2015: Global temperature response to the major volcanic eruptions in multiple reanalysis data sets. Atmospheric Chemistry and Physics, 15, 13507-13518, doi:10.5194/acp-15-13507-2015.
- Funk, C. C., and A. Hoell, 2015: The Leading Mode of Observed and CMIP5 ENSO-Residual Sea Surface Temperatures and Associated Changes in Indo-Pacific Climate. J. Clim., 28, 4309-4329, doi:10.1175/JCLI-D-14-00334.1.
- Gallego, D., P. Ordonez, P. Ribera, C. Pena-Ortiz, and R. Garcia-Herrera, 2015: An instrumental index of the West African Monsoon back to the nineteenth century. Quarterly Journal of the Royal Meteorological Society, 141, 3166-3176, doi:10.1002/qj.2601.
- Gan, B., and L. Wu, 2015: Feedbacks of Sea Surface Temperature to Wintertime Storm Tracks in the North Atlantic. J. Clim., 28, 306-323, doi:10.1175/JCLI-D-13-00719.1.
- Gastineau, G., and C. Frankignoul, 2015: Influence of the North Atlantic SST Variability on the Atmospheric Circulation during the Twentieth Century. J. Clim., 28, 1396-1416, doi:10.1175/JCLI-D-14-00424.1.
- Gonzalez-Reviriego, N., C. Rodriguez-Puebla, and B. Rodriguez-Fonseca, 2015: Evaluation of observed and simulated teleconnections over the Euro-Atlantic region on the basis of partial least squares regression. Climate Dynamics, 44, 2989-3014, doi:10.1007/s00382-014-2367-2.
- Gregow, H., and Coauthors, 2015: User awareness concerning feedback data and input observations used in reanalysis systems. Advances in Science and Research, 12, 63-67, doi:10.5194/asr-12-63-2015.
- Grigholm, B., and Coauthors, 2015: Twentieth century dust lows and the weakening of the westerly winds over the Tibetan Plateau. Geophysical Research Letters, 42, 2434-2441, doi:10.1002/2015GL063217.
- Grossman, M. J., M. Zaiki, and R. Nagata, 2015: Interannual and interdecadal variations in typhoon tracks around Japan. International Journal of Climatology, 35, 2514-2527, doi:10.1002/joc.4156.
- Groth, A., and M. Ghil, 2015: Monte Carlo Singular Spectrum Analysis (SSA) Revisited: Detecting Oscillator Clusters in Multivariate Datasets. J. Clim., 28, 7873-7893, doi:10.1175/JCLI-D-15-0100.1.
- Guan, X., J. Huang, R. Guo, and P. Lin, 2015: The role of dynamically induced variability in the recent warming trend slowdown over the Northern Hemisphere. Scientific Reports, 5, doi:10.1038/srep12669.
- Haarsma, R. J., F. M. Selten, and S. S. Drijfhout, 2015: Decelerating Atlantic meridional overturning circulation main cause of future west European summer atmospheric circulation changes. Environmental Research Letters, 10, doi:10.1088/1748-9326/10/9/094007.
- Haigh, I. D., and Coauthors, 2015: A user-friendly database of coastal flooding in the United Kingdom from 1915-2014. Scientific Data, 2, doi:10.1038/sdata.2015.21.
- Hall, R., R. Erdelyi, E. Hanna, J. M. Jones, and A. A. Scaife, 2015: Drivers of North Atlantic Polar Front jet stream variability. International Journal of Climatology, 35, 1697-1720, doi:10.1002/joc.4121.
- Han, B., S. Lu, Y. Gao, Y. Ao, and R. Li, 2015: Response of Atmospheric Energy to Historical Climate Change in CMIP5. Journal of Meteorological Research, 29, 93-105, doi:10.1007/s13351-014-4016-4.
- Han, B., C. Zhao, S. Lu, and X. Wang, 2015: A diagnostic analysis on the effect of the residual layer in convective boundary layer development near Mongolia using 20th century reanalysis data. Advances in Atmospheric Sciences, 32, 807-820, doi:10.1007/s00376-014-4164-6.
- Hanna, E., T. E. Cropper, P. D. Jones, A. A. Scaife, and R. Allan, 2015: Recent seasonal asymmetric changes in the NAO (a marked summer decline and increased winter variability) and associated changes in the AO and Greenland Blocking Index. International Journal of Climatology, 35, 2540-2554, doi:10.1002/joc.4157.
- Hartmann, D. L., 2015: Pacific sea surface temperature and the winter of 2014. Geophysical Research Letters, 42, 1894-1902, doi:10.1002/2015GL063083.
- Henley, B. J., J. Gergis, D. J. Karoly, S. Power, J. Kennedy, and C. K. Folland, 2015: A Tripole Index for the Interdecadal Pacific Oscillation. Climate Dynamics, 45, 3077-3090, doi:10.1007/s00382-015-2525-1.
- Hernandez, M., C. C. Ummenhofer, and K. J. Anchukaitis, 2015: Multi-scale drought and ocean-atmosphere variability in monsoon Asia. Environmental Research Letters, 10, doi:10.1088/1748-9326/10/7/074010.
- Hernandez-Almeida, I., M. Grosjean, W. Tylmann, and A. Bonk, 2015: Chrysophyte cyst-inferred variability of warm season lake water chemistry and climate in northern Poland: training set and downcore reconstruction. Journal of Paleolimnology, 53, 123-138, doi:10.1007/s10933-014-9812-4.
- Hersbach, H., C. Peubey, A. Simmons, P. Berrisford, P. Poli, and D. Dee, 2015: ERA-20CM: a twentieth-century atmospheric model ensemble. Quarterly Journal of the Royal Meteorological Society, 141, 2350-2375, doi:10.1002/qj.2528.
- Hertig, E., C. Beck, H. Wanner, and J. Jacobeit, 2015: A review of non-stationarities in climate variability of the last century with focus on the North Atlantic-European sector. Earth-Science Reviews, 147, 1-17, doi:10.1016/j.earscirev.2015.04.009.
- Higuera, P. E., J. T. Abatzoglou, J. S. Littell, and P. Morgan, 2015: The Changing Strength and Nature of Fire-Climate Relationships in the Northern Rocky Mountains, USA, 1902-2008. Plos One, 10, doi:10.1371/journal.pone.0127563.
- Hirano, J., and T. Mikami, 2015: Long-term changes in summer temperature anomaly patterns in Japan since the early 20th century. International Journal of Climatology, 35, 3676-3690, doi:10.1002/joc.4241.
- Hoell, A., C. Funk, and M. Barlow, 2015: The Forcing of Southwestern Asia Teleconnections by Low-Frequency Sea Surface Temperature Variability during Boreal Winter. J. Clim., 28, 1511-1526, doi:10.1175/JCLI-D-14-00344.1.
- Hope, P., and Coauthors, 2015: Seasonal and regional signature of the projected southern Australian rainfall reduction. Australian Meteorological and Oceanographic Journal, 65, 54-71, doi:10.22499/2.6501.005.
- Ingleby, B., 2015: Global assimilation of air temperature, humidity, wind and pressure from surface stations. Quarterly Journal of the Royal Meteorological Society, 141, 504-517, doi:10.1002/qj.2372.
- Ionita, M., 2015: Interannual summer streamflow variability over Romania and its connection to large-scale atmospheric circulation. International Journal of Climatology, 35, 4186-4196, doi:10.1002/joc.4278.
- Ionita, M., C. Boroneant, and S. Chelcea, 2015: Seasonal modes of dryness and wetness variability over Europe and their connections with large scale atmospheric circulation and global sea surface temperature. Climate Dynamics, 45, 2803-2829, doi:10.1007/s00382-015-2508-2.
- Ionita, M., M. Dima, G. Lohmann, P. Scholz, and N. Rimbu, 2015: Predicting the June 2013 European Flooding Based on Precipitation, Soil Moisture, and Sea Level Pressure. Journal of Hydrometeorology, 16, 598-614, doi:10.1175/JHM-D-14-0156.1.
- Ionita, M., P. Scholz, and S. Chelcea, 2015: Spatio-temporal variability of dryness/wetness in the Danube River Basin. Hydrological Processes, 29, 4483-4497, doi:10.1002/hyp.10514. Ishida, K., M. L. Kavvas, S. Ceyhan, N. Ohara, and Z. Q. Chen, 2015: Climate Change Analysis on Extreme Precipitation over Three Watersheds in Northern California Based on 137-Year Long-Term Dynamical Downscaling. World Environmental and Water Resources Congress 2015: Floods, Droughts, and Ecosystems, 983-988.
- Iversen, E. C., and H. Burningham, 2015: Relationship between NAO and wind climate over Norway. Climate Research, 63, 115-134, doi:10.3354/cr01277.
- Jacques-Coper, M., S. Broennimann, O. Martius, C. S. Vera, and S. B. Cerne, 2015: Evidence for a modulation of the intraseasonal summer temperature in Eastern Patagonia by the Madden-Julian Oscillation. Journal of Geophysical Research-Atmospheres, 120, 7340-7357, doi:10.1002/2014JD022924.
- Jones, P. D., and D. H. Lister, 2015: Antarctic near-surface air temperatures compared with ERA-Interim values since 1979. International Journal of Climatology, 35, 1354-1366, doi:10.1002/joc.4061.
- Kaiser-Weiss, A. K., and Coauthors, 2015: Comparison of regional and global reanalysis near-surface winds with station observations over Germany. Advances in Science and Research, 12, 187-198, doi:10.5194/asr-12-187-2015.
- Kaspar, F., B. Tinz, H. Maechel, and L. Gates, 2015: Data rescue of national and international meteorological observations at Deutscher Wetterdienst. Advances in Science and Research, 12, 57-61, doi:10.5194/asr-12-57-2015.
- Kauffeldt, A., S. Halldin, F. Pappenberger, F. Wetterhall, C.-Y. Xu, and H. L. Cloke, 2015: Imbalanced land surface water budgets in a numerical weather prediction system. Geophysical Research Letters, 42, 4411-4417, doi:10.1002/2015GL064230.
- Kelley, C. P., S. Mohtadi, M. A. Cane, R. Seager, and Y. Kushnir, 2015: Climate change in the Fertile Crescent and implications of the recent Syrian drought. Proceedings of the National Academy of Sciences of the United States of America, 112, 3241-3246, doi:10.1073/pnas.1421533112.
- Kendon, M., and M. McCarthy, 2015: The UK's wet and stormy winter of 2013/2014. Weather, 70, 40-47, doi:10.1002/wea.2465.
- King, A. D., M. G. Donat, L. V. Alexander, and D. J. Karoly, 2015: The ENSO-Australian rainfall teleconnection in reanalysis and CMIP5. Climate Dynamics, 44, 2623-2635, doi:10.1007/s00382-014-2159-8.
- King, J. A., G. R. Bigg, and R. Hall, 2015: Influence of synoptic atmospheric conditions on movement of individual sea-ice floes in Fram Strait, late summer 2010. Annals of Glaciology, 56, 445-450, doi:10.3189/2015AoG69A655.
- Kirchner-Bossi, N., R. Garcia-Herrera, L. Prieto, and R. M. Trigo, 2015: A long-term perspective of wind power output variability. International Journal of Climatology, 35, 2635-2646, doi:10.1002/joc.4161.
- Klesse, S., M. Ziehmer, G. Rousakis, V. Trouet, and D. Frank, 2015: Synoptic drivers of 400 years of summer temperature and precipitation variability on Mt. Olympus, Greece. Climate Dynamics, 45, 807-824, doi:10.1007/s00382-014-2313-3.
- Klotzbach, P. J., and E. C. J. Oliver, 2015: Variations in global tropical cyclone activity and the Madden-Julian Oscillation since the midtwentieth century. Geophysical Research Letters, 42, 4199-4207, doi:10.1002/2015GL063966.
- Klotzbach, P. J., and E. C. J. Oliver, 2015: Modulation of Atlantic Basin Tropical Cyclone Activity by the Madden-Julian Oscillation (MJO) from 1905 to 2011. J. Clim., 28, 204-217, doi:10.1175/JCLI-D-14-00509.1.
- Kobayashi, S., and Coauthors, 2015: The JRA-55 Reanalysis: General Specifications and Basic Characteristics. Journal of the Meteorological Society of Japan, 93, 5-48, doi:10.2151/jmsj.2015-001.
- Kolstad, E. W., S. P. Sobolowski, and A. A. Scaife, 2015: Intraseasonal Persistence of European Surface Temperatures. J. Clim., 28, 5365-5374, doi:10.1175/JCLI-D-15-0053.1.
- Kong, X.-H., and X.-Q. Bi, 2015: Dynamical Downscaling of the Twentieth Century Reanalysis for China: Climatic Means during 1981-2010. Atmospheric and Oceanic Science Letters, 8, 166-173, doi:10.3878/AOSL20140099.
- Krichak, S. O., J. Barkan, J. S. Breitgand, S. Gualdi, and S. B. Feldstein, 2015: The role of the export of tropical moisture into midlatitudes for extreme precipitation events in the Mediterranean region. Theoretical and Applied Climatology, 121, 499-515, doi:10.1007/s00704-014-1244-6.
- Kruk, M. C., A. M. Lorrey, G. M. Griffiths, M. Lander, E. J. Gibney, H. J. Diamond, and J. J. Marra, 2015: On the state of the knowledge of rainfall extremes in the western and northern Pacific basin. International Journal of Climatology, 35, 321-336, doi:10.1002/joc.3990.
- Kucharski, F., F. S. Syed, A. Burhan, I. Farah, and A. Gohar, 2015: Tropical Atlantic influence on Pacific variability and mean state in the twentieth century in observations and CMIP5. Climate Dynamics, 44, 881-896, doi:10.1007/s00382-014-2228-z.
- Kuentz, A., T. Mathevet, J. Gailhard, and B. Hingray, 2015: Building long-term and high spatio-temporal resolution precipitation and air temperature reanalyses by mixing local observations and global atmospheric reanalyses: the ANATEM model. Hydrology and Earth System Sciences, 19, 2717-2736, doi:10.5194/hess-19-2717-2015.
- Lai, A. W.-C., M. Herzog, and H.-F. Graf, 2015: Two key parameters for the El Nio continuum: zonal wind anomalies and Western Pacific subsurface potential temperature. Climate Dynamics, 45, 3461-3480, doi:10.1007/s00382-015-2550-0.
- Lavers, D. A., D. M. Hannah, and C. Bradley, 2015: Connecting large-scale atmospheric circulation, river flow and groundwater levels in a chalk catchment in southern England. Journal of Hydrology, 523, 179-189, doi:10.1016/j.jhydrol.2015.01.060.
- Lee, S.-K., W. Park, M. O. Baringer, A. L. Gordon, B. Huber, and Y. Liu, 2015: Pacific origin of the abrupt increase in Indian Ocean heat content during the warming hiatus. Nature Geoscience, 8, 445-U441, doi:10.1038/NGEO2438.
- Lewis, S. C., and A. N. LeGrande, 2015: Stability of ENSO and its tropical Pacific teleconnections over the Last Millennium. Climate of the Past, 11, 1347-1360, doi:10.5194/cp-11-1347-2015.
- Li, F., and Y.-Q. Gao, 2015: The Project Siberian High in CMIP5 Models. Atmospheric and Oceanic Science Letters, 8, 179-184, doi:10.3878/AOSL20140101.
- Li, X., and M. Ting, 2015: Recent and future changes in the Asian monsoon-ENSO relationship: Natural or forced? Geophysical Research Letters, 42, 3502-3512, doi:10.1002/2015GL063557.
- Li, X., M. Ting, C. Li, and N. Henderson, 2015: Mechanisms of Asian Summer Monsoon Changes in Response to Anthropogenic Forcing in CMIP5 Models. J. Clim., 28, 4107-4125, doi:10.1175/JCLI-D-14-00559.1.
- Li, Y., J. Li, W. Zhang, X. Zhao, F. Xie, and F. Zheng, 2015: Ocean dynamical processes associated with the tropical Pacific cold tongue mode. Journal of Geophysical Research-Oceans, 120, 6419-6435, doi:10.1002/2015JC010814.
- Liu, H., C. Wang, S.-K. Lee, and D. Enfield, 2015: Inhomogeneous influence of the Atlantic warm pool on United States precipitation. Atmospheric Science Letters, 16, 63-69, doi:10.1002/asl2.521.
- Liu, Y., S.-K. Lee, D. B. Enfield, B. A. Muhling, J. T. Lamkin, F. E. Muller-Karger, and M. A. Roffer, 2015: Potential impact of climate change on the Intra-Americas Sea: Part-1. A dynamic downscaling of the CMIP5 model projections. Journal of Marine Systems, 148, 56-69, doi:10.1016/j.jmarsys.2015.01.007.
- Liu, Z., Z. Jian, K. Yoshimura, N. H. Buenning, C. J. Poulsen, and G. J. Bowen, 2015: Recent contrasting winter temperature changes over North America linked to enhanced positive Pacific-North American pattern. Geophysical Research Letters, 42, 7750-7757, doi:10.1002/2015GL065656.
- Lluis Ruiz-Bellet, J., J. Caries Balasch, J. Tuset, M. Barriendos, J. Mazon, and D. Pino, 2015: Historical, hydraulic, hydrological and meteorological reconstruction of 1874 Santa Tecla flash floods in Catalonia (NE Iberian Peninsula). Journal of Hydrology, 524, 279-295, doi:10.1016/j.jhydrol.2015.02.023.
- Longman, R. J., H. F. Diaz, and T. W. Giambelluca, 2015: Sustained Increases in Lower-Tropospheric Subsidence over the Central Tropical North Pacific Drive a Decline in High-Elevation Rainfall in Hawaii. J. Clim., 28, 8743-8759, doi:10.1175/JCLI-D-15-0006.1.
- Lovejoy, S., 2015: A voyage through scales, a missing quadrillion and why the climate is not what you expect. Climate Dynamics, 44, 3187-3210, doi:10.1007/s00382-014-2324-0.
- Lovejoy, S., and M. I. P. de Lima, 2015: The joint space-time statistics of macroweather precipitation, space-time statistical factorization and macroweather models. Chaos, 25, doi:10.1063/1.4927223.
- Ma, X., P. Chang, R. Saravanan, D. Wu, X. Lin, L. Wu, and X. Wan, 2015: Winter Extreme Flux Events in the Kuroshio and Gulf Stream Extension Regions and Relationship with Modes of North Pacific and Atlantic Variability. J. Clim., 28, 4950-4970, doi:10.1175/JCLI-D-14-00642.1.
- Marcos, M., F. M. Calafat, A. Berihuete, and S. Dangendorf, 2015: Long-term variations in global sea level extremes. Journal of Geophysical Research-Oceans, 120, 8115-8134, doi:10.1002/2015JC011173. Marie, M., P. Christian, C. Jean-Pierre, and B. Francois, 2015: Extension of the SIM Reanalysis by Combination of Observations and Statistical Downscaling. Engineering Geology for Society and Territory, Vol 1: Climate Change and Engineering Geology, 189-192.
- Martin-Rey, M., B. Rodriguez-Fonseca, and I. Polo, 2015: Atlantic opportunities for ENSO prediction. Geophysical Research Letters, 42, 6802-6810, doi:10.1002/2015GL065062.
- Masson-Delmotte, V., and Coauthors, 2015: Recent changes in north-west Greenland climate documented by NEEM shallow ice core data and simulations, and implications for past-temperature reconstructions. Cryosphere, 9, 1481-1504, doi:10.5194/tc-9-1481-2015.
- Mauro Vargas-Hernandez, J., S. E. Wijffels, G. Meyers, A. B. do Couto, and N. J. Holbrook, 2015: Decadal Characterization of Indo-Pacific Ocean Subsurface Temperature Modes in SODA Reanalysis. J. Clim., 28, 6113-6132, doi:10.1175/JCLI-D-14-00700.1.
- McPhaden, M. J., A. Timmermann, M. J. Widlansky, M. A. Balmaseda, and T. N. Stockdale, 2015: A Perspective from 40 Years of Progress in Climate Research and Forecasting. Bulletin of the American Meteorological Society, 96, 1647-1665, doi:10.1175/BAMS-D-14-00089.1. Mercer, A., and A. Grimes, 2015: Diagnosing Tropical Cyclone Rapid Intensification Using Kernel Methods and Reanalysis Datasets. Complex Adaptive Systems, 2015, 422-427.
- Merz, N., C. C. Raible, and T. Woollings, 2015: North Atlantic Eddy-Driven Jet in Interglacial and Glacial Winter Climates. J. Clim., 28, 3977-3997, doi:10.1175/JCLI-D-14-00525.1.
- Mitchell, D. M., and Coauthors, 2015: Signatures of naturally induced variability in the atmosphere using multiple reanalysis datasets. Quarterly Journal of the Royal Meteorological Society, 141, 2011-2031, doi:10.1002/qj.2492.
- Monier, E., X. Gao, J. R. Scott, A. P. Sokolov, and C. A. Schlosser, 2015: A framework for modeling uncertainty in regional climate change. Climatic Change, 131, 51-66, doi:10.1007/s10584-014-1112-5.
- Mueller, W. A., and Coauthors, 2015: A twentieth-century reanalysis forced ocean model to reconstruct the North Atlantic climate variation during the 1920s. Climate Dynamics, 44, 1935-1955, doi:10.1007/s00382-014-2267-5.
- Muhling, B. A., Y. Liu, S.-K. Lee, J. T. Lamkin, M. A. Roffer, F. Muller-Karger, and J. F. Walter, III, 2015: Potential impact of climate change on the Intra-Americas Sea: Part 2. Implications for Atlantic bluefin tuna and skipjack tuna adult and larval habitats. Journal of Marine Systems, 148, 1-13, doi:10.1016/j.jmarsys.2015.01.010.
- Nguyen, H., C. Lucas, A. Evans, B. Timbal, and L. Hanson, 2015: Expansion of the Southern Hemisphere Hadley Cell in Response to Greenhouse Gas Forcing. J. Clim., 28, 8067-8077, doi:10.1175/JCLI-D-15-0139.1.
- Nicholson, S. E., 2015: Long-term variability of the East African "short rains' and its links to large-scale factors. International Journal of Climatology, 35, 3979-3990, doi:10.1002/joc.4259.
- Oliver, E. C. J., 2015: Multidecadal variations in the modulation of Alaska wintertime air temperature by the Madden-Julian Oscillation. Theoretical and Applied Climatology, 121, 1-11, doi:10.1007/s00704-014-1215-y.
- Oliver, H., R. L. Rognstad, and D. S. Wethey, 2015: Using meteorological reanalysis data for multi-decadal hindcasts of larval connectivity in the coastal ocean. Marine Ecology Progress Series, 530, 47-62, doi:10.3354/meps11300.
- Ortega, P., F. Lehner, D. Swingedouw, V. Masson-Delmotte, C. C. Raible, M. Casado, and P. Yiou, 2015: A model-tested North Atlantic Oscillation reconstruction for the past millennium. Nature, 523, 71-+, doi:10.1038/nature14518.
- Ott, I., K. Romberg, and J. Jacobeit, 2015: Teleconnections of the tropical Atlantic and Pacific Oceans in a CMIP5 model ensemble. Climate Dynamics, 44, 3043-3055, doi:10.1007/s00382-014-2394-z.
- Overland, J., J. A. Francis, R. Hall, E. Hanna, S.-J. Kim, and T. Vihma, 2015: The Melting Arctic and Midlatitude Weather Patterns: Are They Connected? J. Clim., 28, 7917-7932, doi:10.1175/JCLI-D-14-00822.1.
- Paltsev, S., E. Monier, J. Scott, A. Sokolov, and J. Reilly, 2015: Integrated economic and climate projections for impact assessment. Climatic Change, 131, 21-33, doi:10.1007/s10584-013-0892-3.
- Pena, J. C., L. Schulte, A. Badoux, M. Barriendos, and A. Barrera-Escoda, 2015: Influence of solar forcing, climate variability and modes of low-frequency atmospheric variability on summer floods in Switzerland. Hydrology and Earth System Sciences, 19, 3807-3827, doi:10.5194/hess-19-3807-2015.
- Penny, S. G., D. W. Behringer, J. A. Carton, and E. Kalnay, 2015: A Hybrid Global Ocean Data Assimilation System at NCEP. Monthly Weather Review, 143, 4660-4677, doi:10.1175/MWR-D-14-00376.1.
- Perlwitz, J., M. Hoerling, and R. Dole, 2015: Arctic Tropospheric Warming: Causes and Linkages to Lower Latitudes. J. Clim., 28, 2154-2167, doi:10.1175/JCLI-D-14-00095.1.
- Peterson, I. K., R. Pettipas, and A. Rosing-Asvid, 2015: Trends and Variability in Sea Ice and Icebergs off the Canadian East Coast. Atmosphere-Ocean, 53, 582-594, doi:10.1080/07055900.2015.1057684.
- Piecuch, C. G., and R. M. Ponte, 2015: Inverted barometer contributions to recent sea level changes along the northeast coast of North America. Geophysical Research Letters, 42, 5918-5925, doi:10.1002/2015GL064580.
- Polzin, D., L. G. Guirola, and S. Hastenrath, 2015: Climatic variations in Central America: further exploration. International Journal of Climatology, 35, 2122-2130, doi:10.1002/joc.4111.
- Pralungo, L. R., and L. Haimberger, 2015: New estimates of tropical mean temperature trend profiles from zonal mean historical radiosonde and pilot balloon wind shear observations. Journal of Geophysical Research-Atmospheres, 120, 3700-3713, doi:10.1002/2014JD022664.
- Praveen, V., S. Sandeep, and R. S. Ajayamohan, 2015: On the Relationship between Mean Monsoon Precipitation and Low Pressure Systems in Climate Model Simulations. J. Clim., 28, 5305-5324, doi:10.1175/JCLI-D-14-00415.1.
- Qian, W., K. Wu, and D. Chen, 2015: The Arctic and Polar cells act on the Arctic sea ice variation. Tellus Series a-Dynamic Meteorology and Oceanography, 67, 1-18, doi:10.3402/tellusa.v67.27692.
- Rao, J., R. Ren, and Y. Yang, 2015: Parallel comparison of the northern winter stratospheric circulation in reanalysis and in CMIP5 models. Advances in Atmospheric Sciences, 32, 952-966, doi:10.1007/s00376-014-4192-2.
- Rapaic, M., R. Brown, M. Markovic, and D. Chaumont, 2015: An Evaluation of Temperature and Precipitation Surface-Based and Reanalysis Datasets for the Canadian Arctic, 1950-2010. Atmosphere-Ocean, 53, 283-303, doi:10.1080/07055900.2015.1045825.
- Ray, S., D. Swingedouw, J. Mignot, and E. Guilyardi, 2015: Effect of surface restoring on subsurface variability in a climate model during 1949-2005. Climate Dynamics, 44, 2333-2349, doi:10.1007/s00382-014-2358-3.
- Reboita, M. S., R. P. da Rocha, T. Ambrizzi, and C. D. Gouveia, 2015: Trend and teleconnection patterns in the climatology of extratropical cyclones over the Southern Hemisphere. Climate Dynamics, 45, 1929-1944, doi:10.1007/s00382-014-2447-3.
- Rhodes, R. I., L. C. Shaffrey, and S. L. Gray, 2015: Can reanalyses represent extreme precipitation over England and Wales? Quarterly Journal of the Royal Meteorological Society, 141, 1114-1120, doi:10.1002/qj.2418.
- Richter, J. H., C. Deser, and L. Sun, 2015: Effects of stratospheric variability on El Nino teleconnections. Environmental Research Letters, 10, doi:10.1088/1748-9326/10/12/124021.
- Risbey, J. S., T. J. O'Kane, D. P. Monselesan, C. Franzke, and I. Horenko, 2015: Metastability of Northern Hemisphere Teleconnection Modes. J Atmos Sci, 72, 35-54, doi:10.1175/JAS-D-14-0020.1.
- Rotstayn, L. D., M. A. Collier, and J. J. Luo, 2015: Effects of declining aerosols on projections of zonally averaged tropical precipitation. Environmental Research Letters, 10, doi:10.1088/1748-9326/10/4/044018. Rutgersson, A., and Coauthors, 2015: Recent Change-Atmosphere. Second Assessment of Climate Change for the Baltic Sea Basin, 69-97.
- Saffioti, C., E. M. Fischer, and R. Knutti, 2015: Contributions of atmospheric circulation variability and data coverage bias to the warming hiatus. Geophysical Research Letters, 42, 2385-2391, doi:10.1002/2015GL063091.
- Saha, M., P. Mitra, and A. Chakraborty, 2015: Fuzzy Clustering-Based Ensemble Approach to Predicting Indian Monsoon. Advances in Meteorology, doi:10.1155/2015/329835.
- Saher, M. H., W. R. Gehrels, N. L. M. Barlow, A. J. Long, I. D. Haigh, and M. Blaauw, 2015: Sea-level changes in Iceland and the influence of the North Atlantic Oscillation during the last half millennium. Quaternary Science Reviews, 108, 23-36, doi:10.1016/j.quascirev.2014.11.005.
- Santos, M., J. A. Santos, and M. Fragoso, 2015: Historical damaging flood records for 1871-2011 in Northern Portugal and underlying atmospheric forcings. Journal of Hydrology, 530, 591-603, doi:10.1016/j.jhydrol.2015.10.011.
- Sardeshmukh, P. D., G. P. Compo, and C. Penland, 2015: Need for Caution in Interpreting Extreme Weather Statistics. J. Clim., 28, 9166-9187, doi:10.1175/JCLI-D-15-0020.1.
- Schultz, J. A., C. Beck, G. Menz, B. Neuwirth, C. Ohlwein, and A. Philipp, 2015: Sensitivity of proxies on non-linear interactions in the climate system. Scientific Reports, 5, doi:10.1038/srep18560.
- Seitola, T., J. Silen, and H. Jarvinen, 2015: Randomised multichannel singular spectrum analysis of the 20th century climate data. Tellus Series a-Dynamic Meteorology and Oceanography, 67, doi:10.3402/tellusa.v67.28876.
- Selman, C., and V. Misra, 2015: Simulating diurnal variations over the southeastern United States. Journal of Geophysical Research-Atmospheres, 120, 180-198, doi:10.1002/2014JD021812.
- Serpa, D., and Coauthors, 2015: Impacts of climate and land use changes on the hydrological and erosion processes of two contrasting Mediterranean catchments. Science of the Total Environment, 538, 64-77, doi:10.1016/j.scitotenv.2015.08.033.
- Singh, P., V. Vasudevan, J. S. Chowdary, and C. Gnanaseelan, 2015: Subseasonal variations of Indian summer monsoon with special emphasis on drought and excess rainfall years. International Journal of Climatology, 35, 570-582, doi:10.1002/joc.4004.
- Sippel, S., J. Zscheischler, M. Heimann, F. E. L. Otto, J. Peters, and M. D. Mahecha, 2015: Quantifying changes in climate variability and extremes: Pitfalls and their overcoming. Geophysical Research Letters, 42, 9990-9998, doi:10.1002/2015GL066307.
- Smith, J. A., and M. L. Baeck, 2015: "Prophetic vision, vivid imagination": The 1927 Mississippi River flood. Water Resources Research, 51, 9964-9994, doi:10.1002/2015WR017927.
- Smith, T. M., and P. A. Arkin, 2015: Improved Historical Analysis of Oceanic Total Precipitable Water. J. Clim., 28, 3099-3121, doi:10.1175/JCLI-D-14-00601.1.
- Smoliak, B. V., and J. M. Wallace, 2015: On the Leading Patterns of Northern Hemisphere Sea Level Pressure Variability*. J Atmos Sci, 72, 3469-3486, doi:10.1175/JAS-D-14-0371.1.
- Smoliak, B. V., J. M. Wallace, P. Lin, and Q. Fu, 2015: Dynamical Adjustment of the Northern Hemisphere Surface Air Temperature Field: Methodology and Application to Observations. J. Clim., 28, 1613-1629, doi:10.1175/JCLI-D-14-00111.1.
- Song, F., and T. Zhou, 2015: The Crucial Role of Internal Variability in Modulating the Decadal Variation of the East Asian Summer Monsoon-ENSO Relationship during the Twentieth Century. J. Clim., 28, 7093-7107, doi:10.1175/JCLI-D-14-00783.1.
- Song, L.-Y., and W.-S. Duan, 2015: Interannual Relationship between the Winter Aleutian Low and Rainfall in the Following Summer in South China. Atmospheric and Oceanic Science Letters, 8, 271-276, doi:10.3878/AOSL20150021.
- Sprenger, M., and H. Wernli, 2015: The LAGRANTO Lagrangian analysis tool - version 2.0. Geoscientific Model Development, 8, 2569-2586, doi:10.5194/gmd-8-2569-2015.
- Steiner, N., and Coauthors, 2015: Observed trends and climate projections affecting marine ecosystems in the Canadian Arctic. Environmental Reviews, 23, 191-239, doi:10.1139/er-2014-0066.
- Sterl, A., A. M. R. Bakker, H. W. van den Brink, R. Haarsma, A. Stepek, I. L. Wijnant, and R. C. de Winter, 2015: Large-scale winds in the southern North Sea region: the wind part of the KNMI' 14 climate change scenarios. Environmental Research Letters, 10, doi:10.1088/1748-9326/10/3/035004.
- Stickler, A., and Coauthors, 2015: Upper-air observations from the German Atlantic Expedition (1925-27) and comparison with the Twentieth Century and ERA-20C reanalyses. Meteorologische Zeitschrift, 24, 525-544, doi:10.1127/metz/2015/0683.
- Stucki, P., and Coauthors, 2015: Dynamical Downscaling and Loss Modeling for the Reconstruction of Historical Weather Extremes and Their Impacts: A Severe Foehn Storm in 1925. Bulletin of the American Meteorological Society, 96, doi:10.1175/BAMS-D-14-00041.1.
- Sun, C., J. Li, J. Feng, and F. Xie, 2015: A Decadal-Scale Teleconnection between the North Atlantic Oscillation and Subtropical Eastern Australian Rainfall. J. Clim., 28, 1074-1092, doi:10.1175/JCLI-D-14-00372.1.
- Sun, C., J. Li, and S. Zhao, 2015: Remote influence of Atlantic multidecadal variability on Siberian warm season precipitation. Scientific Reports, 5, doi:10.1038/srep16853.
- Surkova, G. V., L. A. Sokolova, A. R. Chichev, Л. А. Соколова, and А. Р. Чичев, 2015: Long-term regime of extreme winds in the Barents and Kara seas. Vestnik Moskovskogo universiteta. Seriya 5: Geografiya, 53-58, doi:Swart, N. C., J. C. Fyfe, N. Gillett, and G. J. Marshall, 2015: Comparing Trends in the Southern Annular Mode and Surface Westerly Jet. J. Clim., 28, 8840-8859, doi:10.1175/JCLI-D-15-0334.1.
- Therrell, M. D., and M. B. Bialecki, 2015: A multi-century tree-ring record of spring flooding on the Mississippi River. Journal of Hydrology, 529, 490-498, doi:10.1016/j.jhydrol.2014.11.005.
- Thomas, E. R., J. S. Hosking, R. R. Tuckwell, R. A. Warren, and E. C. Ludlow, 2015: Twentieth century increase in snowfall in coastal West Antarctica. Geophysical Research Letters, 42, 9387-9393, doi:10.1002/2015GL065750.
- Thompson, D. M., J. E. Cole, G. T. Shen, A. W. Tudhope, and G. A. Meehl, 2015: Early twentieth-century warming linked to tropical Pacific wind strength. Nature Geoscience, 8, 117-121, doi:10.1038/NGEO2321.
- Tian, B., and K. Fan, 2015: A Skillful Prediction Model for Winter NAO Based on Atlantic Sea Surface Temperature and Eurasian Snow Cover. Weather Forecast, 30, 197-205, doi:10.1175/WAF-D-14-00100.1.
- Tian, D., S. Asseng, C. J. Martinez, V. Misra, D. Cammarano, and B. V. Ortiz, 2015: Does decadal climate variation influence wheat and maize production in the southeast USA? Agricultural and Forest Meteorology, 204, 1-9, doi:10.1016/j.agrformet.2015.01.013.
- Turney, C. S. M., C. J. Fogwill, A. R. Klekociuk, T. D. van Ommen, M. A. J. Curran, A. D. Moy, and J. G. Palmer, 2015: Tropical and mid-latitude forcing of continental Antarctic temperatures. Cryosphere, 9, 2405-2415, doi:10.5194/tc-9-2405-2015.
- Uotila, P., T. Vihma, and J. Haapala, 2015: Atmospheric and oceanic conditions and the extremely low Bothnian Bay sea ice extent in 2014/2015. Geophysical Research Letters, 42, 7740-7749, doi:10.1002/2015GL064901.
- Vance, T. R., J. L. Roberts, C. T. Plummer, A. S. Kiem, and T. D. van Ommen, 2015: Interdecadal Pacific variability and eastern Australian megadroughts over the last millennium. Geophysical Research Letters, 42, 129-137, doi:10.1002/2014GL062447.
- Vijayakumar, D. B. I. P., F. Raulier, P. Y. Bernier, S. Gauthier, Y. Bergeron, and D. Pothier, 2015: Lengthening the historical records of fire history over large areas of boreal forest in eastern Canada using empirical relationships. Forest Ecology and Management, 347, 30-39, doi:10.1016/j.foreco.2015.03.011.
- Villamayor, J., and E. Mohino, 2015: Robust Sahel drought due to the Interdecadal Pacific Oscillation in CMIP5 simulations. Geophysical Research Letters, 42, 1214-1222, doi:10.1002/2014GL062473.
- Wadey, M. P., and Coauthors, 2015: A comparison of the 31 January-1 February 1953 and 5-6 December 2013 coastal flood events around the UK. Frontiers in Marine Science, 2, doi:10.3389/fmars.2015.00084.
- Wahl, T., S. Jain, J. Bender, S. D. Meyers, and M. E. Luther, 2015: Increasing risk of compound flooding from storm surge and rainfall for major US cities. Nature Climate Change, 5, 1093-+, doi:10.1038/NCLIMATE2736.
- Wahl, T., and N. G. Plant, 2015: Changes in erosion and flooding risk due to long-term and cyclic oceanographic trends. Geophysical Research Letters, 42, 2943-2950, doi:10.1002/2015GL063876.
- Walker, J. M., S. Bordoni, and T. Schneider, 2015: Interannual Variability in the Large-Scale Dynamics of the South Asian Summer Monsoon. J. Clim., 28, 3731-3750, doi:10.1175/JCLI-D-14-00612.1.
- Wang, B., B. Xiang, J. Li, P. J. Webster, M. N. Rajeevan, J. Liu, and K.-J. Ha, 2015: Rethinking Indian monsoon rainfall prediction in the context of recent global warming. Nature Communications, 6, doi:10.1038/ncomms8154.
- Wang, C., 2015: Anthropogenic aerosols and the distribution of past large-scale precipitation change. Geophysical Research Letters, 42, 10876-10884, doi:10.1002/2015GL066416.
- Wang, X., C. Wang, L. Zhang, and X. Wang, 2015: Multidecadal Variability of Tropical Cyclone Rapid Intensification in the Western North Pacific. J. Clim., 28, 3806-3820, doi:10.1175/JCLI-D-14-00400.1.
- Wapler, K., and P. James, 2015: Thunderstorm occurrence and characteristics in Central Europe under different synoptic conditions. Atmospheric Research, 158, 231-244, doi:10.1016/j.atmosres.2014.07.011.
- Way, R. G., and P. P. Bonnaventure, 2015: Testing a reanalysis-based infilling method for areas with sparse discontinuous air temperature data in northeastern Canada. Atmospheric Science Letters, 16, 398-407, doi:10.1002/asl2.574.
- Wee, T. K., and Y. H. Kuo, 2015: A perspective on the fundamental quality of GPS radio occultation data. Atmos Meas Tech, 8, 4281-4294, doi:10.5194/amt-8-4281-2015.
- Welker, C., and O. Martius, 2015: Large-scale atmospheric flow conditions and sea surface temperatures associated with hazardous winds in Switzerland. Climate Dynamics, 44, 1857-1869, doi:10.1007/s00382-014-2404-1.
- Wilton, D. J., G. R. Bigg, and E. Hanna, 2015: Modelling twentieth century global ocean circulation and iceberg flux at 48 degrees N: implications for west Greenland iceberg discharge. Prog Oceanogr, 138, 194-210, doi:10.1016/j.pocean.2015.07.003.
- Winter, A., and Coauthors, 2015: Persistent drying in the tropics linked to natural forcing. Nature Communications, 6, doi:10.1038/ncomms8627.
- Wise, E. K., 2015: Short Communication Tropical Pacific and Northern Hemisphere influences on the coherence of Pacific Decadal Oscillation reconstructions. International Journal of Climatology, 35, 154-160, doi:10.1002/joc.3966.
- Wise, E. K., M. L. Wrzesien, M. P. Dannenberg, and D. L. McGinnis, 2015: Cool-Season Precipitation Patterns Associated with Teleconnection Interactions in the United States. Journal of Applied Meteorology and Climatology, 54, 494-505, doi:10.1175/JAMC-D-14-0040.1.
- Woollings, T., C. Franzke, D. L. R. Hodson, B. Dong, E. A. Barnes, C. C. Raible, and J. G. Pinto, 2015: Contrasting interannual and multidecadal NAO variability. Climate Dynamics, 45, 539-556, doi:10.1007/s00382-014-2237-y.
- Wright, W. E., B. T. Guan, Y. H. Tseng, E. R. Cook, K. Y. Wei, and S. T. Chang, 2015: Reconstruction of the springtime East Asian Subtropical Jet and Western Pacific pattern from a millennial-length Taiwanese tree-ring chronology. Climate Dynamics, 44, 1645-1659, doi:10.1007/s00382-014-2402-3.
- Wu, L., and C. Wang, 2015: Has the Western Pacific Subtropical High Extended Westward since the Late 1970s? J. Clim., 28, 5406-5413, doi:10.1175/JCLI-D-14-00618.1.
- Xing, L., and Coauthors, 2015: TEX86 paleothermometer as an indication of bottom water temperature in the Yellow Sea. Organic Geochemistry, 86, 19-31, doi:10.1016/j.orggeochem.2015.05.007.
- Yan, L., and G. Li, 2015: Change in the Relationship between the Southern Subtropical Dipole Modes and the Southern Annular Mode in the Mid-1980s. J. Clim., 28, 9235-9249, doi:10.1175/JCLI-D-15-0134.1.
- Yang, J., Z.-H. Wang, and K. E. Kaloush, 2015: Environmental impacts of reflective materials: Is high albedo a 'silver bullet' for mitigating urban heat island? Renewable & Sustainable Energy Reviews, 47, 830-843, doi:10.1016/j.rser.2015.03.092.
- Yang, Y., S.-P. Xie, Y. Du, and H. Tokinaga, 2015: Interdecadal Difference of Interannual Variability Characteristics of South China Sea SSTs Associated with ENSO. J. Clim., 28, 7145-7160, doi:10.1175/JCLI-D-15-0057.1.
- Yi, D. L., L. Zhang, and L. Wu, 2015: On the mechanisms of decadal variability of the North Pacific Gyre Oscillation over the 20th century. Journal of Geophysical Research-Oceans, 120, 6114-6129, doi:10.1002/2014JC010660.
- Yokoi, S., 2015: Multireanalysis Comparison of Variability in Column Water Vapor and Its Analysis Increment Associated with the Madden-Julian Oscillation. J. Clim., 28, 793-808, doi:10.1175/JCLI-D-14-00465.1.
- Yoon, J.-H., S. Y. S. Wang, R. R. Gillies, B. Kravitz, L. Hipps, and P. J. Rasch, 2015: Increasing water cycle extremes in California and in relation to ENSO cycle under global warming. Nature Communications, 6, doi:10.1038/ncomms9657.
- Yoshimura, K., 2015: Stable Water Isotopes in Climatology, Meteorology, and Hydrology: A Review. Journal of the Meteorological Society of Japan, 93, 513-533, doi:10.2151/jmsj.2015-036.
- You, Q., J. Min, W. Zhang, N. Pepin, and S. Kang, 2015: Comparison of multiple datasets with gridded precipitation observations over the Tibetan Plateau. Climate Dynamics, 45, 791-806, doi:10.1007/s00382-014-2310-6.
- Yu, J.-Y., P.-K. Kao, H. Paek, H.-H. Hsu, C.-W. Hung, M.-M. Lu, and S.-I. An, 2015: Linking Emergence of the Central Pacific El Nino to the Atlantic Multidecadal Oscillation. J. Clim., 28, 651-662, doi:10.1175/JCLI-D-14-00347.1.
- Yun, K.-S., S.-W. Yeh, and K.-J. Ha, 2015: Covariability of western tropical Pacific-North Pacific atmospheric circulation during summer. Scientific Reports, 5, doi:10.1038/srep16980.
- Zampieri, M., E. Scoccimarro, S. Gualdi, and A. Navarra, 2015: Observed shift towards earlier spring discharge in the main Alpine rivers. Science of the Total Environment, 503, 222-232, doi:10.1016/j.scitotenv.2014.06.036.
- Zanchettin, D., O. Bothe, F. Lehner, P. Ortega, C. C. Raible, and D. Swingedouw, 2015: Reconciling reconstructed and simulated features of the winter Pacific/North American pattern in the early 19th century. Climate of the Past, 11, 939-958, doi:10.5194/cp-11-939-2015.
- Zaninelli, P. G., A. F. Carril, and C. G. Menéndez, 2015: Explorando temperaturas máximas y mínimas en diferentes reanálisis: Parte 1: campos medios estacionales. Meteorologica, 40, 43-58, doi:Zhang, L., and T. L. Delworth, 2015: Analysis of the Characteristics and Mechanisms of the Pacific Decadal Oscillation in a Suite of Coupled Models from the Geophysical Fluid Dynamics Laboratory. J. Clim., 28, 7678-7701, doi:10.1175/JCLI-D-14-00647.1.
- Zhang, Q., K. Holmgren, and H. Sundqvist, 2015: Decadal Rainfall Dipole Oscillation over Southern Africa Modulated by Variation of Austral Summer Land-Sea Contrast along the East Coast of Africa. J Atmos Sci, 72, 1827-1836, doi:10.1175/JAS-D-14-0079.1.
- Zhang, X., L. Jin, and N. Li, 2015: Asynchronous variation in the East Asian winter monsoon during the Holocene. Journal of Geophysical Research-Atmospheres, 120, 5357-5370, doi:10.1002/2014JD022585.
- Zhao, T., J. Wang, and A. Dai, 2015: Evaluation of atmospheric precipitable water from reanalysis products using homogenized radiosonde observations over China. Journal of Geophysical Research-Atmospheres, 120, 10703-10727, doi:10.1002/2015JD023906.
- 2014: The Global Climate System and Causes of Climate Change. Osterreichischer Sachstandsbericht Klimawandel 2014, Bd 1-3, 137-171.
- Abatzoglou, J. T., D. E. Rupp, and P. W. Mote, 2014: Questionable evidence of natural warming of the northwestern United States. Proceedings of the National Academy of Sciences of the United States of America, 111, E5605-E5606, doi:10.1073/pnas.1421311112.
- Abatzoglou, J. T., D. E. Rupp, and P. W. Mote, 2014: Seasonal Climate Variability and Change in the Pacific Northwest of the United States. J. Clim., 27, 2125-2142, doi:10.1175/JCLI-D-13-00218.1.
- Adam, O., T. Schneider, and N. Harnik, 2014: Role of Changes in Mean Temperatures versus Temperature Gradients in the Recent Widening of the Hadley Circulation. J. Clim., 27, 7450-7461, doi:10.1175/JCLI-D-14-00140.1.
- Adolphi, F., and Coauthors, 2014: Persistent link between solar activity and Greenland climate during the Last Glacial Maximum. Nature Geoscience, 7, 662-666, doi:10.1038/NGEO2225.
- Alexander, M. A., K. H. Kilbourne, and J. A. Nye, 2014: Climate variability during warm and cold phases of the Atlantic Multidecadal Oscillation (AMO) 1871-2008. Journal of Marine Systems, 133, 14-26, doi:10.1016/j.jmarsys.2013.07.017.
- Allen, R. J., J. R. Norris, and M. Kovilakam, 2014: Influence of anthropogenic aerosols and the Pacific Decadal Oscillation on tropical belt width. Nature Geoscience, 7, 270-274, doi:10.1038/ngeo2091.
- Amaya, D. J., and G. R. Foltz, 2014: Impacts of canonical and Modoki El Nino on tropical Atlantic SST. Journal of Geophysical Research-Oceans, 119, 777-789, doi:10.1002/2013JC009476.
- Andrews, J. T., G. R. Bigg, and D. J. Wilton, 2014: Holocene ice-rafting and sediment transport from the glaciated margin of East Greenland (67-70 degrees N) to the N Iceland shelves: detecting and modelling changing sediment sources. Quaternary Science Reviews, 91, 204-217, doi:10.1016/j.quascirev.2013.08.019.
- Arizmendi, F., A. C. Marti, and M. Barreiro, 2014: Evolution of atmospheric connectivity in the 20th century. Nonlinear Proc Geoph, 21, 825-839, doi:10.5194/npg-21-825-2014.
- Ashcroft, L., J. Gergis, and D. J. Karoly, 2014: A historical climate dataset for southeastern Australia, 1788-1859. Geoscience Data Journal, 1, 158-178, doi:10.1002/gdj3.19.
- Ashcroft, L., D. J. Karoly, and J. Gergis, 2014: Southeastern Australian climate variability 1860-2009: a multivariate analysis. International Journal of Climatology, 34, 1928-1944, doi:10.1002/joc.3812.
- Barbu, N., V. Cuculeanu, and S. Stefan, 2014: Modeling the Precipitation Amounts Dynamics for Different Time Scales in Romania Using Multiple Regression Approach. Romanian Journal of Physics, 59, 1127-1149, doi:Barreiro, M., N. Diaz, and M. Renom, 2014: Role of the global oceans and land-atmosphere interaction on summertime interdecadal variability over northern Argentina. Climate Dynamics, 42, 1733-1753, doi:10.1007/s00382-014-2088-6.
- Barriopedro, D., D. Gallego, M. Carmen Alvarez-Castro, R. Garcia-Herrera, D. Wheeler, C. Pena-Ortiz, and S. M. Barbosa, 2014: Witnessing North Atlantic westerlies variability from ships' logbooks (1685-2008). Climate Dynamics, 43, 939-955, doi:10.1007/s00382-013-1957-8. Basu, S., C. G. Nunalee, P. He, S. T. Fiorino, and M. A. Vorontsov, 2014: Reconstructing the Prevailing Meteorological and Optical Environment during the Time of the Titanic Disaster. Laser Communication and Propagation through the Atmosphere and Oceans Iii.
- Begueria, S., S. M. Vicente-Serrano, F. Reig, and B. Latorre, 2014: Standardized precipitation evapotranspiration index (SPEI) revisited: parameter fitting, evapotranspiration models, tools, datasets and drought monitoring. International Journal of Climatology, 34, 3001-3023, doi:10.1002/joc.3887.
- Beitsch, A., J. H. Jungclaus, and D. Zanchettin, 2014: Patterns of decadal-scale Arctic warming events in simulated climate. Climate Dynamics, 43, 1773-1789, doi:10.1007/s00382-013-2004-5.
- Bichet, A., D. Folini, M. Wild, and C. Schaer, 2014: Enhanced Central European summer precipitation in the late 19th century: a link to the Tropics. Quarterly Journal of the Royal Meteorological Society, 140, 111-123, doi:10.1002/qj.2111.
- Bigg, G. R., H. L. Wei, D. J. Wilton, Y. Zhao, S. A. Billings, E. Hanna, and V. Kadirkamanathan, 2014: A century of variation in the dependence of Greenland iceberg calving on ice sheet surface mass balance and regional climate change. Proceedings of the Royal Society a-Mathematical Physical and Engineering Sciences, 470, doi:10.1098/rspa.2013.0662.
- Bigg, G. R., and D. J. Wilton, 2014: Iceberg risk in the Titanic year of 1912: was it exceptional? Weather, 69, 100-104, doi:10.1002/wea.2238. Bindoff, N. L., and Coauthors, 2014: Detection and Attribution of Climate Change: from Global to Regional. Climate Change 2013: The Physical Science Basis, 867-952.
- Blunden, J., and Coauthors, 2014: State of the Climate in 2013. Bulletin of the American Meteorological Society, 95, S1-S257, doi:10.1175/2014BAMSStateoftheClimate.1.
- Boe, J., and F. Habets, 2014: Multi-decadal river flow variations in France. Hydrology and Earth System Sciences, 18, 691-708, doi:10.5194/hess-18-691-2014.
- Bojinski, S., M. Verstraete, T. C. Peterson, C. Richter, A. Simmons, and M. Zemp, 2014: The Concept of Essential Climate Variables in Support of Climate Research, Applications, and Policy. Bulletin of the American Meteorological Society, 95, 1431-1443, doi:10.1175/BAMS-D-13-00047.1.
- Borchi, F., and Y. M. Tourre, 2014: Influences of atmospheric and oceanic low-frequency climate fluctuations on European winter surface air temperatures (1870-2010). Climate Research, 59, 117-124, doi:10.3354/cr01209.
- Breilh, J.-F., X. Bertin, E. Chaumillon, N. Giloy, and T. Sauzeau, 2014: How frequent is storm-induced flooding in the central part of the Bay of Biscay? Global and Planetary Change, 122, 161-175, doi:10.1016/j.gloplacha.2014.08.013.
- Breitenmoser, P., S. Broennimann, and D. Frank, 2014: Forward modelling of tree-ring width and comparison with a global network of tree-ring chronologies. Climate of the Past, 10, 437-449, doi:10.5194/cp-10-437-2014.
- Breivik, O., O. J. Aarnes, S. Abdalla, J.-R. Bidlot, and P. A. E. M. Janssen, 2014: Wind and wave extremes over the world oceans from very large ensembles. Geophysical Research Letters, 41, 5122-5131, doi:10.1002/2014GL060997.
- Calafat, F. M., D. P. Chambers, and M. N. Tsimplis, 2014: On the ability of global sea level reconstructions to determine trends and variability. Journal of Geophysical Research-Oceans, 119, 1572-1592, doi:10.1002/2013JC009298.
- Camus, P., and Coauthors, 2014: A weather-type statistical downscaling framework for ocean wave climate. Journal of Geophysical Research-Oceans, 119, 7389-7405, doi:10.1002/2014JC010141.
- Capa-Morocho, M., B. Rodriguez-Fonseca, and M. Ruiz-Ramos, 2014: Crop yield as a bioclimatic index of El Nino impact in Europe: Crop forecast implications. Agricultural and Forest Meteorology, 198, 42-52, doi:10.1016/j.agrformet.2014.07.012.
- Chappell, P. R., and A. M. Lorrey, 2014: Identifying New Zealand, Southeast Australia, and Southwest Pacific historical weather data sources using Ian Nicholson's Log of Logs. Geoscience Data Journal, 1, 49-60, doi:10.1002/gdj3.1.
- Chen, S., K. Wei, W. Chen, and L. Song, 2014: Regional changes in the annual mean Hadley circulation in recent decades. Journal of Geophysical Research-Atmospheres, 119, doi:10.1002/2014JD021540.
- Chen, W., R. Lu, and B. Dong, 2014: Intensified anticyclonic anomaly over the western North Pacific during El Nino decaying summer under a weakened Atlantic thermohaline circulation. Journal of Geophysical Research-Atmospheres, 119, 13637-13650, doi:10.1002/2014JD022199.
- Chepurin, G. A., J. A. Carton, and E. Leuliette, 2014: Sea level in ocean reanalyses and tide gauges. Journal of Geophysical Research-Oceans, 119, 147-155, doi:10.1002/2013JC009365.
- Chowdary, J. S., N. John, and C. Gnanaseelan, 2014: Interannual variability of surface air-temperature over India: impact of ENSO and Indian Ocean Sea surface temperature. International Journal of Climatology, 34, 416-429, doi:10.1002/joc.3695.
- Ciancarelli, B., C. L. Castro, C. Woodhouse, F. Dominguez, H.-I. Chang, C. Carrillo, and D. Griffin, 2014: Dominant patterns of US warm season precipitation variability in a fine resolution observational record, with focus on the southwest. International Journal of Climatology, 34, 687-707, doi:10.1002/joc.3716.
- Comas-Bru, L., and F. McDermott, 2014: Impacts of the EA and SCA patterns on the European twentieth century NAO-winter climate relationship. Quarterly Journal of the Royal Meteorological Society, 140, 354-363, doi:10.1002/qj.2158.
- Cook, B. I., R. Seager, and J. E. Smerdon, 2014: The worst North American drought year of the last millennium: 1934. Geophysical Research Letters, 41, 7298-7305, doi:10.1002/2014GL061661.
- Cornes, R. C., 2014: Historic storms of the northeast Atlantic since circa 1700: a brief review of recent research. Weather, 69, 121-125, doi:10.1002/wea.2289.
- Cowtan, K., and R. G. Way, 2014: Coverage bias in the HadCRUT4 temperature series and its impact on recent temperature trends. Quarterly Journal of the Royal Meteorological Society, 140, 1935-1944, doi:10.1002/qj.2297.
- Cropper, T. E., and E. Hanna, 2014: An analysis of the climate of Macaronesia, 1865-2012. International Journal of Climatology, 34, 604-622, doi:10.1002/joc.3710.
- Cropper, T. E., E. Hanna, and G. R. Bigg, 2014: Spatial and temporal seasonal trends in coastal upwelling off Northwest Africa, 1981-2012. Deep-Sea Research Part I-Oceanographic Research Papers, 86, 94-111, doi:10.1016/j.dsr.2014.01.007.
- Dangendorf, S., F. M. Calafat, A. Arns, T. Wahl, I. D. Haigh, and J. Jensen, 2014: Mean sea level variability in the North Sea: Processes and implications. Journal of Geophysical Research-Oceans, 119, 6820-6841, doi:10.1002/2014JC009901.
- Dangendorf, S., S. Mueller-Navarra, J. Jensen, F. Schenk, T. Wahl, and R. Weisse, 2014: North Sea Storminess from a Novel Storm Surge Record since AD 1843. J. Clim., 27, 3582-3595, doi:10.1175/JCLI-D-13-00427.1.
- Dangendorf, S., D. Rybski, C. Mudersbach, A. Mueller, E. Kaufmann, E. Zorita, and J. Jensen, 2014: Evidence for long-term memory in sea level. Geophysical Research Letters, 41, 5530-5537, doi:10.1002/2014GL060538.
- Dangendorf, S., T. Wahl, E. Nilson, B. Klein, and J. Jensen, 2014: A new atmospheric proxy for sea level variability in the southeastern North Sea: observations and future ensemble projections. Climate Dynamics, 43, 447-467, doi:10.1007/s00382-013-1932-4.
- Davy, R., and I. Esau, 2014: Surface air temperature variability in global climate models. Atmospheric Science Letters, 15, 13-20, doi:10.1002/asl2.456.
- de Boer, G., and Coauthors, 2014: Near-surface meteorology during the Arctic Summer Cloud Ocean Study (ASCOS): evaluation of reanalyses and global climate models. Atmospheric Chemistry and Physics, 14, 427-445, doi:10.5194/acp-14-427-2014.
- de Boisseson, E., M. A. Balmaseda, S. Abdalla, E. Kaellen, and P. A. E. M. Janssen, 2014: How robust is the recent strengthening of the Tropical Pacific trade winds? Geophysical Research Letters, 41, 4398-4405, doi:10.1002/2014GL060257.
- Dee, D. P., M. Balmaseda, G. Balsam, R. Engelen, A. J. Simmons, and J. N. Thepaut, 2014: Toward a Consistent Reanalysis of the Climate System. Bulletin of the American Meteorological Society, 95, 1235-1248, doi:10.1175/BAMS-D-13-00043.1.
- Deser, C., A. S. Phillips, M. A. Alexander, and B. V. Smoliak, 2014: Projecting North American Climate over the Next 50 Years: Uncertainty due to Internal Variability*. J. Clim., 27, 2271-2296, doi:10.1175/JCLI-D-13-00451.1.
- Dole, R., and Coauthors, 2014: The Making of an Extreme Event. Bulletin of the American Meteorological Society, 95, 427-440, doi:10.1175/BAMS-D-12-00069.1.
- Dotto, T. S., R. Kerr, M. M. Mata, M. Azaneu, I. Wainer, E. Fahrbach, and G. Rohardt, 2014: Assessment of the structure and variability of Weddell Sea water masses in distinct ocean reanalysis products. Ocean Science, 10, 523-546, doi:10.5194/os-10-523-2014.
- Dowdy, A. J., 2014: Long-term changes in Australian tropical cyclone numbers. Atmospheric Science Letters, 15, 292-298, doi:10.1002/asl2.502.
- Drenkard, E. J., and K. B. Karnauskas, 2014: Strengthening of the Pacific Equatorial Undercurrent in the SODA Reanalysis: Mechanisms, Ocean Dynamics, and Implications. J. Clim., 27, 2405-2416, doi:10.1175/JCLI-D-13-00359.1.
- Drobyshev, I., M. Niklasson, M. J. Mazerolle, and Y. Bergeron, 2014: Reconstruction of a 253-year long mast record of European beech reveals its association with large scale temperature variability and no long-term trend in mast frequencies. Agricultural and Forest Meteorology, 192, 9-17, doi:10.1016/j.agrformet.2014.02.010.
- England, M. H., and Coauthors, 2014: Recent intensification of wind-driven circulation in the Pacific and the ongoing warming hiatus. Nature Climate Change, 4, 222-227, doi:10.1038/NCLIMATE2106.
- Fang, K., D. Chen, J. Li, and H. Seppa, 2014: Covarying Hydroclimate Patterns between Monsoonal Asia and North America over the Past 600 Years. J. Clim., 27, 8017-8033, doi:10.1175/JCLI-D-13-00364.1.
- Feng, X., and P. Houser, 2014: An examination of potential seasonal predictability in recent reanalyses. Atmospheric Science Letters, 15, 266-274, doi:10.1002/asl2.498.
- Feng, X.-L., H. Zhi, P.-F. Lin, and H.-L. Liu, 2014: Assessment of Historical Climate Trends of Surface Air Temperature in CMIPS Models. Atmospheric and Oceanic Science Letters, 7, 137-142, doi:10.3878/j.issn.1674-2834.13.0081.
- Ferguson, C. R., and G. Villarini, 2014: An evaluation of the statistical homogeneity of the Twentieth Century Reanalysis. Climate Dynamics, 42, 2841-2866, doi:10.1007/s00382-013-1996-1.
- Filippi, L., E. Palazzi, J. von Hardenberg, and A. Provenzale, 2014: Multidecadal Variations in the Relationship between the NAO and Winter Precipitation in the Hindu Kush-Karakoram. J. Clim., 27, 7890-7902, doi:10.1175/JCLI-D-14-00286.1.
- Francois, B., and Coauthors, 2014: Integrating hydropower and intermittent climate-related renewable energies: a call for hydrology. Hydrological Processes, 28, 5465-5468, doi:10.1002/hyp.10274.
- Fussell, E., L. M. Hunter, and C. L. Gray, 2014: Measuring the environmental dimensions of human migration: The demographer's toolkit. Global Environmental Change-Human and Policy Dimensions, 28, 182-191, doi:10.1016/j.gloenvcha.2014.07.001.
- Gan, B., and L. Wu, 2014: Centennial trends in Northern Hemisphere winter storm tracks over the twentieth century. Quarterly Journal of the Royal Meteorological Society, 140, 1945-1957, doi:10.1002/qj.2263.
- Gehne, M., R. Kleeman, and K. E. Trenberth, 2014: Irregularity and decadal variation in ENSO: a simplified model based on Principal Oscillation Patterns. Climate Dynamics, 43, 3327-3350, doi:10.1007/s00382-014-2108-6.
- Goes, M., I. Wainer, and N. Signorelli, 2014: Investigation of the causes of historical changes in the subsurface salinity minimum of the South Atlantic. Journal of Geophysical Research-Oceans, 119, 5654-5675, doi:10.1002/2014JC009812.
- Gordon, A. L., and C. F. Giulivi, 2014: Ocean eddy freshwater flux convergence into the North Atlantic subtropics. Journal of Geophysical Research-Oceans, 119, 3327-3335, doi:10.1002/2013JC009596.
- Grainger, S., C. S. Frederiksen, and X. Zheng, 2014: Assessment of Modes of Interannual Variability of Southern Hemisphere Atmospheric Circulation in CMIP5 Models. J. Clim., 27, 8107-8125, doi:10.1175/JCLI-D-14-00251.1.
- Grooms, I., Y. Lee, and A. J. Majda, 2014: Ensemble Kalman filters for dynamical systems with unresolved turbulence. Journal of Computational Physics, 273, 435-452, doi:10.1016/j.jcp.2014.05.037.
- Grumm, R., J. M. Arnott, and J. Halblaub, 2014: The Epic Eastern North American Warm Episode of March 2012. J Oper Meteorol, 2, 36-50, doi:10.15191/nwajom.2014.0204.
- Han, J.-P., G. Liu, and Y.-F. Xin, 2014: A Dipole Pattern of Summer Precipitation over Mid-high Latitude Asia and Related Snow Cover Anomalies in the Preceding Spring. Atmospheric and Oceanic Science Letters, 7, 364-368, doi:10.3878/j.issn.1674-2834.14.0012. Hartmann, D. L., and Coauthors, 2014: Observations: Atmosphere and Surface. Climate Change 2013: The Physical Science Basis, 159-254.
- Hartten, L. M., and P. E. Johnston, 2014: Stratocumulus-Topped Marine Boundary Layer Processes Revealed by the Absence of Profiler Reflectivity. Journal of Applied Meteorology and Climatology, 53, 1775-1789, doi:10.1175/JAMC-D-12-0308.1.
- Hastenrath, S., and D. Polzin, 2014: Variability of circulation and Sahel rainfall in the twentieth century. International Journal of Climatology, 34, 1693-1698, doi:10.1002/joc.3740. Hewitson, B., and Coauthors, 2014: Regional Context. Climate Change 2014: Impacts, Adaptation, and Vulnerability, Pt B: Regional Aspects: Working Group Ii Contribution to the Fifth Assessment Report of the Intergovernmental Panel on Climate Change, 1133-1197.
- Hong, L., L. Zhang, Z. Chen, and L. Wu, 2014: Linkage between the Pacific Decadal Oscillation and the low frequency variability of the Pacific Subtropical Cell. Journal of Geophysical Research-Oceans, 119, 3464-3477, doi:10.1002/2013JC009650.
- Hwang, S., W. D. Graham, J. S. Geurink, and A. Adams, 2014: Hydrologic implications of errors in bias-corrected regional reanalysis data for west central Florida. Journal of Hydrology, 510, 513-529, doi:10.1016/j.jhydrol.2013.11.042.
- Ionita, M., S. Chelcea, N. Rimbu, and M.-J. Adler, 2014: Spatial and temporal variability of winter streamflow over Romania and its relationship to large-scale atmospheric circulation. Journal of Hydrology, 519, 1339-1349, doi:10.1016/j.jhydrol.2014.09.024.
- Ionita, M., T. Felis, G. Lohmann, N. Rimbu, and J. Paetzold, 2014: Distinct modes of East Asian Winter Monsoon documented by a southern Red Sea coral record. Journal of Geophysical Research-Oceans, 119, 1517-1533, doi:10.1002/2013JC009203.
- Izumo, T., M. Lengaigne, J. Vialard, J.-J. Luo, T. Yamagata, and G. Madec, 2014: Influence of Indian Ocean Dipole and Pacific recharge on following year's El Nino: interdecadal robustness. Climate Dynamics, 42, 291-310, doi:10.1007/s00382-012-1628-1.
- Jacques-Coper, M., and S. Broennimann, 2014: Summer temperature in the eastern part of southern South America: its variability in the twentieth century and a teleconnection with Oceania. Climate Dynamics, 43, 2111-2130, doi:10.1007/s00382-013-2038-8.
- Jensen, J., S. Dangendorf, T. Wahl, and H. Steffen, 2014: Sea level changes in the North Sea region: recent developments and future challenges with focus on the German Bight. Hydrologie Und Wasserbewirtschaftung, 58, 304-323, doi:10.5675/HyWa_2014,6_1.
- Johnstone, J. A., and N. J. Mantua, 2014: Atmospheric controls on northeast Pacific temperature variability and change, 1900-2012. Proceedings of the National Academy of Sciences of the United States of America, 111, 14360-14365, doi:10.1073/pnas.1318371111.
- Jones, P. D., T. J. Osborn, C. Harpham, and K. R. Briffa, 2014: The development of Lamb weather types: from subjective analysis of weather charts to objective approaches using reanalyses. Weather, 69, 128-132, doi:10.1002/wea.2255.
- Jorda, G., 2014: Detection time for global and regional sea level trends and accelerations. Journal of Geophysical Research-Oceans, 119, 7164-7174, doi:10.1002/2014JC010005.
- Kayano, M. T., and V. B. Capistrano, 2014: How the Atlantic multidecadal oscillation (AMO) modifies the ENSO influence on the South American rainfall. International Journal of Climatology, 34, 162-178, doi:10.1002/joc.3674.
- Kent, E. C., D. I. Berry, J. Prytherch, and J. B. Roberts, 2014: A comparison of global marine surface-specific humidity datasets from in situ observations and atmospheric reanalysis. International Journal of Climatology, 34, 355-376, doi:10.1002/joc.3691.
- Kim, D., M.-I. Lee, D. Kim, S. D. Schubert, D. E. Waliser, and B. Tian, 2014: Representation of tropical subseasonal variability of precipitation in global reanalyses. Climate Dynamics, 43, 517-534, doi:10.1007/s00382-013-1890-x.
- Kim, W., and W. Cai, 2014: The importance of the eastward zonal current for generating extreme El Nio. Climate Dynamics, 42, 3005-3014, doi:10.1007/s00382-013-1792-y.
- King, A. D., N. P. Klingaman, L. V. Alexander, M. G. Donat, N. C. Jourdain, and P. Maher, 2014: Extreme Rainfall Variability in Australia: Patterns, Drivers, and Predictability. J. Clim., 27, 6035-6050, doi:10.1175/JCLI-D-13-00715.1.
- Kobayashi, C., and Coauthors, 2014: Preliminary Results of the JRA-55C, an Atmospheric Reanalysis Assimilating Conventional Observations Only. Sola, 10, 78-82, doi:10.2151/sola.2014-016.
- Konecky, B., J. Russell, M. Vuille, and K. Rehfeld, 2014: The Indian Ocean Zonal Mode over the past millennium in observed and modeled precipitation isotopes. Quaternary Science Reviews, 103, 1-18, doi:10.1016/j.quascirev.2014.08.019.
- Kravtsov, S., M. G. Wyatt, J. A. Curry, and A. A. Tsonis, 2014: Two contrasting views of multidecadal climate variability in the twentieth century. Geophysical Research Letters, 41, 6881-6888, doi:10.1002/2014GL061416.
- Krishnamurthy, L., and V. Krishnamurthy, 2014: Influence of PDO on South Asian summer monsoon and monsoon-ENSO relation. Climate Dynamics, 42, 2397-2410, doi:10.1007/s00382-013-1856-z.
- Krueger, O., F. Feser, L. Barring, E. Kaas, T. Schmith, H. Tuomenvirta, and H. von Storch, 2014: Comment on "Trends and low frequency variability of extra-tropical cyclone activity in the ensemble of twentieth century reanalysis" by Xiaolan L. Wang, Y. Feng, G. P. Compo, V. R. Swail, F. W. Zwiers, R. J. Allan, and P. D. Sardeshmukh, Climate Dynamics, 2012. Climate Dynamics, 42, 1127-1128, doi:10.1007/s00382-013-1814-9.
- Kruschke, T., H. W. Rust, C. Kadow, G. C. Leckebusch, and U. Ulbrich, 2014: Evaluating decadal predictions of northern hemispheric cyclone frequencies. Tellus Series a-Dynamic Meteorology and Oceanography, 66, doi:10.3402/tellusa.v66.22830.
- Kuwano-Yoshida, A., 2014: Using the Local Deepening Rate to Indicate Extratropical Cyclone Activity. Sola, 10, 199-203, doi:10.2151/sola.2014-042.
- Lahoz, W. A., and P. Schneider, 2014: Data assimilation: making sense of Earth Observation. Frontiers in Environmental Science, 2, doi:10.3389/fenvs.2014.00016.
- Langford, S., S. Stevenson, and D. Noone, 2014: Analysis of Low-Frequency Precipitation Variability in CMIP5 Historical Simulations for Southwestern North America. J. Clim., 27, 2735-2756, doi:10.1175/JCLI-D-13-00317.1. Lavers, D. A., D. M. Hannah, and C. Bradley, 2014: Linking variations in large-scale climatic circulation and high groundwater levels in southern England. Hydrology in a Changing World: Environmental and Human Dimensions, 102-106.
- Lee, D. E., and M. Biasutti, 2014: Climatology and Variability of Precipitation in the Twentieth-Century Reanalysis. J. Clim., 27, 5964-5981, doi:10.1175/JCLI-D-13-00630.1.
- Lee, J.-Y., and B. Wang, 2014: Future change of global monsoon in the CMIP5. Climate Dynamics, 42, 101-119, doi:10.1007/s00382-012-1564-0.
- Lee, S.-K., P. N. DiNezio, E.-S. Chung, S.-W. Yeh, A. T. Wittenberg, and C. Wang, 2014: Spring persistence, transition, and resurgence of El Nino. Geophysical Research Letters, 41, 8578-8585, doi:10.1002/2014GL062484.
- Lei, L., and J. L. Anderson, 2014: Impacts of Frequent Assimilation of Surface Pressure Observations on Atmospheric Analyses. Monthly Weather Review, 142, 4477-4483, doi:10.1175/MWR-D-14-00097.1.
- Liberato, M. L. R., 2014: The 19 January 2013 windstorm over the North Atlantic: large-scale dynamics and impacts on Iberia. Weather and Climate Extremes, 5-6, 16-28, doi:10.1016/j.wace.2014.06.002.
- Lindsay, R., M. Wensnahan, A. Schweiger, and J. Zhang, 2014: Evaluation of Seven Different Atmospheric Reanalysis Products in the Arctic*. J. Clim., 27, 2588-2606, doi:10.1175/JCLI-D-13-00014.1.
- Liu, Y., L. Wang, W. Zhou, and W. Chen, 2014: Three Eurasian teleconnection patterns: spatial structures, temporal variability, and associated winter climate anomalies. Climate Dynamics, 42, 2817-2839, doi:10.1007/s00382-014-2163-z.
- Liu, Z., K. Yoshimura, G. J. Bowen, N. H. Buenning, C. Risi, J. M. Welker, and F. Yuan, 2014: Paired oxygen isotope records reveal modern North American atmospheric dynamics during the Holocene. Nature Communications, 5, doi:10.1038/ncomms4701.
- Lucas, C., B. Timbal, and H. Nguyen, 2014: The expanding tropics: a critical assessment of the observational and modeling studies. Wiley Interdisciplinary Reviews-Climate Change, 5, 89-112, doi:10.1002/wcc.251.
- Luebbecke, J. F., N. J. Burls, C. J. C. Reason, and M. J. McPhaden, 2014: Variability in the South Atlantic Anticyclone and the Atlantic Nino Mode. J. Clim., 27, 8135-8150, doi:10.1175/JCLI-D-14-00202.1.
- Lyon, B., A. G. Barnston, and D. G. DeWitt, 2014: Tropical pacific forcing of a 1998-1999 climate shift: observational analysis and climate model results for the boreal spring season. Climate Dynamics, 43, 893-909, doi:10.1007/s00382-013-1891-9.
- MacLeod, D. A., and A. P. Morse, 2014: Visualizing the uncertainty in the relationship between seasonal average climate and malaria risk. Scientific Reports, 4, doi:10.1038/srep07264(2014).
- Madaus, L. E., G. J. Hakim, and C. F. Mass, 2014: Utility of Dense Pressure Observations for Improving Mesoscale Analyses and Forecasts. Monthly Weather Review, 142, 2398-2413, doi:10.1175/MWR-D-13-00269.1.
- Manzanas, R., L. K. Amekudzi, K. Preko, S. Herrera, and J. M. Gutierrez, 2014: Precipitation variability and trends in Ghana: An intercomparison of observational and reanalysis products. Climatic Change, 124, 805-819, doi:10.1007/s10584-014-1100-9.
- Mariani, I., A. Eichler, T. M. Jenk, S. Broennimann, R. Auchmann, M. C. Leuenberger, and M. Schwikowski, 2014: Temperature and precipitation signal in two Alpine ice cores over the period 1961-2001. Climate of the Past, 10, 1093-1108, doi:10.5194/cp-10-1093-2014.
- Martin-Rey, M., B. Rodriguez-Fonseca, I. Polo, and F. Kucharski, 2014: On the Atlantic-Pacific Ninos connection: a multidecadal modulated mode. Climate Dynamics, 43, 3163-3178, doi:10.1007/s00382-014-2305-3.
- Massa, C., M. Doyle, and R. Callico Fortunato, 2014: On how Cattle Egret (Bubulcus ibis) spread to the Americas: meteorological tools to assess probable colonization trajectories. International Journal of Biometeorology, 58, 1879-1891, doi:10.1007/s00484-014-0790-z.
- Matthews, T., C. Murphy, R. L. Wilby, and S. Harrigan, 2014: Stormiest winter on record for Ireland and UK. Nature Climate Change, 4, 738-740, doi:10.1038/nclimate2336.
- Mauro Vargas-Hernandez, J., S. Wijffels, G. Meyers, and N. J. Holbrook, 2014: Evaluating SODA for Indo-Pacific Ocean decadal climate variability studies. Journal of Geophysical Research-Oceans, 119, 7854-7868, doi:10.1002/2014JC010175.
- McAfee, S. A., 2014: Consistency and the Lack Thereof in Pacific Decadal Oscillation Impacts on North American Winter Climate. J. Clim., 27, 7410-7431, doi:10.1175/JCLI-D-14-00143.1.
- McGregor, S., A. Timmermann, M. F. Stuecker, M. H. England, M. Merrifield, F.-F. Jin, and Y. Chikamoto, 2014: Recent Walker circulation strengthening and Pacific cooling amplified by Atlantic warming. Nature Climate Change, 4, 888-892, doi:10.1038/NCLIMATE2330.
- Mortin, J., R. G. Graversen, and G. Svensson, 2014: Evaluation of pan-Arctic melt-freeze onset in CMIP5 climate models and reanalyses using surface observations. Climate Dynamics, 42, 2239-2257, doi:10.1007/s00382-013-1811-z.
- Mueller, W. A., H. Pohlmann, F. Sienz, and D. Smith, 2014: Decadal climate predictions for the period 1901-2010 with a coupled climate model. Geophysical Research Letters, 41, 2100-2107, doi:10.1002/2014GL059259.
- Muthers, S., and Coauthors, 2014: The coupled atmosphere-chemistry-ocean model SOCOL-MPIOM. Geoscientific Model Development, 7, 2157-2179, doi:10.5194/gmd-7-2157-2014.
- Nag, B., V. Misra, and S. Bastola, 2014: Validating ENSO Teleconnections on Southeastern US Winter Hydrology. Earth Interactions, 18, doi:10.1175/EI-D-14-0007.1.
- Neff, W., G. P. Compo, F. M. Ralph, and M. D. Shupe, 2014: Continental heat anomalies and the extreme melting of the Greenland ice surface in 2012 and 1889. Journal of Geophysical Research-Atmospheres, 119, 6520-6536, doi:10.1002/2014JD021470.
- Nicholson, S. E., 2014: Spatial teleconnections in African rainfall: A comparison of 19th and 20th century patterns. Holocene, 24, 1840-1848, doi:10.1177/0959683614551230.
- Nordli, O., R. Przybylak, A. E. J. Ogilvie, and K. Isaksen, 2014: Long-term temperature trends and variability on Spitsbergen: the extended Svalbard Airport temperature series, 1898-2012. Polar Research, 33, doi:10.3402/polar.v33.21349.
- Omstedt, A., J. Elken, A. Lehmann, M. Lepparanta, H. E. M. Meier, K. Myrberg, and A. Rutgersson, 2014: Progress in physical oceanography of the Baltic Sea during the 2003-2014 period. Prog Oceanogr, 128, 139-171, doi:10.1016/j.pocean.2014.08.010.
- Ortega, P., and Coauthors, 2014: Characterizing atmospheric circulation signals in Greenland ice cores: insights from a weather regime approach. Climate Dynamics, 43, 2585-2605, doi:10.1007/s00382-014-2074-z.
- Osterberg, E. C., P. A. Mayewski, D. A. Fisher, K. J. Kreutz, K. A. Maasch, S. B. Sneed, and E. Kelsey, 2014: Mount Logan ice core record of tropical and solar influences on Aleutian Low variability: 500-1998 AD. Journal of Geophysical Research-Atmospheres, 119, 11189-11204, doi:10.1002/2014JD021847.
- Pang, H., S. Hou, S. Kaspari, and P. A. Mayewski, 2014: Influence of regional precipitation patterns on stable isotopes in ice cores from the central Himalayas. Cryosphere, 8, 289-301, doi:10.5194/tc-8-289-2014.
- Paris, F., S. Lecacheux, D. Idier, and E. Charles, 2014: Assessing wave climate trends in the Bay of Biscay through an intercomparison of wave hindcasts and reanalyses. Ocean Dynamics, 64, 1247-1267, doi:10.1007/s10236-014-0746-1.
- Partasenok, I. S., P. Y. Groisman, G. S. Chekan, and V. I. Melnik, 2014: Winter cyclone frequency and following freshet streamflow formation on the rivers in Belarus. Environmental Research Letters, 9, doi:10.1088/1748-9326/9/9/095005.
- Peings, Y., and G. Magnusdottir, 2014: Forcing of the wintertime atmospheric circulation by the multidecadal fluctuations of the North Atlantic ocean. Environmental Research Letters, 9, doi:10.1088/1748-9326/9/3/034018.
- Pena Rabadan, J. C., and L. Schulte, 2014: Effects of solar activity and climate variability on large floods in Switzerland. Boletin De La Asociacion De Geografos Espanoles, 249-270, doi:10.21138/bage.1752.
- Perez, J., M. Menendez, F. J. Mendez, and I. J. Losada, 2014: Evaluating the performance of CMIP3 and CMIP5 global climate models over the north-east Atlantic region. Climate Dynamics, 43, 2663-2680, doi:10.1007/s00382-014-2078-8.
- Polzin, D., and S. Hastenrath, 2014: Climate of Brazil's nordeste and tropical atlantic sector: preferred time scales of variability tempo das variabilidades preferenciais. Revista Brasileira de Meteorologia, 29, 153-160, doi:10.1590/S0102-77862014000200001.
- Porter, S. E., and E. Mosley-Thompson, 2014: Exploring seasonal accumulation bias in a west central Greenland ice core with observed and reanalyzed data. Journal of Glaciology, 60, 1065-1074, doi:10.3189/2014JoG13J233.
- Porter, T. J., and Coauthors, 2014: Spring-summer temperatures since AD 1780 reconstructed from stable oxygen isotope ratios in white spruce tree-rings from the Mackenzie Delta, northwestern Canada. Climate Dynamics, 42, 771-785, doi:10.1007/s00382-013-1674-3.
- Pralungo, L. R., and L. Haimberger, 2014: A "Global Radiosonde and tracked-balloon Archive on Sixteen Pressure levels" (GRASP) going back to 1905-Part 2: homogeneity adjustments for pilot balloon and radiosonde wind data. Earth System Science Data, 6, 297-316, doi:10.5194/essd-6-297-2014.
- Pralungo, L. R., L. Haimberger, A. Stickler, and S. Broennimann, 2014: A global radiosonde and tracked balloon archive on 16 pressure levels (GRASP) back to 1905-Part 1: Merging and interpolation to 00:00 and 12:00GMT. Earth System Science Data, 6, 185-200, doi:10.5194/essd-6-185-2014.
- Qian, C., and T. Zhou, 2014: Multidecadal Variability of North China Aridity and Its Relationship to PDO during 1900-2010. J. Clim., 27, 1210-1222, doi:10.1175/JCLI-D-13-00235.1.
- Raible, C. C., F. Lehner, J. F. Gonzalez-Rouco, and L. Fernandez-Donado, 2014: Changing correlation structures of the Northern Hemisphere atmospheric circulation from 1000 to 2100 AD. Climate of the Past, 10, 537-550, doi:10.5194/cp-10-537-2014.
- Ratnam, M. V., Y. D. Santhi, P. Kishore, and S. V. B. Rao, 2014: Solar cycle effects on Indian summer monsoon dynamics. Journal of Atmospheric and Solar-Terrestrial Physics, 121, 145-156, doi:10.1016/j.jastp.2014.06.012. Redmond, K. T., and J. T. Abatzoglou, 2014: Current Climate and Recent Trends. Climate Change in North America, 53-94.
- Rennie, J. J., and Coauthors, 2014: The international surface temperature initiative global land surface databank: monthly temperature data release description and methods. Geoscience Data Journal, 1, 75-102, doi:10.1002/gdj3.8. Rhein, M., and Coauthors, 2014: Observations: Ocean. Climate Change 2013: The Physical Science Basis, 255-315.
- Rimbu, N., G. Lohmann, and M. Ionita, 2014: Interannual to multidecadal Euro-Atlantic blocking variability during winter and its relationship with extreme low temperatures in Europe. Journal of Geophysical Research-Atmospheres, 119, 13621-13636, doi:10.1002/2014JD021983.
- Roberts, J. F., and Coauthors, 2014: The XWS open access catalogue of extreme European windstorms from 1979 to 2012. Natural Hazards and Earth System Sciences, 14, 2487-2501, doi:10.5194/nhess-14-2487-2014.
- Robertson, F. R., and Coauthors, 2014: Consistency of Estimated Global Water Cycle Variations over the Satellite Era. J. Clim., 27, 6135-6154, doi:10.1175/JCLI-D-13-00384.1.
- Robson, J., R. Sutton, and D. Smith, 2014: Decadal predictions of the cooling and freshening of the North Atlantic in the 1960s and the role of ocean circulation. Climate Dynamics, 42, 2353-2365, doi:10.1007/s00382-014-2115-7.
- Ruiz Alvarez, V., A. Sanchez-Lorenzo, and R. Garcia Marin, 2014: Creation of a database with long series of precipitation in the Region of Murcia (Southeast Spain) and temporal analysis of the annual average series, 1914-2013. Revista De Climatologia, 14, 81-97, doi:Rutgersson, A., J. Jaagus, F. Schenk, and M. Stendel, 2014: Observed changes and variability of atmospheric parameters in the Baltic Sea region during the last 200 years. Climate Research, 61, 177-190, doi:10.3354/cr01244.
- Saarnak, E., H. Bergstrom, and S. Soderberg, 2014: Uncertainties Connected to Long-term Correction of Wind Observations. Wind Engineering, 38, 233-248, doi:10.1260/0309-524X.38.3.233.
- Sachindra, D. A., F. Huang, A. Barton, and B. J. C. Perera, 2014: Statistical downscaling of general circulation model outputs to catchment scale hydroclimatic variables: issues, challenges and possible solutions. Journal of Water and Climate Change, 5, 496-525, doi:10.2166/wcc.2014.056.
- Salvatteci, R., and Coauthors, 2014: The response of the Peruvian Upwelling Ecosystem to centennial-scale global change during the last two millennia. Climate of the Past, 10, 715-731, doi:10.5194/cp-10-715-2014.
- Sandeep, S., F. Stordal, P. D. Sardeshmukh, and G. P. Compo, 2014: Pacific Walker Circulation variability in coupled and uncoupled climate models. Climate Dynamics, 43, 103-117, doi:10.1007/s00382-014-2135-3.
- Schimanke, S., C. Dieterich, and H. E. M. Meier, 2014: An algorithm based on sea-level pressure fluctuations to identify major Baltic inflow events. Tellus Series a-Dynamic Meteorology and Oceanography, 66, doi:10.3402/tellusa.v66.23452.
- Schindelegger, M., and R. D. Ray, 2014: Surface Pressure Tide Climatologies Deduced from a Quality-Controlled Network of Barometric Observations. Monthly Weather Review, 142, 4872-4889, doi:10.1175/MWR-D-14-00217.1.
- Schmidt, G. A., and Coauthors, 2014: Using palaeo-climate comparisons to constrain future projections in CMIP5. Climate of the Past, 10, 221-250, doi:10.5194/cp-10-221-2014.
- Seager, R., and M. Hoerling, 2014: Atmosphere and Ocean Origins of North American Droughts. J. Clim., 27, 4581-4606, doi:10.1175/JCLI-D-13-00329.1. Serreze, M. C., and R. G. Barry, 2014: Arctic Climate System, 2nd Edition. Arctic Climate System, 2nd Edition, 1-404.
- Seubert, S., and Coauthors, 2014: Mediterranean climate extremes in synoptic downscaling assessments. Theoretical and Applied Climatology, 117, 257-275, doi:10.1007/s00704-013-0993-y.
- Shan, H., Y. Guan, and J. Huang, 2014: Surface air temperature patterns on a decadal scale in China using self-organizing map and their relationship to Indo-Pacific warm pool. International Journal of Climatology, 34, 3752-3765, doi:10.1002/joc.3943.
- Shi, N., and H. Nakamura, 2014: Multi-decadal modulations in the Aleutian-Icelandic Low seesaw and the axial symmetry of the Arctic Oscillation signature, as revealed in the 20th century reanalysis. Tellus Series a-Dynamic Meteorology and Oceanography, 66, doi:10.3402/tellusa.v66.22660.
- Shukla, S. P., M. J. Puma, and B. I. Cook, 2014: The response of the South Asian Summer Monsoon circulation to intensified irrigation in global climate model simulations. Climate Dynamics, 42, 21-36, doi:10.1007/s00382-013-1786-9.
- Simmons, A. J., P. Poli, D. P. Dee, P. Berrisford, H. Hersbach, S. Kobayashi, and C. Peubey, 2014: Estimating low-frequency variability and trends in atmospheric temperature using ERA-Interim. Quarterly Journal of the Royal Meteorological Society, 140, 329-353, doi:10.1002/qj.2317.
- Skliris, N., R. Marsh, S. A. Josey, S. A. Good, C. Liu, and R. P. Allan, 2014: Salinity changes in the World Ocean since 1950 in relation to changing surface freshwater fluxes. Climate Dynamics, 43, 709-736, doi:10.1007/s00382-014-2131-7.
- Smith, C. A., G. P. Compo, and D. K. Hooper, 2014: Web-Based Reanalysis Intercomparison Tools (WRIT) for Analysis and Comparison of Reanalyses and Other Datasets. Bulletin of the American Meteorological Society, 95, 1671-1678, doi:10.1175/BAMS-D-13-00192.1.
- Staten, P. W., and T. Reichler, 2014: On the ratio between shifts in the eddy-driven jet and the Hadley cell edge. Climate Dynamics, 42, 1229-1242, doi:10.1007/s00382-013-1905-7.
- Steiger, N. J., G. J. Hakim, E. J. Steig, D. S. Battisti, and G. H. Roe, 2014: Assimilation of Time-Averaged Pseudoproxies for Climate Reconstruction. J. Clim., 27, 426-441, doi:10.1175/JCLI-D-12-00693.1.
- Stickler, A., and Coauthors, 2014: Description of the ERA-CLIM historical upper-air data. Earth System Science Data, 6, 29-48, doi:10.5194/essd-6-29-2014.
- Stickler, A., and Coauthors, 2014: ERA-CLIM Historical Surface and Upper-Air Data for Future Reanalyses. Bulletin of the American Meteorological Society, 95, 1419-1430, doi:10.1175/BAMS-D-13-00147.1.
- Stucki, P., S. Brnoenimann, O. Martius, C. Welker, M. Imhof, N. von Wattenwyl, and N. Philipp, 2014: A catalog of high-impact windstorms in Switzerland since 1859. Natural Hazards and Earth System Sciences, 14, 2867-2882, doi:10.5194/nhess-14-2867-2014.
- Sviderskyte, G., G. Stankunavicius, and E. Rimkus, 2014: Weather conditions during a transatlantic flight of Lituanica on July 15-17, 1933. Baltica, 27, 119-130, doi:10.5200/baltica.2014.27.21.
- Swart, N. C., J. C. Fyfe, O. A. Saenko, and M. Eby, 2014: Wind-driven changes in the ocean carbon sink. Biogeosciences, 11, 6107-6117, doi:10.5194/bg-11-6107-2014.
- Tardif, R., G. J. Hakim, and C. Snyder, 2014: Coupled atmosphere-ocean data assimilation experiments with a low-order climate model. Climate Dynamics, 43, 1631-1643, doi:10.1007/s00382-013-1989-0.
- Terzago, S., J. von Hardenberg, E. Palazzi, and A. Provenzale, 2014: Snowpack Changes in the Hindu Kush-Karakoram-Himalaya from CMIP5 Global Climate Models. Journal of Hydrometeorology, 15, 2293-2313, doi:10.1175/JHM-D-13-0196.1.
- Thibeault, J. M., and A. Seth, 2014: A Framework for Evaluating Model Credibility for Warm-Season Precipitation in Northeastern North America: A Case Study of CMIP5 Simulations and Projections. J. Clim., 27, 493-510, doi:10.1175/JCLI-D-12-00846.1.
- Tian, X.-J., 2014: A Local Implementation of the POD-Based Ensemble 4DVar with R-Localization. Atmospheric and Oceanic Science Letters, 7, 11-16, doi:10.3878/j.issn.1674-2834.13.0046.
- Ting, M., Y. Kushnir, and C. Li, 2014: North Atlantic Multidecadal SST Oscillation: External forcing versus internal variability. Journal of Marine Systems, 133, 27-38, doi:10.1016/j.jmarsys.2013.07.006.
- Titchner, H. A., and N. A. Rayner, 2014: The Met Office Hadley Centre sea ice and sea surface temperature data set, version 2: 1. Sea ice concentrations. Journal of Geophysical Research-Atmospheres, 119, 2864-2889, doi:10.1002/2013JD020316.
- Traeger-Chatterjee, C., R. W. Mueller, and J. Bendix, 2014: Analysis and Discussion of Atmospheric Precursor of European Heat Summers. Advances in Meteorology, doi:10.1155/2014/427916.
- Trigo, R. M., and Coauthors, 2014: The record precipitation and flood event in Iberia in December 1876: description and synoptic analysis. Frontiers in Earth Science, 2, doi:10.3389/feart.2014.00003.
- Turco, M., R. Marcos, P. Quintana-Segui, and M. C. Llasat, 2014: Testing instrumental and downscaled reanalysis time series for temperature trends in NE of Spain in the last century. Regional Environmental Change, 14, 1811-1823, doi:10.1007/s10113-012-0363-9.
- Ulate, M., J. Dudhia, and C. Zhang, 2014: Sensitivity of the water cycle over the Indian Ocean and Maritime Continent to parameterized physics in a regional model. Journal of Advances in Modeling Earth Systems, 6, 1095-1120, doi:10.1002/2014MS000313.
- Villafuerte, M. Q., II, J. Matsumoto, I. Akasaka, H. G. Takahashi, H. Kubota, and T. A. Cinco, 2014: Long-term trends and variability of rainfall extremes in the Philippines. Atmospheric Research, 137, 1-13, doi:10.1016/j.atmosres.2013.09.021.
- Wagman, B. M., C. S. Jackson, F. Yao, S. E. Zedler, and I. Hoteit, 2014: Metric of the 2-6 day sea-surface temperature response to wind stress in the Tropical Pacific and its sensitivity to the K-Profile Parameterization of vertical mixing. Ocean Modelling, 79, 54-64, doi:10.1016/j.ocemod.2014.04.003.
- Wahl, E. R., H. F. Diaz, J. E. Smerdon, and C. M. Ammann, 2014: Late winter temperature response to large tropical volcanic eruptions in temperate western North America: Relationship to ENSO phases. Global and Planetary Change, 122, 238-250, doi:10.1016/j.gloplacha.2014.08.005.
- Wahl, T., F. M. Calafat, and M. E. Luther, 2014: Rapid changes in the seasonal sea level cycle along the US Gulf coast from the late 20th century. Geophysical Research Letters, 41, 491-498, doi:10.1002/2013GL058777.
- Wang, B., S.-Y. Yim, J.-Y. Lee, J. Liu, and K.-J. Ha, 2014: Future change of Asian-Australian monsoon under RCP 4.5 anthropogenic warming scenario. Climate Dynamics, 42, 83-100, doi:10.1007/s00382-013-1769-x.
- Wang, H., and S. Schubert, 2014: The Precipitation Response over the Continental United States to Cold Tropical Pacific Sea Surface Temperatures. J. Clim., 27, 5036-5055, doi:10.1175/JCLI-D-13-00453.1.
- Wang, P. X., B. Wang, H. Cheng, J. Fasullo, Z. T. Guo, T. Kiefer, and Z. Y. Liu, 2014: The global monsoon across timescales: coherent variability of regional monsoons. Climate of the Past, 10, 2007-2052, doi:10.5194/cp-10-2007-2014.
- Wang, S. Y., L. Hipps, R. R. Gillies, and J.-H. Yoon, 2014: Probable causes of the abnormal ridge accompanying the 2013-2014 California drought: ENSO precursor and anthropogenic warming footprint. Geophysical Research Letters, 41, 3220-3226, doi:10.1002/2014GL059748.
- Wang, X., and C. Wang, 2014: Different impacts of various El Nino events on the Indian Ocean Dipole. Climate Dynamics, 42, 991-1005, doi:10.1007/s00382-013-1711-2.
- Wang, X. L., Y. Feng, G. P. Compo, F. W. Zwiers, R. J. Allan, V. R. Swail, and P. D. Sardeshmukh, 2014: Is the storminess in the Twentieth Century Reanalysis really inconsistent with observations? A reply to the comment by Krueger et al. (2013b). Climate Dynamics, 42, 1113-1125, doi:10.1007/s00382-013-1828-3.
- Wang, Y.-H., G. Magnusdottir, H. Stern, X. Tian, and Y. Yu, 2014: Uncertainty Estimates of the EOF-Derived North Atlantic Oscillation. J. Clim., 27, 1290-1301, doi:10.1175/JCLI-D-13-00230.1.
- Welker, C., M. Bieli, N. Piaget, and M. Sprenger, 2014: The D-Day landing of June 1944: extratropical cyclones and surface winds in June 1944 compared with a climatology based on the Twentieth Century Reanalysis. Weather, 69, 176-180, doi:10.1002/wea.2339.
- Welker, C., and O. Martius, 2014: Decadal-scale variability in hazardous winds in northern Switzerland since end of the 19th century. Atmospheric Science Letters, 15, 86-91, doi:10.1002/asl2.467.
- Wilson, A. M., and J. A. Silander, Jr., 2014: Estimating uncertainty in daily weather interpolations: a Bayesian framework for developing climate surfaces. International Journal of Climatology, 34, 2573-2584, doi:10.1002/joc.3859.
- Wise, E. K., and M. P. Dannenberg, 2014: Persistence of pressure patterns over North America and the North Pacific since AD 1500. Nature Communications, 5, doi:10.1038/ncomms5912.
- Woillez, M. N., G. Levavasseur, A. L. Daniau, M. Kageyama, D. H. Urrego, M. F. Sanchez-Goni, and V. Hanquiez, 2014: Impact of precession on the climate, vegetation and fire activity in southern Africa during MIS4. Climate of the Past, 10, 1165-1182, doi:10.5194/cp-10-1165-2014.
- Woodworth, P. L., M. A. M. Maqueda, V. M. Roussenov, R. G. Williams, and C. W. Hughes, 2014: Mean sea-level variability along the northeast American Atlantic coast and the roles of the wind and the overturning circulation. Journal of Geophysical Research-Oceans, 119, 8916-8935, doi:10.1002/2014JC010520.
- Woollings, T., C. Czuchnicki, and C. Franzke, 2014: Twentieth century North Atlantic jet variability. Quarterly Journal of the Royal Meteorological Society, 140, 783-791, doi:10.1002/qj.2197.
- Wu, L., X. L. Wang, and Y. Feng, 2014: Historical wave height trends in the South and East China Seas, 1911-2010. Journal of Geophysical Research-Oceans, 119, 4399-4409, doi:10.1002/2014JC010087.
- Wu, Y., and O. Pauluis, 2014: Midlatitude Tropopause and Low-Level Moisture. J Atmos Sci, 71, 1187-1200, doi:10.1175/JAS-D-13-0154.1.
- Xie, A., I. Allison, C. Xiao, S. Wang, J. Ren, and D. Qin, 2014: Assessment of surface pressure between Zhongshan and Dome A in East Antarctica from different meteorological reanalyses. Arct Antarct Alp Res, 46, 669-681, doi:10.1657/1938-4246-46.3.669.
- Xie, A., I. Allison, C. Xiao, S. Wang, J. Ren, and D. Qin, 2014: Assessment of air temperatures from different meteorological reanalyses for the East Antarctic region between Zhongshan and Dome A. Science China-Earth Sciences, 57, 1538-1550, doi:10.1007/s11430-013-4684-4.
- Xin, Y.-F., G. Liu, and Q.-H. Jin, 2014: Individual Variations of Winter Surface Air Temperature over Northwest and Northeast China and Their Respective Preceding Factors. Atmospheric and Oceanic Science Letters, 7, 346-351, doi:10.3878/j.issn.1674-2834.14.0010.
- Yang, C., B. S. Giese, and L. Wu, 2014: Ocean dynamics and tropical Pacific climate change in ocean reanalyses and coupled climate models. Journal of Geophysical Research-Oceans, 119, 7066-7077, doi:10.1002/2014JC009979.
- Yeo, S.-R., and K.-Y. Kim, 2014: Global warming, low-frequency variability, and biennial oscillation: an attempt to understand the physical mechanisms driving major ENSO events. Climate Dynamics, 43, 771-786, doi:10.1007/s00382-013-1862-1.
- Ying, K.-R., T.-B. Zhao, and X.-G. Zheng, 2014: Slow and Intraseasonal Modes of the Boreal Winter Atmospheric Circulation Simulated by CMIP5 Models. Atmospheric and Oceanic Science Letters, 7, 34-41, doi:10.3878/j.issn.1674-2834.13.0058.
- Yiou, P., and Coauthors, 2014: Ensemble meteorological reconstruction using circulation analogues of 1781-1785. Climate of the Past, 10, 797-809, doi:10.5194/cp-10-797-2014.
- Yu, B., X. L. Wang, X. B. Zhang, J. Cole, and Y. Feng, 2014: Decadal Covariability of the Northern Wintertime Land Surface Temperature and Atmospheric Circulation. J. Clim., 27, 633-651, doi:10.1175/JCLI-D-13-00266.1.
- Zhai, F., D. Hu, Q. Wang, and F. Wang, 2014: Long-term trend of Pacific South Equatorial Current bifurcation over 1950-2010. Geophysical Research Letters, 41, 3172-3180, doi:10.1002/2014GL059934.
- Zhang, L., C. Wang, and S.-K. Lee, 2014: Potential role of Atlantic Warm Pool-induced freshwater forcing in the Atlantic Meridional Overturning Circulation: ocean-sea ice model simulations. Climate Dynamics, 43, 553-574, doi:10.1007/s00382-013-2034-z.
- Zhao, P., and Coauthors, 2014: Trend of Surface Air Temperature in Eastern China and Associated Large-Scale Climate Variability over the Last 100 Years. J. Clim., 27, 4693-4703, doi:10.1175/JCLI-D-13-00397.1.
- Zinke, J., and Coauthors, 2014: Corals record long-term Leeuwin current variability including Ningaloo Nino/Nina since 1795. Nature Communications, 5, doi:10.1038/ncomms4607.
- Ambrosino, C., and R. E. Chandler, 2013: A Nonparametric Approach to the Removal of Documented Inhomogeneities in Climate Time Series. Journal of Applied Meteorology and Climatology, 52, 1139-1146, doi:10.1175/JAMC-D-12-0166.1.
- Anderson, B. T., J. C. Furtado, K. M. Cobb, and E. Di Lorenzo, 2013: Extratropical forcing of El Nino-Southern Oscillation asymmetry. Geophysical Research Letters, 40, 4916-4921, doi:10.1002/grl.50951.
- Araujo, I. B., M. S. Bos, L. C. Bastos, and M. M. Cardoso, 2013: Analysing the 100 year sea level record of Leixoes, Portugal. Journal of Hydrology, 481, 76-84, doi:10.1016/j.jhydrol.2012.12.019.
- Arns, A., T. Wahl, S. Dangendorf, C. Mudersbach, and J. Jensen, 2013: Determination of regionalised extreme water levels for the North Sea Coast of Schleswig-Holstein. Hydrologie Und Wasserbewirtschaftung, 57, 264-278, doi:10.5675/HyWa_2013,6_1.
- Barrier, N., A.-M. Treguier, C. Cassou, and J. Deshayes, 2013: Impact of the winter North-Atlantic weather regimes on subtropical sea-surface height variability. Climate Dynamics, 41, 1159-1171, doi:10.1007/s00382-012-1578-7.
- Belleflamme, A., X. Fettweis, C. Lang, and M. Erpicum, 2013: Current and future atmospheric circulation at 500 hPa over Greenland simulated by the CMIP3 and CMIP5 global models. Climate Dynamics, 41, 2061-2080, doi:10.1007/s00382-012-1538-2.
- Benestad, R. E., 2013: Are there persistent physical atmospheric responses to galactic cosmic rays? Environmental Research Letters, 8, doi:10.1088/1748-9326/8/3/035049.
- Bengtsson, L., 2013: What is the climate system able to do 'on its own'? Tellus Series B-Chemical and Physical Meteorology, 65, doi:10.3402/tellusb.v65i0.20189.
- Bertin, X., E. Prouteau, and C. Letetrel, 2013: A significant increase in wave height in the North Atlantic Ocean over the 20th century. Global and Planetary Change, 106, 77-83, doi:10.1016/j.gloplacha.2013.03.009.
- Bett, P. E., H. E. Thornton, and R. T. Clark, 2013: European wind variability over 140 yr. Advances in Science and Research, 10, 51-58, doi:10.5194/asr-10-51-2013.
- Bhend, J., and P. Whetton, 2013: Consistency of simulated and observed regional changes in temperature, sea level pressure and precipitation. Climatic Change, 118, 799-810, doi:10.1007/s10584-012-0691-2.
- Blunden, J., and Coauthors, 2013: State of the Climate in 2012. Bulletin of the American Meteorological Society, 94, S1-S240, doi:10.1175/2013BAMSStateoftheClimate.1.
- Box, J. E., 2013: Greenland Ice Sheet Mass Balance Reconstruction. Part II: Surface Mass Balance (1840-2010). J. Clim., 26, 6974-6989, doi:10.1175/JCLI-D-12-00518.1.
- Brigode, P., P. Bernardara, J. Gailhard, F. Garavaglia, P. Ribstein, and R. Merz, 2013: Optimization of the geopotential heights information used in a rainfall-based weather patterns classification over Austria. International Journal of Climatology, 33, 1563-1573, doi:10.1002/joc.3535.
- Brigode, P., Z. Micovic, P. Bernardara, E. Paquet, F. Garavaglia, J. Gailhard, and P. Ribstein, 2013: Linking ENSO and heavy rainfall events over coastal British Columbia through a weather pattern classification. Hydrology and Earth System Sciences, 17, 1455-1473, doi:10.5194/hess-17-1455-2013.
- Broennimann, S., and Coauthors, 2013: A global historical ozone data set and prominent features of stratospheric variability prior to 1979. Atmospheric Chemistry and Physics, 13, 9623-9639, doi:10.5194/acp-13-9623-2013.
- Broennimann, S., I. Mariani, M. Schwikowski, R. Auchmann, and A. Eichler, 2013: Simulating the temperature and precipitation signal in an Alpine ice core. Climate of the Past, 9, 2013-2022, doi:10.5194/cp-9-2013-2013.
- Broennimann, S., and A. Stickler, 2013: Aerological observations in the Tropics in the Early Twentieth Century. Meteorologische Zeitschrift, 22, 349-358, doi:10.1127/0941-2948/2013/0458.
- Brooks, H. E., 2013: Severe thunderstorms and climate change. Atmospheric Research, 123, 129-138, doi:10.1016/j.atmosres.2012.04.002.
- Brown, P. J., and A. T. DeGaetano, 2013: Trends in U.S. Surface Humidity, 1930-2010. Journal of Applied Meteorology and Climatology, 52, 147-163, doi:10.1175/JAMC-D-12-035.1.
- Brugnara, Y., S. Broennimann, J. Luterbacher, and E. Rozanov, 2013: Influence of the sunspot cycle on the Northern Hemisphere wintertime circulation from long upper-air data sets. Atmospheric Chemistry and Physics, 13, 6275-6288, doi:10.5194/acp-13-6275-2013.
- Bumbaco, K. A., K. D. Dello, and N. A. Bond, 2013: History of Pacific Northwest Heat Waves: Synoptic Pattern and Trends. Journal of Applied Meteorology and Climatology, 52, 1618-1631, doi:10.1175/JAMC-D-12-094.1.
- Capotondi, A., 2013: ENSO diversity in the NCAR CCSM4 climate model. Journal of Geophysical Research-Oceans, 118, 4755-4770, doi:10.1002/jgrc.20335.
- Cattiaux, J., B. Quesada, A. Arakelian, F. Codron, R. Vautard, and P. Yiou, 2013: North-Atlantic dynamics and European temperature extremes in the IPSL model: sensitivity to atmospheric resolution. Climate Dynamics, 40, 2293-2310, doi:10.1007/s00382-012-1529-3.
- Chakravorty, S., J. S. Chowdary, and C. Gnanaseelan, 2013: Spring asymmetric mode in the tropical Indian Ocean: role of El Nino and IOD. Climate Dynamics, 40, 1467-1481, doi:10.1007/s00382-012-1340-1.
- Chen, H. W., Q. Zhang, H. Kornich, and D. Chen, 2013: A robust mode of climate variability in the Arctic: The Barents Oscillation. Geophysical Research Letters, 40, 2856-2861, doi:10.1002/grl.50551.
- Chernokulsky, A., I. I. Mokhov, and N. Nikitina, 2013: Winter cloudiness variability over Northern Eurasia related to the Siberian High during 1966-2010. Environmental Research Letters, 8, doi:10.1088/1748-9326/8/4/045012.
- Chung, E.-S., B. J. Soden, B. J. Sohn, and J. Schmetz, 2013: An assessment of the diurnal variation of upper tropospheric humidity in reanalysis data sets. Journal of Geophysical Research-Atmospheres, 118, 3425-3430, doi:10.1002/jgrd.50345.
- Compo, G. P., P. D. Sardeshmukh, J. S. Whitaker, P. Brohan, P. D. Jones, and C. McColl, 2013: Independent confirmation of global land warming without the use of station temperatures. Geophysical Research Letters, 40, 3170-3174, doi:10.1002/grl.50425.
- Cornes, R. C., and P. D. Jones, 2013: How well does the ERA-Interim reanalysis replicate trends in extremes of surface temperature across Europe? Journal of Geophysical Research-Atmospheres, 118, 10262-10276, doi:10.1002/jgrd.50799.
- Cortesi, N., R. M. Trigo, J. C. Gonzalez-Hidalgo, and A. M. Ramos, 2013: Modelling monthly precipitation with circulation weather types for a dense network of stations over Iberia. Hydrology and Earth System Sciences, 17, 665-678, doi:10.5194/hess-17-665-2013.
- Dai, A., H. Li, Y. Sun, L.-C. Hong, L. Ho, C. Chou, and T. Zhou, 2013: The relative roles of upper and lower tropospheric thermal contrasts and tropical influences in driving Asian summer monsoons. Journal of Geophysical Research-Atmospheres, 118, 7024-7045, doi:10.1002/jgrd.50565.
- Dangendorf, S., C. Mudersbach, J. Jensen, G. Anette, and H. Heinrich, 2013: Seasonal to decadal forcing of high water level percentiles in the German Bight throughout the last century. Ocean Dynamics, 63, 533-548, doi:10.1007/s10236-013-0614-4.
- Dangendorf, S., C. Mudersbach, T. Wahl, and J. Jensen, 2013: Characteristics of intra-, inter-annual and decadal sea-level variability and the role of meteorological forcing: the long record of Cuxhaven. Ocean Dynamics, 63, 209-224, doi:10.1007/s10236-013-0598-0.
- Dangendorf, S., T. Wahl, C. Mudersbach, and J. Jensen, 2013: The Seasonal Mean Sea Level Cycle in the Southeastern North Sea. Journal of Coastal Research, 1915-1920, doi:10.2112/SI65-324.1.
- Dannenberg, M. P., and E. K. Wise, 2013: Performance of climate field reconstruction methods over multiple seasons and climate variables. Journal of Geophysical Research-Atmospheres, 118, 9595-9610, doi:10.1002/jgrd.50765.
- de Winter, R. C., A. Sterl, and B. G. Ruessink, 2013: Wind extremes in the North Sea Basin under climate change: An ensemble study of 12 CMIP5 GCMs. Journal of Geophysical Research-Atmospheres, 118, 1601-1612, doi:10.1002/jgrd.50147.
- Diamond, H. J., A. M. Lorrey, and J. A. Renwick, 2013: A Southwest Pacific Tropical Cyclone Climatology and Linkages to the El Nino-Southern Oscillation. J. Clim., 26, 3-25, doi:10.1175/JCLI-D-12-00077.1.
- Diaz, H. F., and T. W. Swetnam, 2013: THE WILDFIRES OF 1910 Climatology of an Extreme Early Twentieth-Century Event and Comparison with More Recent Extremes. Bulletin of the American Meteorological Society, 94, 1361-1370, doi:10.1175/BAMS-D-12-00150.1.
- Dieppois, B., and Coauthors, 2013: Quasi-decadal signals of Sahel rainfall and West African monsoon since the mid-twentieth century. Journal of Geophysical Research-Atmospheres, 118, 12587-12599, doi:10.1002/2013JD019681. Dijkstra, H. A., 2013: Nonlinear Climate Dynamics. Nonlinear Climate Dynamics, 1-357.
- Dominguez-Castro, F., R. M. Trigo, and J. M. Vaquero, 2013: The first meteorological measurements in the Iberian Peninsula: evaluating the storm of November 1724. Climatic Change, 118, 443-455, doi:10.1007/s10584-012-0628-9.
- Du, Y., W. Cai, and Y. Wu, 2013: A New Type of the Indian Ocean Dipole since the Mid-1970s. J. Clim., 26, 959-972, doi:10.1175/JCLI-D-12-00047.1.
- Dunstone, N. J., D. M. Smith, B. B. B. Booth, L. Hermanson, and R. Eade, 2013: Anthropogenic aerosol forcing of Atlantic tropical storms. Nature Geoscience, 6, 534-539, doi:10.1038/NGEO1854.
- El Fadli, K. I., and Coauthors, 2013: WORLD METEOROLOGICAL ORGANIZATION ASSESSMENT OF THE PURPORTED WORLD RECORD 58 degrees C TEMPERATURE EXTREME AT EL AZIZIA, LIBYA (13 SEPTEMBER 1922). Bulletin of the American Meteorological Society, 94, 199-204, doi:10.1175/BAMS-D-12-00093.1.
- Emanuel, K., and A. Sobel, 2013: Response of tropical sea surface temperature, precipitation, and tropical cyclone-related variables to changes in global and local forcing. Journal of Advances in Modeling Earth Systems, 5, 447-458, doi:10.1002/jame.20032.
- Emanuel, K., S. Solomon, D. Folini, S. Davis, and C. Cagnazzo, 2013: Influence of Tropical Tropopause Layer Cooling on Atlantic Hurricane Activity. J. Clim., 26, 2288-2301, doi:10.1175/JCLI-D-12-00242.1.
- Evans, M. N., S. E. Tolwinski-Ward, D. M. Thompson, and K. J. Anchukaitis, 2013: Applications of proxy system modeling in high resolution paleoclimatology. Quaternary Science Reviews, 76, 16-28, doi:10.1016/j.quascirev.2013.05.024.
- Fan, K., and H. Liu, 2013: Evaluation of Atmospheric Circulation in the Southern Hemisphere in 20CRv2. Atmospheric and Oceanic Science Letters, 6, 337-342, doi:10.3878/j.issn.1674-2834.13.0009.
- Feliks, Y., A. Groth, A. W. Robertson, and M. Ghil, 2013: Oscillatory Climate Modes in the Indian Monsoon, North Atlantic, and Tropical Pacific. J. Clim., 26, 9528-9544, doi:10.1175/JCLI-D-13-00105.1.
- Feng, S., and Q. Fu, 2013: Expansion of global drylands under a warming climate. Atmospheric Chemistry and Physics, 13, 10081-10094, doi:10.5194/acp-13-10081-2013.
- Franke, J., D. Frank, C. C. Raible, J. Esper, and S. Broennimann, 2013: Spectral biases in tree-ring climate proxies. Nature Climate Change, 3, 360-364, doi:10.1038/NCLIMATE1816.
- Frankignoul, C., G. Gastineau, and Y.-O. Kwon, 2013: The Influence of the AMOC Variability on the Atmosphere in CCSM3. J. Clim., 26, 9774-9790, doi:10.1175/JCLI-D-12-00862.1.
- Galbraith, P. S., and P. Larouche, 2013: Trends and variability in air and sea surface temperatures in eastern Canada. Canadian Technical Report of Fisheries and Aquatic Sciences, 3045, 1-18, doi:Gan, B., and L. Wu, 2013: Seasonal and Long-Term Coupling between Wintertime Storm Tracks and Sea Surface Temperature in the North Pacific. J. Clim., 26, 6123-6136, doi:10.1175/JCLI-D-12-00724.1.
- Garcia-Reyes, M., W. J. Sydeman, B. A. Black, R. R. Rykaczewski, D. S. Schoeman, S. A. Thompson, and S. J. Bograd, 2013: Relative influence of oceanic and terrestrial pressure systems in driving upwelling-favorable winds. Geophysical Research Letters, 40, 5311-5315, doi:10.1002/2013GL057729.
- Gastineau, G., F. D'Andrea, and C. Frankignoul, 2013: Atmospheric response to the North Atlantic Ocean variability on seasonal to decadal time scales. Climate Dynamics, 40, 2311-2330, doi:10.1007/s00382-012-1333-0.
- Gill, E. C., T. N. Chase, R. A. Pielke, Sr., and K. Wolter, 2013: Northern Hemisphere summer temperature and specific humidity anomalies from two reanalyses. Journal of Geophysical Research-Atmospheres, 118, 8297-8305, doi:10.1002/jgrd.50635.
- Gillett, N. P., and J. C. Fyfe, 2013: Annular mode changes in the CMIP5 simulations. Geophysical Research Letters, 40, 1189-1193, doi:10.1002/grl.50249.
- Gillett, N. P., J. C. Fyfe, and D. E. Parker, 2013: Attribution of observed sea level pressure trends to greenhouse gas, aerosol, and ozone changes. Geophysical Research Letters, 40, 2302-2306, doi:10.1002/grl.50500.
- Gillies, R. R., S.-Y. Wang, Y. Sun, and O.-Y. Chung, 2013: Supportive empirical modelling for the forecast of monsoon precipitation in Nepal. International Journal of Climatology, 33, 3047-3054, doi:10.1002/joc.3649.
- Givati, A., and D. Rosenfeld, 2013: The Arctic Oscillation, climate change and the effects on precipitation in Israel. Atmospheric Research, 132, 114-124, doi:10.1016/j.atmosres.2013.05.001.
- Grainger, S., C. S. Frederiksen, and X. Zheng, 2013: Modes of interannual variability of Southern Hemisphere atmospheric circulation in CMIP3 models: assessment and projections. Climate Dynamics, 41, 479-500, doi:10.1007/s00382-012-1659-7.
- Gregory, J. M., and Coauthors, 2013: Twentieth-Century Global-Mean Sea Level Rise: Is the Whole Greater than the Sum of the Parts? J. Clim., 26, 4476-4499, doi:10.1175/JCLI-D-12-00319.1.
- Gulev, S. K., M. Latif, N. Keenlyside, W. Park, and K. P. Koltermann, 2013: North Atlantic Ocean control on surface heat flux on multidecadal timescales. Nature, 499, 464-+, doi:10.1038/nature12268.
- Guo, F., Q. Liu, X.-T. Zheng, and S. Sun, 2013: The role of barrier layer in southeastern Arabian Sea during the development of positive Indian Ocean Dipole events. Journal of Ocean University of China, 12, 245-252, doi:10.1007/s11802-013-2170-4.
- Hanna, E., J. M. Jones, J. Cappelen, S. H. Mernild, L. Wood, K. Steffen, and P. Huybrechts, 2013: The influence of North Atlantic atmospheric and oceanic forcing effects on 1900-2010 Greenland summer climate and ice melt/runoff. International Journal of Climatology, 33, 862-880, doi:10.1002/joc.3475.
- Hastenrath, S., and D. Polzin, 2013: Climatic variations in Central America and the Caribbean. International Journal of Climatology, 33, 1348-1356, doi:10.1002/joc.3515.
- Hawkins, E., and P. D. Jones, 2013: On increasing global temperatures: 75 years after Callendar. Quarterly Journal of the Royal Meteorological Society, 139, 1961-1963, doi:10.1002/qj.2178.
- He, S., and H. Wang, 2013: Oscillating Relationship between the East Asian Winter Monsoon and ENSO. J. Clim., 26, 9819-9838, doi:10.1175/JCLI-D-13-00174.1.
- Hoy, A., M. Sepp, and J. Matschullat, 2013: Large-scale atmospheric circulation forms and their impact on air temperature in Europe and northern Asia. Theoretical and Applied Climatology, 113, 643-658, doi:10.1007/s00704-012-0813-9.
- Hoy, A., M. Sepp, and J. Matschullat, 2013: Atmospheric circulation variability in Europe and northern Asia (1901 to 2010). Theoretical and Applied Climatology, 113, 105-126, doi:10.1007/s00704-012-0770-3.
- Hu, Y., L. Tao, and J. Liu, 2013: Poleward expansion of the hadley circulation in CMIP5 simulations. Advances in Atmospheric Sciences, 30, 790-795, doi:10.1007/s00376-012-2187-4.
- Hwang, Y.-T., D. M. W. Frierson, and S. M. Kang, 2013: Anthropogenic sulfate aerosol and the southward shift of tropical precipitation in the late 20th century. Geophysical Research Letters, 40, 2845-2850, doi:10.1002/grl.50502.
- Jones, P. D., C. Harpham, and K. R. Briffa, 2013: Lamb weather types derived from reanalysis products. International Journal of Climatology, 33, 1129-1139, doi:10.1002/joc.3498.
- Jung, B.-J., H. M. Kim, T. Auligne, X. Zhang, X. Zhang, and X.-Y. Huang, 2013: Adjoint-Derived Observation Impact Using WRF in the Western North Pacific. Monthly Weather Review, 141, 4080-4097, doi:10.1175/MWR-D-12-00197.1.
- Jury, M. R., 2013: A return to wet conditions over Africa: 1995-2010. Theoretical and Applied Climatology, 111, 471-481, doi:10.1007/s00704-012-0677-z.
- Jury, M. R., 2013: Climate trends in southern Africa. South African Journal of Science, 109, 1-11, doi:Jury, M. R., 2013: Climate trends in southern Africa. South African Journal of Science, 109, 53-63, doi:10.1590/sajs.2013/980.
- Katsumata, K., and S. Masuda, 2013: Variability in Southern Hemisphere Ocean Circulation from the 1980s to the 2000s. J Phys Oceanogr, 43, 1981-2007, doi:10.1175/JPO-D-12-0209.1.
- Katsumata, K., B. M. Sloyan, and S. Masuda, 2013: Diapycnal and Isopycnal Transports in the Southern Ocean Estimated by a Box Inverse Model. J Phys Oceanogr, 43, 2270-2287, doi:10.1175/JPO-D-12-0210.1.
- Kent, E. C., S. Fangohr, and D. I. Berry, 2013: A comparative assessment of monthly mean wind speed products over the global ocean. International Journal of Climatology, 33, 2520-2541, doi:10.1002/joc.3606.
- Kent, E. C., N. A. Rayner, D. I. Berry, M. Saunby, B. I. Moat, J. J. Kennedy, and D. E. Parker, 2013: Global analysis of night marine air temperature and its uncertainty since 1880: The HadNMAT2 data set. Journal of Geophysical Research-Atmospheres, 118, 1281-1298, doi:10.1002/jgrd.50152.
- Kim, W., and W. Cai, 2013: Second peak in the far eastern Pacific sea surface temperature anomaly following strong El Nino events. Geophysical Research Letters, 40, 4751-4755, doi:10.1002/grl.50697.
- King, A. D., L. V. Alexander, and M. G. Donat, 2013: Asymmetry in the response of eastern Australia extreme rainfall to low-frequency Pacific variability. Geophysical Research Letters, 40, 2271-2277, doi:10.1002/grl.50427.
- Kirchner-Bossi, N., L. Prieto, R. Garcia-Herrera, L. Carro-Calvo, and S. Salcedo-Sanz, 2013: Multi-decadal variability in a centennial reconstruction of daily wind. Applied Energy, 105, 30-46, doi:10.1016/j.apenergy.2012.11.072.
- Klingaman, N. P., S. J. Woolnough, and J. Syktus, 2013: On the drivers of inter-annual and decadal rainfall variability in Queensland, Australia. International Journal of Climatology, 33, 2413-2430, doi:10.1002/joc.3593.
- Krueger, O., F. Schenk, F. Feser, and R. Weisse, 2013: Inconsistencies between Long-Term Trends in Storminess Derived from the 20CR Reanalysis and Observations. J. Clim., 26, 868-874, doi:10.1175/JCLI-D-12-00309.1. Kuentz, A., T. Mathevet, J. Gailhard, C. Perret, and V. Andreassian, 2013: Over 100 years of climatic and hydrologic variability of a Mediterranean and mountainous watershed: the Durance River. Cold and Mountain Region Hydrological Systems under Climate Change: Towards Improved Projections, 19-25.
- Lagler, K., M. Schindelegger, J. Boehm, H. Krasna, and T. Nilsson, 2013: GPT2: Empirical slant delay model for radio space geodetic techniques. Geophysical Research Letters, 40, 1069-1073, doi:10.1002/grl.50288.
- Lavers, D. A., R. P. Allan, G. Villarini, B. Lloyd-Hughes, D. J. Brayshaw, and A. J. Wade, 2013: Future changes in atmospheric rivers and their implications for winter flooding in Britain. Environmental Research Letters, 8, doi:10.1088/1748-9326/8/3/034010.
- Lee, M.-Y., and H.-H. Hsu, 2013: Identification of the Eurasian-North Pacific Multidecadal Oscillation and Its Relationship to the AMO. J. Clim., 26, 8139-8153, doi:10.1175/JCLI-D-13-00041.1.
- Li, Y., and L. R. Leung, 2013: Potential Impacts of the Arctic on Interannual and Interdecadal Summer Precipitation over China. J. Clim., 26, 899-917, doi:10.1175/JCLI-D-12-00075.1.
- Lin, X., C. Zhu, and J. Lu, 2013: Decadal change of the East Asian summer monsoon and its related surface temperature in Asia-Pacific during 1880-2004. Chinese Science Bulletin, 58, 4497-4503, doi:10.1007/s11434-013-5969-x.
- Liu, H., C. Wang, S.-K. Lee, and D. Enfield, 2013: Atlantic Warm Pool Variability in the CMIP5 Simulations. J. Clim., 26, 5315-5336, doi:10.1175/JCLI-D-12-00556.1.
- Lohmann, G., and B. R. Schoene, 2013: Climate signatures on decadal to interdecadal time scales as obtained from mollusk shells (Arctica islandica) from Iceland. Palaeogeography Palaeoclimatology Palaeoecology, 373, 152-162, doi:10.1016/j.palaeo.2012.08.006.
- Lopez-Cristoffanini, C., F. Tellier, R. Otaiza, J. A. Correa, and L. Contreras-Porcia, 2013: Tolerance to air exposure: a feature driving the latitudinal distribution of two sibling kelp species. Botanica Marina, 56, 431-440, doi:10.1515/bot-2013-0042.
- Lovejoy, S., D. Schertzer, and D. Varon, 2013: Do GCMs predict the climate ... or macroweather? Earth System Dynamics, 4, 439-454, doi:10.5194/esd-4-439-2013.
- Luebken, F. J., U. Berger, and G. Baumgarten, 2013: Temperature trends in the midlatitude summer mesosphere. Journal of Geophysical Research-Atmospheres, 118, 13347-13360, doi:10.1002/2013JD020576.
- Marcos, M., B. Puyol, F. M. Calafat, and G. Woppelmann, 2013: Sea level changes at Tenerife Island (NE Tropical Atlantic) since 1927. Journal of Geophysical Research-Oceans, 118, 4899-4910, doi:10.1002/jgrc.20377.
- Mayer, M., K. E. Trenberth, L. Haimberger, and J. T. Fasullo, 2013: The Response of Tropical Atmospheric Energy Budgets to ENSO. J. Clim., 26, 4710-4724, doi:10.1175/JCLI-D-12-00681.1.
- McGregor, S., N. Ramesh, P. Spence, M. H. England, M. J. McPhaden, and A. Santoso, 2013: Meridional movement of wind anomalies during ENSO events and their role in event termination. Geophysical Research Letters, 40, 749-754, doi:10.1002/grl.50136.
- Menary, M. B., and Coauthors, 2013: Mechanisms of aerosol-forced AMOC variability in a state of the art climate model. Journal of Geophysical Research-Oceans, 118, 2087-2096, doi:10.1002/jgrc.20178.
- Michaelis, A. C., and G. M. Lackmann, 2013: Numerical modeling of a historic storm: Simulating the Blizzard of 1888. Geophysical Research Letters, 40, 4092-4097, doi:10.1002/grl.50750.
- Misios, S., and H. Schmidt, 2013: The role of the oceans in shaping the tropospheric response to the 11 year solar cycle. Geophysical Research Letters, 40, 6373-6377, doi:10.1002/2013GL058439.
- Misra, V., S. M. DiNapoli, and S. Bastola, 2013: Dynamic downscaling of the twentieth-century reanalysis over the southeastern United States. Regional Environmental Change, 13, S15-S23, doi:10.1007/s10113-012-0372-8.
- Mitchell, L., and G. A. Gottwald, 2013: Controlling model error of underdamped forecast models in sparse observational networks using a variance-limiting Kalman filter. Quarterly Journal of the Royal Meteorological Society, 139, 212-225, doi:10.1002/qj.1968.
- Monier, E., J. R. Scott, A. P. Sokolov, C. E. Forest, and C. A. Schlosser, 2013: An integrated assessment modeling framework for uncertainty studies in global and regional climate change: the MIT IGSM-CAM (version 1.0). Geoscientific Model Development, 6, 2063-2085, doi:10.5194/gmd-6-2063-2013.
- Monier, E., A. Sokolov, A. Schlosser, J. Scott, and X. Gao, 2013: Probabilistic projections of 21st century climate change over Northern Eurasia. Environmental Research Letters, 8, doi:10.1088/1748-9326/8/4/045008.
- Moore, G. W. K., 2013: Tibetan ice core evidence for an intensification of the East Asian jet stream since the 1870s. Atmospheric Science Letters, 14, 235-242, doi:10.1002/asl2.445.
- Moore, G. W. K., I. A. Renfrew, and R. S. Pickart, 2013: Multidecadal Mobility of the North Atlantic Oscillation. J. Clim., 26, 2453-2466, doi:10.1175/JCLI-D-12-00023.1.
- Nadiga, B. T., W. R. Casper, and P. W. Jones, 2013: Ensemble-based global ocean data assimilation. Ocean Modelling, 72, 210-230, doi:10.1016/j.ocemod.2013.09.002.
- Nakamura, J., U. Lall, Y. Kushnir, A. W. Robertson, and R. Seager, 2013: Dynamical Structure of Extreme Floods in the US Midwest and the United Kingdom. Journal of Hydrometeorology, 14, 485-504, doi:10.1175/JHM-D-12-059.1.
- Newman, M., 2013: ATMOSPHERIC SCIENCE Winds of change. Nature Climate Change, 3, 538-539, doi:10.1038/nclimate1915.
- Nguyen, H., A. Evans, C. Lucas, I. Smith, and B. Timbal, 2013: The Hadley Circulation in Reanalyses: Climatology, Variability, and Change. J. Clim., 26, 3357-3376, doi:10.1175/JCLI-D-12-00224.1.
- Nidheesh, A. G., M. Lengaigne, J. Vialard, A. S. Unnikrishnan, and H. Dayan, 2013: Decadal and long-term sea level variability in the tropical Indo-Pacific Ocean. Climate Dynamics, 41, 381-402, doi:10.1007/s00382-012-1463-4.
- Nyadjro, E. S., B. Subrahmanyam, and B. S. Giese, 2013: Variability of salt flux in the Indian Ocean during 1960-2008. Remote Sens Environ, 134, 175-193, doi:10.1016/j.rse.2013.03.005.
- Paek, H., and H.-P. Huang, 2013: Centennial Trend and Decadal-to-Interdecadal Variability of Atmospheric Angular Momentum in CMIP3 and CMIP5 Simulations. J. Clim., 26, 3846-3864, doi:10.1175/JCLI-D-12-00515.1.
- Peings, Y., E. Brun, V. Mauvais, and H. Douville, 2013: How stationary is the relationship between Siberian snow and Arctic Oscillation over the 20th century? Geophysical Research Letters, 40, 183-188, doi:10.1029/2012GL054083.
- Pena-Ortiz, C., D. Gallego, P. Ribera, P. Ordonez, and M. Del Carmen Alvarez-Castro, 2013: Observed trends in the global jet stream characteristics during the second half of the 20th century. Journal of Geophysical Research-Atmospheres, 118, 2702-2713, doi:10.1002/jgrd.50305.
- Pfeiffer, M., A. Spessa, and J. O. Kaplan, 2013: A model for global biomass burning in preindustrial time: LPJ-LMfire (v1.0). Geoscientific Model Development, 6, 643-685, doi:10.5194/gmd-6-643-2013. Pielke, R. A., 2013: Mesoscale Meteorological Modeling, 3rd Edition. Mesoscale Meteorological Modeling, 3rd Edition, 1-726.
- Pisoft, P., and Coauthors, 2013: Manifestation of reanalyzed QBO and SSC signals. Theoretical and Applied Climatology, 112, 637-646, doi:10.1007/s00704-012-0752-5.
- Price, D. T., and Coauthors, 2013: Anticipating the consequences of climate change for Canada's boreal forest ecosystems. Environmental Reviews, 21, 322-365, doi:10.1139/er-2013-0042.
- Prive, N. C., and R. M. Errico, 2013: The role of model and initial condition error in numerical weather forecasting investigated with an observing system simulation experiment. Tellus Series a-Dynamic Meteorology and Oceanography, 65, doi:10.3402/tellusa.v65i0.21740.
- Przybylak, R., P. Wyszynski, Z. Vizi, and J. Jankowska, 2013: Atmospheric pressure changes in the Arctic from 1801 to 1920. International Journal of Climatology, 33, 1730-1760, doi:10.1002/joc.3546.
- Purich, A., T. Cowan, S.-K. Min, and W. Cai, 2013: Autumn Precipitation Trends over Southern Hemisphere Midlatitudes as Simulated by CMIP5 Models. J. Clim., 26, 8341-8356, doi:10.1175/JCLI-D-13-00007.1. Rao, M. V. S. R., J. Sanjay, and R. Krishnan, 2013: Observed variations in the Indian monsoon hydroclimate during recent decades. Climate and Land Surface Changes in Hydrology, 253-259.
- Richard, Y., and Coauthors, 2013: Temperature changes in the mid- and high- latitudes of the Southern Hemisphere. International Journal of Climatology, 33, 1948-1963, doi:10.1002/joc.3563.
- Rotstayn, L. D., M. A. Collier, A. Chrastansky, S. J. Jeffrey, and J. J. Luo, 2013: Projected effects of declining aerosols in RCP4.5: unmasking global warming? Atmospheric Chemistry and Physics, 13, 10883-10905, doi:10.5194/acp-13-10883-2013.
- Santos, J. A., T. Woollings, and J. G. Pinto, 2013: Are the Winters 2010 and 2012 Archetypes Exhibiting Extreme Opposite Behavior of the North Atlantic Jet Stream? Monthly Weather Review, 141, 3626-3640, doi:10.1175/MWR-D-13-00024.1.
- Sheffield, J., and Coauthors, 2013: North American Climate in CMIP5 Experiments. Part I: Evaluation of Historical Simulations of Continental and Regional Climatology. J. Clim., 26, 9209-9245, doi:10.1175/JCLI-D-12-00592.1.
- Sheffield, J., and Coauthors, 2013: North American Climate in CMIP5 Experiments. Part II: Evaluation of Historical Simulations of Intraseasonal to Decadal Variability. J. Clim., 26, 9247-9290, doi:10.1175/JCLI-D-12-00593.1.
- Soon, W., and D. R. Legates, 2013: Solar irradiance modulation of Equator-to-Pole (Arctic) temperature gradients: Empirical evidence for climate variation on multi-decadal timescales. Journal of Atmospheric and Solar-Terrestrial Physics, 93, 45-56, doi:10.1016/j.jastp.2012.11.015.
- Stagge, J. H., and G. E. Moglen, 2013: A nonparametric stochastic method for generating daily climate-adjusted streamflows. Water Resources Research, 49, 6179-6193, doi:10.1002/wrcr.20448.
- Stahle, D. K., D. J. Burnette, and D. W. Stahle, 2013: A Moisture Balance Reconstruction for the Drainage Basin of Albemarle Sound, North Carolina. Estuaries and Coasts, 36, 1340-1353, doi:10.1007/s12237-013-9643-y.
- Sun, C., J. Li, F.-F. Jin, and R. Ding, 2013: Sea surface temperature inter-hemispheric dipole and its relation to tropical precipitation. Environmental Research Letters, 8, doi:10.1088/1748-9326/8/4/044006.
- Thomas, E. R., T. J. Bracegirdle, J. Turner, and E. W. Wolff, 2013: A 308 year record of climate variability in West Antarctica. Geophysical Research Letters, 40, 5492-5496, doi:10.1002/2013GL057782.
- Toreti, A., M. Schneuwly-Bollschweiler, M. Stoffel, and J. Luterbacher, 2013: Atmospheric Forcing of Debris Flows in the Southern Swiss Alps. Journal of Applied Meteorology and Climatology, 52, 1554-1560, doi:10.1175/JAMC-D-13-077.1.
- Trouet, V., and G. J. Van Oldenborgh, 2013: Knmi Climate Explorer: A Web-Based Research Tool for High-Resolution Paleoclimatology. Tree-Ring Research, 69, 3-13, doi:10.3959/1536-1098-69.1.3.
- Truchelut, R. E., R. E. Hart, and B. Luthman, 2013: Global Identification of Previously Undetected Pre-Satellite-Era Tropical Cyclone Candidates in NOAA/CIRES Twentieth-Century Reanalysis Data. Journal of Applied Meteorology and Climatology, 52, 2243-2259, doi:10.1175/JAMC-D-12-0276.1.
- van der Schrier, G., E. J. M. van den Besselaar, A. M. G. K. Tank, and G. Verver, 2013: Monitoring European average temperature based on the E-OBS gridded data set. Journal of Geophysical Research-Atmospheres, 118, 5120-5135, doi:10.1002/jgrd.50444.
- van Haren, R., G. J. van Oldenborgh, G. Lenderink, and W. Hazeleger, 2013: Evaluation of modeled changes in extreme precipitation in Europe and the Rhine basin. Environmental Research Letters, 8, doi:10.1088/1748-9326/8/1/014053.
- van Oldenborgh, G. J., A. T. J. de Laat, J. Luterbacher, W. J. Ingram, and T. J. Osborn, 2013: Claim of solar influence is on thin ice: are 11-year cycle solar minima associated with severe winters in Europe? Environmental Research Letters, 8, doi:10.1088/1748-9326/8/2/024014.
- Varikoden, H., and B. Preethi, 2013: Wet and dry years of Indian summer monsoon and its relation with Indo-Pacific sea surface temperatures. International Journal of Climatology, 33, 1761-1771, doi:10.1002/joc.3547.
- Vavrus, S. J., 2013: Extreme Arctic cyclones in CMIP5 historical simulations. Geophysical Research Letters, 40, 6208-6212, doi:10.1002/2013GL058161.
- Wahl, T., I. D. Haigh, S. Dangendorf, and J. Jensen, 2013: Inter-annual and long-term mean sea level changes along the North Sea coastline. Journal of Coastal Research, 1987-1992, doi:10.2112/SI65-336.1.
- Wahl, T., and Coauthors, 2013: Observed mean sea level changes around the North Sea coastline from 1800 to present. Earth-Science Reviews, 124, 51-67, doi:10.1016/j.earscirev.2013.05.003.
- Wang, B., J. Liu, H.-J. Kim, P. J. Webster, S.-Y. Yim, and B. Xiang, 2013: Northern Hemisphere summer monsoon intensified by mega-El Nino/southern oscillation and Atlantic multidecadal oscillation. Proceedings of the National Academy of Sciences of the United States of America, 110, 5347-5352, doi:10.1073/pnas.1219405110.
- Wang, C., and X. Wang, 2013: Classifying El Nino Modoki I and II by Different Impacts on Rainfall in Southern China and Typhoon Tracks. J. Clim., 26, 1322-1338, doi:10.1175/JCLI-D-12-00107.1.
- Wang, C., and L. Zhang, 2013: Multidecadal Ocean Temperature and Salinity Variability in the Tropical North Atlantic: Linking with the AMO, AMOC, and Subtropical Cell. J. Clim., 26, 6137-6162, doi:10.1175/JCLI-D-12-00721.1.
- Wang, C., L. Zhang, and S.-K. Lee, 2013: Response of Freshwater Flux and Sea Surface Salinity to Variability of the Atlantic Warm Pool. J. Clim., 26, 1249-1267, doi:10.1175/JCLI-D-12-00284.1.
- Wang, G., and W. Cai, 2013: Climate-change impact on the 20th-century relationship between the Southern Annular Mode and global mean temperature. Scientific Reports, 3, doi:10.1038/srep02039.
- Wang, J., Z. Yan, P. D. Jones, and J. Xia, 2013: On "observation minus reanalysis" method: A view from multidecadal variability. Journal of Geophysical Research-Atmospheres, 118, 7450-7458, doi:10.1002/jgrd.50574.
- Wang, R., and L. Wu, 2013: Climate Changes of Atlantic Tropical Cyclone Formation Derived from Twentieth-Century Reanalysis. J. Clim., 26, 8995-9005, doi:10.1175/JCLI-D-13-00056.1.
- Wang, S., M. Xue, and J. Min, 2013: A four-dimensional asynchronous ensemble square-root filter (4DEnSRF) algorithm and tests with simulated radar data. Quarterly Journal of the Royal Meteorological Society, 139, 805-819, doi:10.1002/qj.1987.
- Wang, S.-Y., and R. R. Gillies, 2013: Influence of the Pacific quasi-decadal oscillation on the monsoon precipitation in Nepal. Climate Dynamics, 40, 95-107, doi:10.1007/s00382-012-1376-2.
- Wang, S.-Y., M. L'Heureux, and J.-H. Yoon, 2013: Are Greenhouse Gases Changing ENSO Precursors in the Western North Pacific? J. Clim., 26, 6309-6322, doi:10.1175/JCLI-D-12-00360.1.
- Wang, X. L., Y. Feng, G. P. Compo, V. R. Swail, F. W. Zwiers, R. J. Allan, and P. D. Sardeshmukh, 2013: Trends and low frequency variability of extra-tropical cyclone activity in the ensemble of twentieth century reanalysis. Climate Dynamics, 40, 2775-2800, doi:10.1007/s00382-012-1450-9.
- Wartenburger, R., S. Broennimann, and A. Stickler, 2013: Observation errors in early historical upper-air observations. Journal of Geophysical Research-Atmospheres, 118, 12012-12028, doi:10.1002/2013JD020156.
- Willett, K. M., and Coauthors, 2013: HadISDH: an updateable land surface specific humidity product for climate monitoring. Climate of the Past, 9, 657-677, doi:10.5194/cp-9-657-2013.
- Xia, J., Z. Yan, and P. Wu, 2013: Multidecadal variability in local growing season during 1901-2009. Climate Dynamics, 41, 295-305, doi:10.1007/s00382-012-1438-5.
- Xu, J., and A. M. Powell, Jr., 2013: What happened to surface temperature with sunspot activity in the past 130 years? Theoretical and Applied Climatology, 111, 609-622, doi:10.1007/s00704-012-0694-y.
- Yan, Q., Z. Zhang, Y. Gao, H. Wang, and O. M. Johannessen, 2013: Sensitivity of the modeled present-day Greenland Ice Sheet to climatic forcing and spin-up methods and its influence on future sea level projections. Journal of Geophysical Research-Earth Surface, 118, 2174-2189, doi:10.1002/jgrf.20156.
- Yang, C., and B. S. Giese, 2013: El Nino Southern Oscillation in an ensemble ocean reanalysis and coupled climate models. Journal of Geophysical Research-Oceans, 118, 4052-4071, doi:10.1002/jgrc.20284.
- Yang, X., and Coauthors, 2013: A Predictable AMO-Like Pattern in the GFDL Fully Coupled Ensemble Initialization and Decadal Forecasting System. J. Clim., 26, 650-661, doi:10.1175/JCLI-D-12-00231.1.
- Yiou, P., T. Salameh, P. Drobinski, L. Menut, R. Vautard, and M. Vrac, 2013: Ensemble reconstruction of the atmospheric column from surface pressure using analogues. Climate Dynamics, 41, 1333-1344, doi:10.1007/s00382-012-1626-3.
- Yoshimura, K., and M. Kanamitsu, 2013: Incremental Correction for the Dynamical Downscaling of Ensemble Mean Atmospheric Fields. Monthly Weather Review, 141, 3087-3101, doi:10.1175/MWR-D-12-00271.1.
- Zampieri, M., E. Scoccimarro, and S. Gualdi, 2013: Atlantic influence on spring snowfall over the Alps in the past 150 years. Environmental Research Letters, 8, doi:10.1088/1748-9326/8/3/034026.
- Zhai, F., D. Hu, and T. Qu, 2013: Decadal variations of the North Equatorial Current in the Pacific at 137 degrees E. Journal of Geophysical Research-Oceans, 118, 4989-5006, doi:10.1002/jgrc.20391.
- Zhai, X., and C. Wunsch, 2013: On the Variability of Wind Power Input to the Oceans with a Focus on the Subpolar North Atlantic. J. Clim., 26, 3892-3903, doi:10.1175/JCLI-D-12-00472.1.
- Zhang, G., and Z. Wang, 2013: Interannual Variability of the Atlantic Hadley Circulation in Boreal Summer and Its Impacts on Tropical Cyclone Activity. J. Clim., 26, 8529-8544, doi:10.1175/JCLI-D-12-00802.1.
- Zhang, L., L. Wu, and B. Gan, 2013: Modes and Mechanisms of Global Water Vapor Variability over the Twentieth Century. J. Clim., 26, 5578-5593, doi:10.1175/JCLI-D-12-00585.1.
- Zhang, L., and T. Zhou, 2013: A comparison of tropospheric temperature changes over China revealed by multiple data sets. Journal of Geophysical Research-Atmospheres, 118, 4217-4230, doi:10.1002/jgrd.50370.
- Zhang, Q., H. Kornich, and K. Holmgren, 2013: How well do reanalyses represent the southern African precipitation? Climate Dynamics, 40, 951-962, doi:10.1007/s00382-012-1423-z.
- Zhang, Z., W. Guo, D. Gong, and S.-J. Kim, 2013: Evaluation of the twentieth century reanalysis dataset in describing East Asian winter monsoon variability. Advances in Atmospheric Sciences, 30, 1645-1652, doi:10.1007/s00376-012-2226-1.
- Zheng, F., J. Li, R. T. Clark, and H. C. Nnamchi, 2013: Simulation and Projection of the Southern Hemisphere Annular Mode in CMIP5 Models. J. Clim., 26, 9860-9879, doi:10.1175/JCLI-D-13-00204.1.
- Abarca-del-Rio, R., D. Gambis, and D. Salstein, 2012: Interdecadal oscillations in Atmospheric Angular Momentum variations. Journal of Geodetic Science, 2, 42-52, doi:10.2478/v10156-011-0025-8.
- Achberger, C., and Coauthors, 2012: STATE OF THE CLIMATE IN 2011 Special Supplement to the Bulletin of the American Meteorological Society Vol. 93, No. 7, July 2012. Bulletin of the American Meteorological Society, 93, S1-S263, doi:10.1175/2012BAMSStateoftheClimate.1.
- Backman, J., and Coauthors, 2012: On the diurnal cycle of urban aerosols, black carbon and the occurrence of new particle formation events in springtime Sao Paulo, Brazil. Atmospheric Chemistry and Physics, 12, 11733-11751, doi:10.5194/acp-12-11733-2012.
- Baker, A., and Coauthors, 2012: Millennial-length forward models and pseudoproxies of stalagmite delta O-18: an example from NW Scotland. Climate of the Past, 8, 1153-1167, doi:10.5194/cp-8-1153-2012.
- Bhend, J., J. Franke, D. Folini, M. Wild, and S. Broennimann, 2012: An ensemble-based approach to climate reconstructions. Climate of the Past, 8, 963-976, doi:10.5194/cp-8-963-2012.
- Broennimann, S., and G. P. Compo, 2012: Ozone highs and associated flow features in the first half of the twentieth century in different data sets. Meteorologische Zeitschrift, 21, 49-59, doi:10.1127/0941-2948/2012/0284.
- Broennimann, S., and Coauthors, 2012: A multi-data set comparison of the vertical structure of temperature variability and change over the Arctic during the past 100 years. Climate Dynamics, 39, 1577-1598, doi:10.1007/s00382-012-1291-6.
- Broennimann, S., and J. Luterbacher, 2012: Weather and climate extremes during the past 100 years. Meteorologische Zeitschrift, 21, 9-11, doi:10.1127/0941-2948/2012/0525.
- Broennimann, S., and Coauthors, 2012: Extreme winds at northern mid-latitudes since 1871. Meteorologische Zeitschrift, 21, 13-27, doi:10.1127/0941-2948/2012/0337.
- Cai, W., T. Cowan, and M. Thatcher, 2012: Rainfall reductions over Southern Hemisphere semi-arid regions: the role of subtropical dry zone expansion. Scientific Reports, 2, doi:10.1038/srep00702.
- Calafat, F. M., D. P. Chambers, and M. N. Tsimplis, 2012: Mechanisms of decadal sea level variability in the eastern North Atlantic and the Mediterranean Sea. Journal of Geophysical Research-Oceans, 117, doi:10.1029/2012JC008285.
- Cao, J., J. Hu, and Y. Tao, 2012: An index for the interface between the Indian summer monsoon and the East Asian summer monsoon. Journal of Geophysical Research-Atmospheres, 117, doi:10.1029/2012JD017841.
- Carton, J. A., H. F. Seidel, and B. S. Giese, 2012: Detecting historical ocean climate variability. Journal of Geophysical Research-Oceans, 117, doi:10.1029/2011JC007401.
- Chen, Z., and L. Wu, 2012: Long-term change of the Pacific North Equatorial Current bifurcation in SODA. Journal of Geophysical Research-Oceans, 117, doi:10.1029/2011JC007814.
- Chernokulsky, A., and I. I. Mokhov, 2012: Climatology of Total Cloudiness in the Arctic: An Intercomparison of Observations and Reanalyses. Advances in Meteorology, doi:10.1155/2012/542093.
- Chowdary, J. S., S.-P. Xie, H. Tokinaga, Y. M. Okumura, H. Kubota, N. Johnson, and X.-T. Zheng, 2012: Interdecadal Variations in ENSO Teleconnection to the Indo-Western Pacific for 1870-2007. J. Clim., 25, 1722-1744, doi:10.1175/JCLI-D-11-00070.1.
- Colgan, W., W. T. Pfeffer, H. Rajaram, W. Abdalati, and J. Balog, 2012: Monte Carlo ice flow modeling projects a new stable configuration for Columbia Glacier, Alaska, c. 2020. Cryosphere, 6, 1395-1409, doi:10.5194/tc-6-1395-2012.
- Dawson, A., T. N. Palmer, and S. Corti, 2012: Simulating regime structures in weather and climate prediction models. Geophysical Research Letters, 39, doi:10.1029/2012GL053284.
- Diaz, H. F., and T. W. Giambelluca, 2012: Changes in atmospheric circulation patterns associated with high and low rainfall regimes in the Hawaiian Islands region on multiple time scales. Global and Planetary Change, 98-99, 97-108, doi:10.1016/j.gloplacha.2012.08.011.
- DiNapoli, S. M., and V. Misra, 2012: Reconstructing the 20th century high-resolution climate of the southeastern United States. Journal of Geophysical Research-Atmospheres, 117, doi:10.1029/2012JD018303.
- Driscoll, S., A. Bozzo, L. J. Gray, A. Robock, and G. Stenchikov, 2012: Coupled Model Intercomparison Project 5 (CMIP5) simulations of climate following volcanic eruptions. Journal of Geophysical Research-Atmospheres, 117, doi:10.1029/2012JD017607.
- Ferguson, C. R., and G. Villarini, 2012: Detecting inhomogeneities in the Twentieth Century Reanalysis over the central United States. Journal of Geophysical Research-Atmospheres, 117, doi:10.1029/2011JD016988.
- Ferguson, C. R., E. F. Wood, and R. K. Vinukollu, 2012: A Global Intercomparison of Modeled and Observed Land-Atmosphere Coupling. Journal of Hydrometeorology, 13, 749-784, doi:10.1175/JHM-D-11-0119.1.
- Fyfe, J. C., N. P. Gillett, and G. J. Marshall, 2012: Human influence on extratropical Southern Hemisphere summer precipitation. Geophysical Research Letters, 39, doi:10.1029/2012GL054199.
- Galbraith, P. S., P. Larouche, J. Chasse, and B. Petrie, 2012: Sea-surface temperature in relation to air temperature in the Gulf of St. Lawrence: Interdecadal variability and long term trends. Deep-Sea Research Part Ii-Topical Studies in Oceanography, 77-80, 10-20, doi:10.1016/j.dsr2.2012.04.001.
- Gan, B., and L. Wu, 2012: Modulation of Atmospheric Response to North Pacific SST Anomalies under Global Warming: A Statistical Assessment. J. Clim., 25, 6554-6566, doi:10.1175/JCLI-D-11-00493.1.
- Girardin, M. P., X. J. Guo, P. Y. Bernier, F. Raulier, and S. Gauthier, 2012: Changes in growth of pristine boreal North American forests from 1950 to 2005 driven by landscape demographics and species traits. Biogeosciences, 9, 2523-2536, doi:10.5194/bg-9-2523-2012.
- Gordov, E. p., and Coauthors, 2012: Geo-information system for investigation of regional climatic changes and first results obtained. Optika atmosfery i okeana, 25, 137-143, doi:Grodsky, S. A., J. A. Carton, S. Nigam, and Y. M. Okumura, 2012: Tropical Atlantic Biases in CCSM4. J. Clim., 25, 3684-3701, doi:10.1175/JCLI-D-11-00315.1.
- Haimberger, L., C. Tavolato, and S. Sperka, 2012: Homogenization of the Global Radiosonde Temperature Dataset through Combined Comparison with Reanalysis Background Series and Neighboring Stations. J. Clim., 25, 8108-8131, doi:10.1175/JCLI-D-11-00668.1.
- Hanna, E., S. H. Mernild, J. Cappelen, and K. Steffen, 2012: Recent warming in Greenland in a long-term instrumental (1881-2012) climatic context: I. Evaluation of surface air temperature records. Environmental Research Letters, 7, doi:10.1088/1748-9326/7/4/045404.
- Harvey, B. J., L. C. Shaffrey, T. J. Woollings, G. Zappa, and K. I. Hodges, 2012: How large are projected 21st century storm track changes? Geophysical Research Letters, 39, doi:10.1029/2012GL052873.
- Hoerling, M., J. Eischeid, J. Perlwitz, X. Quan, T. Zhang, and P. Pegion, 2012: On the Increased Frequency of Mediterranean Drought. J. Clim., 25, 2146-2161, doi:10.1175/JCLI-D-11-00296.1.
- Ionita, M., G. Lohmann, N. Rimbu, and S. Chelcea, 2012: Interannual Variability of Rhine River Streamflow and Its Relationship with Large-Scale Anomaly Patterns in Spring and Autumn. Journal of Hydrometeorology, 13, 172-188, doi:10.1175/JHM-D-11-063.1.
- Ionita, M., G. Lohmann, N. Rimbu, S. Chelcea, and M. Dima, 2012: Interannual to decadal summer drought variability over Europe and its relationship to global sea surface temperature. Climate Dynamics, 38, 363-377, doi:10.1007/s00382-011-1028-y.
- Ionita, M., G. Lohmann, N. Rimbu, and P. Scholz, 2012: Dominant modes of Diurnal Temperature Range variability over Europe and their relationships with large-scale atmospheric circulation and sea surface temperature anomaly patterns. Journal of Geophysical Research-Atmospheres, 117, doi:10.1029/2011JD016669.
- Keller, K. M., and Coauthors, 2012: Variability of the ocean carbon cycle in response to the North Atlantic Oscillation. Tellus Series B-Chemical and Physical Meteorology, 64, doi:10.3402/tellusb.v64i0.18738.
- Kunkel, K. E., D. R. Easterling, D. A. R. Kristvich, B. Gleason, L. Stoecker, and R. Smith, 2012: Meteorological Causes of the Secular Variations in Observed Extreme Precipitation Events for the Conterminous United States. Journal of Hydrometeorology, 13, 1131-1141, doi:10.1175/JHM-D-11-0108.1.
- Lavers, D. A., G. Villarini, R. P. Allan, E. F. Wood, and A. J. Wade, 2012: The detection of atmospheric rivers in atmospheric reanalyses and their links to British winter floods and the large-scale climatic circulation. Journal of Geophysical Research-Atmospheres, 117, doi:10.1029/2012JD018027.
- Lehner, F., C. C. Raible, D. Hofer, and T. F. Stocker, 2012: The freshwater balance of polar regions in transient simulations from 1500 to 2100 AD using a comprehensive coupled climate model. Climate Dynamics, 39, 347-363, doi:10.1007/s00382-011-1199-6.
- Lehner, F., C. C. Raible, and T. F. Stocker, 2012: Testing the robustness of a precipitation proxy-based North Atlantic Oscillation reconstruction. Quaternary Science Reviews, 45, 85-94, doi:10.1016/j.quascirev.2012.04.025.
- Liu, C., and L. Wu, 2012: An intensification trend of South Pacific Mode Water subduction rates over the 20th century. Journal of Geophysical Research-Oceans, 117, doi:10.1029/2011JC007755.
- Liu, H., C. Wang, S.-K. Lee, and D. Enfield, 2012: Atlantic Warm-Pool Variability in the IPCC AR4 CGCM Simulations. J. Clim., 25, 5612-5628, doi:10.1175/JCLI-D-11-00376.1.
- Liu, J., M. Song, Y. Hu, and X. Ren, 2012: Changes in the strength and width of the Hadley Circulation since 1871. Climate of the Past, 8, 1169-1175, doi:10.5194/cp-8-1169-2012.
- Lohmann, G., and K. H. Wiltshire, 2012: Winter atmospheric circulation signature for the timing of the spring bloom of diatoms in the North Sea. Marine Biology, 159, 2573-2581, doi:10.1007/s00227-012-1993-7.
- Lorrey, A., G. Dalu, J. Renwick, H. Diamond, and M. Gaetani, 2012: Reconstructing the South Pacific Convergence Zone Position during the Presatellite Era: A La Nina Case Study. Monthly Weather Review, 140, 3653-3668, doi:10.1175/MWR-D-11-00228.1.
- Lovejoy, S., J. Pinel, and D. Schertzer, 2012: The global space-time cascade structure of precipitation: Satellites, gridded gauges and reanalyses. Advances in Water Resources, 45, 37-50, doi:10.1016/j.advwatres.2012.03.024. Lovejoy, S., and D. Schertzer, 2012: Low-Frequency Weather and the Emergence of the Climate. Extreme Events and Natural Hazards: The Complexity Perspective, 231-254.
- Ma, Y., and R. T. Pinker, 2012: Modeling shortwave radiative fluxes from satellites. Journal of Geophysical Research-Atmospheres, 117, doi:10.1029/2012JD018332.
- Moncrieff, M. W., D. E. Waliser, M. J. Miller, M. A. Shapiro, G. R. Asrar, and J. Caughey, 2012: Multiscale Convective Organization and the Yotc Virtual Global Field Campaign. Bulletin of the American Meteorological Society, 93, 1171-1187, doi:10.1175/BAMS-D-11-00233.1.
- Moore, G. W. K., 2012: Surface pressure record of Tibetan Plateau warming since the 1870s. Quarterly Journal of the Royal Meteorological Society, 138, 1999-2008, doi:10.1002/qj.1948.
- Mueller, W. A., and Coauthors, 2012: Forecast skill of multi-year seasonal means in the decadal prediction system of the Max Planck Institute for Meteorology. Geophysical Research Letters, 39, doi:10.1029/2012GL053326.
- Neukom, R., and J. Gergis, 2012: Southern Hemisphere high-resolution palaeoclimate records of the last 2000 years. Holocene, 22, 501-524, doi:10.1177/0959683611427335.
- Nicholson, S. E., D. Klotter, and A. K. Dezfuli, 2012: Spatial reconstruction of semi-quantitative precipitation fields over Africa during the nineteenth century from documentary evidence and gauge data. Quaternary Research, 78, 13-23, doi:10.1016/j.yqres.2012.03.012.
- Oliver, E. C. J., and K. R. Thompson, 2012: A Reconstruction of Madden-Julian Oscillation Variability from 1905 to 2008. J. Clim., 25, 1996-2019, doi:10.1175/JCLI-D-11-00154.1.
- Paek, H., and H.-P. Huang, 2012: A comparison of the interannual variability in atmospheric angular momentum and length-of-day using multiple reanalysis data sets. Journal of Geophysical Research-Atmospheres, 117, doi:10.1029/2012JD018105.
- Paek, H., and H.-P. Huang, 2012: A Comparison of Decadal-to-Interdecadal Variability and Trend in Reanalysis Datasets Using Atmospheric Angular Momentum. J. Clim., 25, 4750-4758, doi:10.1175/JCLI-D-11-00358.1. Pielke, R. A., Sr., and Coauthors, 2012: Dealing With Complexity and Extreme Events Using a Bottom-Up, Resource-Based Vulnerability Perspective. Extreme Events and Natural Hazards: The Complexity Perspective, 345-359.
- Pohl, B., and N. Fauchereau, 2012: The Southern Annular Mode Seen through Weather Regimes. J. Clim., 25, 3336-3354, doi:10.1175/JCLI-D-11-00160.1.
- Ray, S., and B. S. Giese, 2012: Historical changes in El Nino and La Nina characteristics in an ocean reanalysis. Journal of Geophysical Research-Oceans, 117, doi:10.1029/2012JC008031.
- Sakov, P., F. Counillon, L. Bertino, K. A. Lisaeter, P. R. Oke, and A. Korablev, 2012: TOPAZ4: an ocean-sea ice data assimilation system for the North Atlantic and Arctic. Ocean Science, 8, 633-656, doi:10.5194/os-8-633-2012.
- Seager, R., and N. Naik, 2012: A Mechanisms-Based Approach to Detecting Recent Anthropogenic Hydroclimate Change. J. Clim., 25, 236-261, doi:10.1175/JCLI-D-11-00056.1.
- Seager, R., N. Pederson, Y. Kushnir, J. Nakamura, and S. Jurburg, 2012: The 1960s Drought and the Subsequent Shift to a Wetter Climate in the Catskill Mountains Region of the New York City Watershed. J. Clim., 25, 6721-6742, doi:10.1175/JCLI-D-11-00518.1.
- Shen, S. S. P., C. K. Lee, and J. Lawrimore, 2012: Uncertainties, Trends, and Hottest and Coldest Years of US Surface Air Temperature since 1895: An Update Based on the USHCN V2 TOB Data. J. Clim., 25, 4185-4203, doi:10.1175/JCLI-D-11-00102.1.
- Sirocko, F., H. Brunck, and S. Pfahl, 2012: Solar influence on winter severity in central Europe. Geophysical Research Letters, 39, doi:10.1029/2012GL052412.
- Soares, P. M. M., R. M. Cardoso, P. M. A. Miranda, J. de Medeiros, M. Belo-Pereira, and F. Espirito-Santo, 2012: WRF high resolution dynamical downscaling of ERA-Interim for Portugal. Climate Dynamics, 39, 2497-2522, doi:10.1007/s00382-012-1315-2.
- Solomon, A., and M. Newman, 2012: Reconciling disparate twentieth-century Indo-Pacific ocean temperature trends in the instrumental record. Nature Climate Change, 2, 691-699, doi:10.1038/NCLIMATE1591.
- Stucki, P., R. Rickli, S. Broennimann, O. Martius, H. Wanner, D. Grebner, and J. Luterbacher, 2012: Weather patterns and hydro-climatological precursors of extreme floods in Switzerland since 1868. Meteorologische Zeitschrift, 21, 531-550, doi:10.1127/0941-2948/2012/368.
- Swart, N. C., and J. C. Fyfe, 2012: Observed and simulated changes in the Southern Hemisphere surface westerly wind-stress. Geophysical Research Letters, 39, doi:10.1029/2012GL052810.
- Swart, N. C., and J. C. Fyfe, 2012: Ocean carbon uptake and storage influenced by wind bias in global climate models. Nature Climate Change, 2, 47-52, doi:10.1038/NCLIMATE1289.
- Tokinaga, H., S.-P. Xie, C. Deser, Y. Kosaka, and Y. M. Okumura, 2012: Slowdown of the Walker circulation driven by tropical Indo-Pacific warming. Nature, 491, 439-443, doi:10.1038/nature11576.
- Trouet, V., M. P. Panayotov, A. Ivanova, and D. Frank, 2012: A pan-European summer teleconnection mode recorded by a new temperature reconstruction from the northeastern Mediterranean (ad 1768-2008). Holocene, 22, 887-898, doi:10.1177/0959683611434225.
- Vose, R. S., S. Applequist, M. J. Menne, C. N. Williams, Jr., and P. Thorne, 2012: An intercomparison of temperature trends in the US Historical Climatology Network and recent atmospheric reanalyses. Geophysical Research Letters, 39, doi:10.1029/2012GL051387.
- Wallace, J. M., Q. Fu, B. V. Smoliak, P. Lin, and C. M. Johanson, 2012: Simulated versus observed patterns of warming over the extratropical Northern Hemisphere continents during the cold season. Proceedings of the National Academy of Sciences of the United States of America, 109, 14337-14342, doi:10.1073/pnas.1204875109.
- Wang, C., S. Dong, A. T. Evan, G. R. Foltz, and S.-K. Lee, 2012: Multidecadal Covariability of North Atlantic Sea Surface Temperature, African Dust, Sahel Rainfall, and Atlantic Hurricanes. J. Clim., 25, 5404-5415, doi:10.1175/JCLI-D-11-00413.1.
- Wang, J.-S., and L. Zhao, 2012: Statistical tests for a correlation between decadal variation in June precipitation in China and sunspot number. Journal of Geophysical Research-Atmospheres, 117, doi:10.1029/2012JD018074.
- Wang, S.-Y., R. R. Gillies, and T. Reichler, 2012: Multidecadal Drought Cycles in the Great Basin Recorded by the Great Salt Lake: Modulation from a Transition-Phase Teleconnection. J. Clim., 25, 1711-1721, doi:10.1175/2011JCLI4225.1.
- Wang, X. L., Y. Feng, and V. R. Swail, 2012: North Atlantic wave height trends as reconstructed from the 20th century reanalysis. Geophysical Research Letters, 39, doi:10.1029/2012GL053381.
- Wang, Y. H., G. Magnusdottir, H. Stern, X. Tian, and Y. Yu, 2012: Decadal variability of the NAO: Introducing an augmented NAO index. Geophysical Research Letters, 39, doi:10.1029/2012GL053413.
- Woehrnschimmel, H., P. Tay, H. von Waldow, H. Hung, Y.-F. Li, M. MacLeod, and K. Hungerbuhler, 2012: Comparative Assessment of the Global Fate of alpha- and beta-Hexachlorocyclohexane before and after Phase-Out. Environmental Science & Technology, 46, 2047-2054, doi:10.1021/es203109q.
- Wu, L., and Coauthors, 2012: Enhanced warming over the global subtropical western boundary currents. Nature Climate Change, 2, 161-166, doi:10.1038/NCLIMATE1353.
- Xu, J., and A. M. Powell, Jr., 2012: Uncertainty estimation of the global temperature trends for multiple radiosondes, reanalyses, and CMIP3/IPCC climate model simulations. Theoretical and Applied Climatology, 108, 505-518, doi:10.1007/s00704-011-0548-z.
- Zhang, L., A. Kumar, and W. Wang, 2012: Influence of changes in observations on precipitation: A case study for the Climate Forecast System Reanalysis (CFSR). Journal of Geophysical Research-Atmospheres, 117, doi:10.1029/2011JD017347.
- Zhang, L., and C. Wang, 2012: Remote influences on freshwater flux variability in the Atlantic warm pool region. Geophysical Research Letters, 39, doi:10.1029/2012GL053530.
- Zhang, L., C. Wang, and L. Wu, 2012: Low-frequency modulation of the Atlantic warm pool by the Atlantic multidecadal oscillation. Climate Dynamics, 39, 1661-1671, doi:10.1007/s00382-011-1257-0.
- Zib, B. J., X. Dong, B. Xi, and A. Kennedy, 2012: Evaluation and Intercomparison of Cloud Fraction and Radiative Fluxes in Recent Reanalyses over the Arctic Using BSRN Surface Observations. J. Clim., 25, 2291-2305, doi:10.1175/JCLI-D-11-00147.1.
- Achberger, C., and Coauthors, 2011: State of the Climate in 2010. Bulletin of the American Meteorological Society, 92, S1-S236, doi:10.1175/1520-0477-92.6.S1.
- Allan, R., P. Brohan, G. P. Compo, R. Stone, J. Luterbacher, and S. Broennimann, 2011: The International Atmospheric Circulation Reconstructions over the Earth (ACRE) Initiative. Bulletin of the American Meteorological Society, 92, 1421-1425, doi:10.1175/2011BAMS3218.1.
- Barbero, R., and V. Moron, 2011: Seasonal to decadal modulation of the impact of El Nino-Southern Oscillation on New Caledonia (SW Pacific) rainfall (1950-2010). Journal of Geophysical Research-Atmospheres, 116, doi:10.1029/2011JD016577.
- Barriopedro, D., E. M. Fischer, J. Luterbacher, R. Trigo, and R. Garcia-Herrera, 2011: The Hot Summer of 2010: Redrawing the Temperature Record Map of Europe. Science, 332, 220-224, doi:10.1126/science.1201224.
- Broennimann, S., G. P. Compo, R. Spadin, R. Allan, and W. Adam, 2011: Early ship-based upper-air data and comparison with the Twentieth Century Reanalysis. Climate of the Past, 7, 265-276, doi:10.5194/cp-7-265-2011.
- Bye, J., K. Fraedrich, E. Kirk, S. Schubert, and X. Zhu, 2011: Random walk lengths of about 30 years in global climate. Geophysical Research Letters, 38, doi:10.1029/2010GL046333.
- Cook, B. I., R. Seager, and R. L. Miller, 2011: On the Causes and Dynamics of the Early Twentieth-Century North American Pluvial. J. Clim., 24, 5043-5060, doi:10.1175/2011JCLI4201.1.
- Cornes, R. C., and P. D. Jones, 2011: An examination of storm activity in the northeast Atlantic region over the 1851-2003 period using the EMULATE gridded MSLP data series. Journal of Geophysical Research-Atmospheres, 116, doi:10.1029/2011JD016007.
- Dee, D. P., and Coauthors, 2011: The ERA-Interim reanalysis: configuration and performance of the data assimilation system. Quarterly Journal of the Royal Meteorological Society, 137, 553-597, doi:10.1002/qj.828.
- Dole, R., and Coauthors, 2011: Was there a basis for anticipating the 2010 Russian heat wave? Geophysical Research Letters, 38, doi:10.1029/2010GL046582.
- Donat, M. G., D. Renggli, S. Wild, L. V. Alexander, G. C. Leckebusch, and U. Ulbrich, 2011: Reanalysis suggests long-term upward trends in European storminess since 1871. Geophysical Research Letters, 38, doi:10.1029/2011GL047995.
- Ebita, A., and Coauthors, 2011: The Japanese 55-year Reanalysis "JRA-55": An Interim Report. Sola, 7, 149-152, doi:10.2151/sola.2011-038.
- Feng, M., C. Boening, A. Biastoch, E. Behrens, E. Weller, and Y. Masumoto, 2011: The reversal of the multi-decadal trends of the equatorial Pacific easterly winds, and the Indonesian Throughflow and Leeuwin Current transports. Geophysical Research Letters, 38, doi:10.1029/2011GL047291.
- Gottwald, G. A., L. Mitchell, and S. Reich, 2011: Controlling Overestimation of Error Covariance in Ensemble Kalman Filters with Sparse Observations: A Variance-Limiting Kalman Filter. Monthly Weather Review, 139, 2650-2667, doi:10.1175/2011MWR3557.1.
- Grunseich, G., B. Subrahmanyam, V. S. N. Murty, and B. S. Giese, 2011: Sea surface salinity variability during the Indian Ocean Dipole and ENSO events in the tropical Indian Ocean. Journal of Geophysical Research-Oceans, 116, doi:10.1029/2011JC007456.
- Haekkinen, S., P. B. Rhines, and D. L. Worthen, 2011: Atmospheric Blocking and Atlantic Multidecadal Ocean Variability. Science, 334, 655-659, doi:10.1126/science.1205683.
- Hanna, E., and Coauthors, 2011: Greenland Ice Sheet surface mass balance 1870 to 2010 based on Twentieth Century Reanalysis, and links with global climate forcing. Journal of Geophysical Research-Atmospheres, 116, doi:10.1029/2011JD016387.
- Hao, Z., J. Zheng, Q. Ge, and W.-C. Wang, 2011: Historical analogues of the 2008 extreme snow event over Central and Southern China. Climate Research, 50, 161-170, doi:10.3354/cr01052.
- Klotzbach, P. J., 2011: A simplified Atlantic basin seasonal hurricane prediction scheme from 1 August. Geophysical Research Letters, 38, doi:10.1029/2011GL048603.
- Lavers, D. A., R. P. Allan, E. F. Wood, G. Villarini, D. J. Brayshaw, and A. J. Wade, 2011: Winter floods in Britain are connected to atmospheric rivers. Geophysical Research Letters, 38, doi:10.1029/2011GL049783.
- Lee, S.-K., and Coauthors, 2011: What caused the significant increase in Atlantic Ocean heat content since the mid-20th century? Geophysical Research Letters, 38, doi:10.1029/2011GL048856.
- Linderholm, H. W., and Coauthors, 2011: Interannual teleconnections between the summer North Atlantic Oscillation and the East Asian summer monsoon. Journal of Geophysical Research-Atmospheres, 116, doi:10.1029/2010JD015235.
- Lovejoy, S., and D. Schertzer, 2011: Space-time cascades and the scaling of ECMWF reanalyses: Fluxes and fields. Journal of Geophysical Research-Atmospheres, 116, doi:10.1029/2011JD015654.
- Luo, F., S. Li, and T. Furevik, 2011: The connection between the Atlantic Multidecadal Oscillation and the Indian Summer Monsoon in Bergen Climate Model Version 2.0. Journal of Geophysical Research-Atmospheres, 116, doi:10.1029/2011JD015848.
- Mislan, K. A. S., and D. S. Wethey, 2011: Gridded meteorological data as a resource for mechanistic macroecology in coastal environments. Ecol Appl, 21, 2678-2690, doi:10.1890/10-2049.1.
- Moore, G. W. K., J. L. Semple, and G. Hoyland, 2011: Global Warming, El Nino, and High-Impact Storms at Extreme Altitude: Historical Trends and Consequences for Mountaineers. Journal of Applied Meteorology and Climatology, 50, 2197-2209, doi:10.1175/JAMC-D-11-023.1.
- Nigam, S., B. Guan, and A. Ruiz-Barradas, 2011: Key role of the Atlantic Multidecadal Oscillation in 20th century drought and wet periods over the Great Plains. Geophysical Research Letters, 38, doi:10.1029/2011GL048650.
- Ouzeau, G., J. Cattiaux, H. Douville, A. Ribes, and D. Saint-Martin, 2011: European cold winter 2009-2010: How unusual in the instrumental record and how reproducible in the ARPEGE-Climat model? Geophysical Research Letters, 38, doi:10.1029/2011GL047667.
- Parker, D. E., 2011: Recent land surface air temperature trends assessed using the 20th Century Reanalysis. Journal of Geophysical Research-Atmospheres, 116, doi:10.1029/2011JD016438.
- Pegion, K., and P. D. Sardeshmukh, 2011: Prospects for Improving Subseasonal Predictions. Monthly Weather Review, 139, 3648-3666, doi:10.1175/MWR-D-11-00004.1.
- Rasmussen, K. L., and R. A. Houze, Jr., 2011: Orogenic Convection in Subtropical South America as Seen by the TRMM Satellite. Monthly Weather Review, 139, 2399-2420, doi:10.1175/MWR-D-10-05006.1.
- Rienecker, M. M., and Coauthors, 2011: MERRA: NASA's Modern-Era Retrospective Analysis for Research and Applications. J. Clim., 24, 3624-3648, doi:10.1175/JCLI-D-11-00015.1.
- Rimbu, N., and G. Lohmann, 2011: Winter and summer blocking variability in the North Atlantic region - evidence from long-term observational and proxy data from southwestern Greenland. Climate of the Past, 7, 543-555, doi:10.5194/cp-7-543-2011.
- Schwalm, C. R., C. A. Williams, and K. Schaefer, 2011: Carbon consequences of global hydrologic change, 1948-2009. Journal of Geophysical Research-Biogeosciences, 116, doi:10.1029/2011JG001674.
- Smith, A., N. Lott, and R. Vose, 2011: The Integrated Surface Database Recent Developments and Partnerships. Bulletin of the American Meteorological Society, 92, 704-708, doi:10.1175/2011BAMS3015.1.
- Smith, J. A., M. L. Baeck, A. A. Ntelekos, G. Villarini, and M. Steiner, 2011: Extreme rainfall and flooding from orographic thunderstorms in the central Appalachians. Water Resources Research, 47, doi:10.1029/2010WR010190.
- Soon, W., K. Dutta, D. R. Legates, V. Velasco, and W. Zhang, 2011: Variation in surface air temperature of China during the 20th century. Journal of Atmospheric and Solar-Terrestrial Physics, 73, 2331-2344, doi:10.1016/j.jastp.2011.07.007.
- Stachnik, J. P., and C. Schumacher, 2011: A comparison of the Hadley circulation in modern reanalyses. Journal of Geophysical Research-Atmospheres, 116, doi:10.1029/2011JD016677.
- Stickler, A., and S. Broennimann, 2011: Significant bias of the NCEP/NCAR and twentieth-century reanalyses relative to pilot balloon observations over the West African Monsoon region (1940-1957). Quarterly Journal of the Royal Meteorological Society, 137, 1400-1416, doi:10.1002/qj.854.
- Tardif, J. C., M. P. Girardin, and F. Conciatori, 2011: Light rings as bioindicators of climate change in Interior North America. Global and Planetary Change, 79, 134-144, doi:10.1016/j.gloplacha.2011.09.001.
- Trenberth, K. E., J. T. Fasullo, and J. Mackaro, 2011: Atmospheric Moisture Transports from Ocean to Land and Global Energy Flows in Reanalyses. J. Clim., 24, 4907-4924, doi:10.1175/2011JCLI4171.1.
- Truchelut, R. E., and R. E. Hart, 2011: Quantifying the possible existence of undocumented Atlantic warm-core cyclones in NOAA/CIRES 20th Century Reanalysis data. Geophysical Research Letters, 38, doi:10.1029/2011GL046756.
- van den Besselaar, E. J. M., M. R. Haylock, G. van der Schrier, and A. M. G. K. Tank, 2011: A European daily high-resolution observational gridded data set of sea level pressure. Journal of Geophysical Research-Atmospheres, 116, doi:10.1029/2010JD015468.
- Vicente-Serrano, S. M., and Coauthors, 2011: A multiscalar global evaluation of the impact of ENSO on droughts. Journal of Geophysical Research-Atmospheres, 116, doi:10.1029/2011JD016039.
- Villarini, G., J. A. Smith, M. L. Baeck, T. Marchok, and G. A. Vecchi, 2011: Characterization of rainfall distribution and flooding associated with US landfalling tropical cyclones: Analyses of Hurricanes Frances, Ivan, and Jeanne (2004). Journal of Geophysical Research-Atmospheres, 116, doi:10.1029/2011JD016175.
- Wang, X. L., and Coauthors, 2011: Trends and low-frequency variability of storminess over western Europe, 1878-2007. Climate Dynamics, 37, 2355-2371, doi:10.1007/s00382-011-1107-0.
- Webb, J. D. C., 2011: Violent thunderstorms in the Thames Valley and south Midlands in early June 1910. Weather, 66, 153-155, doi:10.1002/wea.799.
- Winkler, J. A., G. S. Guentchev, M. Liszewska, Perdinan, and P.-N. Tan, 2011: Climate Scenario Development and Applications for Local/Regional Climate Change Impact Assessments: An Overview for the Non-Climate Scientist. Geography Compass, 5, 301-328, doi:10.1111/j.1749-8198.2011.00426.x.
- Woollings, T., 2011: Ocean Effects of Blocking. Science, 334, 612-613, doi:10.1126/science.1214167.
- Zhang, X., L. Jin, C. Chen, D. Guan, and M. Li, 2011: Interannual and interdecadal variations in the North Atlantic Oscillation spatial shift. Chinese Science Bulletin, 56, 2621-2627, doi:10.1007/s11434-011-4607-8.
- Zhao, P., S. Yang, H. Wang, and Q. Zhang, 2011: Interdecadal Relationships between the Asian-Pacific Oscillation and Summer Climate Anomalies over Asia, North Pacific, and North America during a Recent 100 Years. J. Clim., 24, 4793-4799, doi:10.1175/JCLI-D-11-00054.1.
- Zhou, X., P. Zhao, G. Liu, and T. Zhou, 2011: Characteristics of decadal-centennial-scale changes in East Asian summer monsoon circulation and precipitation during the Medieval Warm Period and Little Ice Age and in the present day. Chinese Science Bulletin, 56, 3003-3011, doi:10.1007/s11434-011-4651-4.
- Broennimann, S., A. Stickler, T. Griesser, A. M. Fischer, A. Grant, T. Ewen, T. Zhou, M. Schraner, E. Rozanov, and T. Peter, 2009: Variability of large-scale atmospheric circulation indices for the Northern Hemisphere during the past 100 years. Meteorol. Z., 18, 379-396, doi:10.1127/0941-2948/2009/0389.
- Whitaker, J.S., G.P. Compo, and J.-N. Thepaut, 2009: A comparison of variational and ensemble-based data assimilation systems for reanalysis of sparse observations. Mon. Wea. Rev., 137, 1991-1999, doi:10.1175/2008MWR2781.1.
- Brown, P. J., and A.T. DeGaetano, 2013: Trends in U.S. Surface Humidity, 1930-2010. J. Appl. Meteor. Climatol., 52, 147-163, doi:10.1175/JAMC-D-12-035.
- Cook, B.I., R. Seager, and R.L. Miller, 2010: Atmospheric circulation anomalies during two persistent north american droughts: 1932-1939 and 1948-1957. Clim. Dyn., 36, 2339-2355. doi:10.1007/s00382-010-0807-1.
- de Bruin, H. and H. Van den Dool, 2010: De storm van 1894: Een ramp voor Scheveningen, en een test case voor moderne meteorologen.Zenit, August, 316-320.
- Emanuel, K., 2010: Tropical Cyclone Activity Downscaled from NOAA-CIRES Reanalysis, 1908-1958. J. Adv. Model. Earth Syst., Vol. 2, Art. #1, 12 pp., doi:10.3894/JAMES.2010.2.1.
- Giese, B.S., G.P. Compo, N.C. Slowey, P.D. Sardeshmukh, J.A. Carton, S. Ray, and J.S. Whitaker, 2010:The 1918/1919 El Ni�o. Bull. Amer. Meteor. Soc., 91, 177-183, doi:10.1175/2009BAMS2903.
- Lovejoy, S., and D. Schertzer, 2010: Towards a new synthesis for atmospheric dynamics: Space-time cascades, Atmos. Res., 96, 1-52, doi:10.1016/j.atmosres.2010.01.004.
- Wood, K. R., and J.E. Overland, 2010: Early 20th century Arctic warming in retrospect, Int. J. of Climatol., 30, 1269-1279, doi:10.1002/joc.1973.
2023
Compo et al. 2011- Altmann, M., and Coauthors, 2023: Quantitative Long-Term Monitoring (1890-2020) of Morphodynamic and Land-Cover Changes of a LIA Lateral Moraine Section. Geosciences, 13, doi:10.3390/geosciences13040095.
- Andree, E., J. Su, M. A. D. Larsen, M. Drews, M. Stendel, and K. S. Madsen, 2023: The role of preconditioning for extreme storm surges in the western Baltic Sea. Natural Hazards and Earth System Sciences, 23, 1817-1834, doi:10.5194/nhess-23-1817-2023.
- Arora, V. K., C. Seiler, L. B. Wang, and S. Kou-Giesbrecht, 2023: Towards an ensemble-based evaluation of land surface models in light ofuncertain forcings and observations. Biogeosciences, 20, 1313-1355, doi:10.5194/bg-20-1313-2023.
- Årthun, M., 2023: Surface-Forced Variability in the Nordic Seas Overturning Circulation and Overflows. Geophysical Research Letters, 50, doi:10.1029/2023gl104158.
- Avanzi, F., and Coauthors, 2023: IT-SNOW: a snow reanalysis for Italy blending modeling, in situ data, and satellite observations (2010-2021). Earth System Science Data, 15, 639-660, doi:10.5194/essd-15-639-2023.
- Badescu, V., N. Rotar, A. Dumitrescu, C. Oprea, and M. Paulescu, 2023: Solar global irradiance from actinometric degree data for Montsouris (Paris) 1873-1877. Theoretical and Applied Climatology, 153, 539-559, doi:10.1007/s00704-023-04485-2.
- Bai, H., C. Strong, and B. Zuckerberg, 2023: Drivers of an Ecologically Relevant Summer North American Dipole. J. Clim., 36, 2386-2398, doi:10.1175/jcli-d-22-0542.1.
- Bokuchava, D. D., and V. A. Semenov, 2023: The Role of Natural Fluctuations and Factors of External Forcing in Early 20th Century Warming in the Northern Hemisphere. Izvestiya Atmospheric and Oceanic Physics, 59, S81-S96, doi:10.1134/s0001433823130030.
- Borhara, K., B. Fosu, and S. Y. S. Wang, 2023: The role of the western North Pacific (WNP) as an El Nino-Southern Oscillation (ENSO) precursor in a warmer future climate. Climate Dynamics, doi:10.1007/s00382-023-06773-z.
- Borkotoky, S. S., A. P. Williams, and S. Steinschneider, 2023: Six Hundred Years of Reconstructed Atmospheric River Activity Along the US West Coast. Journal of Geophysical Research-Atmospheres, 128, doi:10.1029/2022jd038321.
- Brierley, C., K. Thirumalai, E. Grindrod, and J. Barnsley, 2023: Indian Ocean variability changes in the Paleoclimate Modelling Intercomparison Project. Climate of the Past, 19, 681-701, doi:10.5194/cp-19-681-2023.
- Cai, L., and Coauthors, 2023: Improvement of human-induced wildfire occurrence modeling from a spatial variation of anthropogenic ignition factor in the CLM5. Environmental Research Letters, 18, doi:10.1088/1748-9326/acf1b6.
- Cai, W. J., and Coauthors, 2023: Anthropogenic impacts on twentieth-century ENSO variability changes. Nature Reviews Earth & Environment, 4, 407-418, doi:10.1038/s43017-023-00427-8.
- Chaudhary, L., S. Sharma, and M. Sajwan, 2023: Systematic Literature Review of Various Neural Network Techniques for Sea Surface Temperature Prediction Using Remote Sensing Data. Archives of Computational Methods in Engineering, 30, 5071-5103, doi:10.1007/s11831-023-09970-5.
- Chen, W., 2023: Role of the Aleutian Low in Modulating the Connection between the Moderate El Nino and the Following Spring North Tropical Atlantic SST Anomalies. J. Clim., 36, 3681-3695, doi:10.1175/jcli-d-22-0656.1.
- Chen, Y., and Coauthors, 2023: Weakened western Pacific teleconnection pattern caused a decrease in spring persistent rainfall in north of 26 °N over Southeast China. International Journal of Climatology, 43, 4337-4346, doi:10.1002/joc.8090.
- Chinta, V., Y. Du, Y. Hong, Z. S. Chen, and J. S. Chowdary, 2023: Impact of the Interdecadal Pacific Oscillation on tropical Indian Ocean sea surface height: An assessment from CMIP6 models. International Journal of Climatology, 43, 4631-4647, doi:10.1002/joc.8107.
- Christidis, N., D. Mitchell, and P. A. Stott, 2023: Rapidly increasing likelihood of exceeding 50 °C in parts of the Mediterranean and the Middle East due to human influence. Npj Climate and Atmospheric Science, 6, doi:10.1038/s41612-023-00377-4.
- Crossett, C. C., L. A. L. Dupigny-Giroux, K. E. Kunkel, A. K. Betts, and A. Bomblies, 2023: Synoptic Typing of Multiduration, Heavy Precipitation Records in the Northeastern United States: 1895-2017. Journal of Applied Meteorology and Climatology, 62, 721-736, doi:10.1175/jamc-d-22-0091.1.
- Dangendorf, S., and Coauthors, 2023: Acceleration of US Southeast and Gulf coast sea-level rise amplified by internal climate variability. Nature Communications, 14, doi:10.1038/s41467-023-37649-9.
- Dao, T. L., C. L. Vincent, and T. P. Lane, 2023: Multiscale Influences on Rainfall in Northeast Australia. J. Clim., 36, 5989-6006, doi:10.1175/jcli-d-22-0835.1.
- Deser, C., and A. S. Phillips, 2023: A range of outcomes: the combined effects of internal variability andanthropogenic forcing on regional climate trends over Europe. Nonlinear Proc Geoph, 30, 63-84, doi:10.5194/npg-30-63-2023.
- Ding, R. Q., and Coauthors, 2023: North Atlantic oscillation controls multidecadal changes in the North Tropical Atlantic-Pacific connection. Nature Communications, 14, doi:10.1038/s41467-023-36564-3.
- Ding, Y. H., X. T. Sun, Q. Q. Li, and Y. F. Song, 2023: Interdecadal Variation in Rossby Wave Source over the Tibetan Plateau and Its Impact on the East Asia Circulation Pattern during Boreal Summer. Atmosphere, 14, doi:10.3390/atmos14030541.
- Duan, J., Y. L. Li, L. J. Cheng, P. F. Lin, and F. Wang, 2023: Heat Storage in the Upper Indian Ocean: The Role of Wind-Driven Redistribution. J. Clim., 36, 2221-2242, doi:10.1175/jcli-d-22-0534.1.
- Dutta, A., R. Sivankutty, and J. M. Neena, 2023: Investigating the Atlantic-Indian monsoon teleconnection pathways in PMIP3 last millennium simulations. Climate Dynamics, doi:10.1007/s00382-023-06994-2.
- Fan, Y. F., W. Liu, P. F. Zhang, R. Chen, and L. F. Li, 2023: North Atlantic Oscillation contributes to the subpolar North Atlantic cooling in the past century. Climate Dynamics, doi:10.1007/s00382-023-06847-y.
- Faranda, D., S. Pascale, and B. Bulut, 2023: Persistent anticyclonic conditions and climate change exacerbated the exceptional 2022 European-Mediterranean drought. Environmental Research Letters, 18, doi:10.1088/1748-9326/acbc37.
- Gao, X., Y. L. Li, P. F. Lin, L. Zhang, Q. P. Ren, Y. Lu, and F. Wang, 2023: Origins of Multidecadal SST Variations in the Southern Atlantic and Indian Oceans Since the 1960s. Geophysical Research Letters, 50, doi:10.1029/2022gl101735.
- Gavahi, K., E. Foroumandi, and H. Moradkhani, 2023: A deep learning-based framework for multi-source precipitation fusion. Remote Sens Environ, 295, doi:10.1016/j.rse.2023.113723.
- Gavrilov, A., S. Kravtsov, M. Buyanova, D. Mukhin, E. Loskutov, and A. Feigin, 2023: Forced response and internal variability in ensembles of climate simulations: identification and analysis using linear dynamical mode decomposition. Climate Dynamics, doi:10.1007/s00382-023-06995-1.
- Ge, Y. C., J. P. Miao, X. M. Lang, D. Si, and D. B. Jiang, 2023: Combined Impacts of the Pacific Decadal Oscillation and Atlantic Multidecadal Oscillation on Summer Precipitation in Eastern China During the Medieval Climate Anomaly and Little Ice Age. Journal of Geophysical Research-Atmospheres, 128, doi:10.1029/2023jd038920.
- Gelfan, A., A. Kalugin, and I. Krylenko, 2023: Detection, attribution, and specifying mechanisms of hydrological changes in geographically different river basins. Climatic Change, 176, doi:10.1007/s10584-023-03557-6.
- Gorokhovsky, E., and J. L. Anderson, 2023: Extending ensemble Kalman filter algorithms to assimilate observations with an unknown time offset. Nonlinear Proc Geoph, 30, 37-47, doi:10.5194/npg-30-37-2023.
- Grooms, I., 2023: Two Methods for Data Assimilation of Wind Direction. Tellus Series a-Dynamic Meteorology and Oceanography, 75, 145-158, doi:10.16993/tellusa.2005.
- Guan, C. Y., X. Wang, and H. J. Yang, 2023: Understanding the Development of the 2018/19 Central Pacific El Nino. Advances in Atmospheric Sciences, 40, 177-185, doi:10.1007/s00376-022-1410-1.
- Gui, S., R. W. Yang, F. Zeng, and J. X. Cheng, 2023: Interdecadal Variability in the Interface Between the Indian Summer Monsoon and the East Asian Summer Monsoon. Journal of Geophysical Research-Atmospheres, 128, doi:10.1029/2022jd038399.
- Gui, S., R. W. Yang, F. Zeng, and J. X. Cheng, 2023: Interdecadal Variability in the Interface Between the Indian Summer Monsoon and the East Asian Summer Monsoon. Journal of Geophysical Research-Atmospheres, 128, doi:10.1029/2022jd038399.
- Guo, Y. R., Y. L. Li, and F. Wang, 2023: Destinations and Pathways of the Indonesian Throughflow Water in the Indian Ocean. J. Clim., 36, 3717-3735, doi:10.1175/jcli-d-22-0631.1.
- Harvey, B., E. Hawkins, and R. Sutton, 2023: Storylines for future changes of the North Atlantic jet and associated impacts on the UK. International Journal of Climatology, 43, 4424-4441, doi:10.1002/joc.8095.
- Hawkins, E., and Coauthors, 2023: Rescuing historical weather observations improves quantification of severewindstorm risks. Natural Hazards and Earth System Sciences, 23, 1465-1482, doi:10.5194/nhess-23-1465-2023.
- Hiraga, Y., Y. Iseri, M. D. Warner, C. D. Frans, A. M. Duren, J. F. England, and M. L. Kavvas, 2023: Comparison of Model-Based Precipitation Maximization Methods: Moisture Optimization Method, Storm Transposition Method, and Their Combination. J Hydrol Eng, 28, doi:10.1061/(asce)he.1943-5584.0002234.
- Hong, X., L. Hu, and A. Kareem, 2023: A tropical cyclone intensity prediction model using conditional generative adversarial network. Journal of Wind Engineering and Industrial Aerodynamics, 240, doi:10.1016/j.jweia.2023.105515.
- Hörhold, M., and Coauthors, 2023: Modern temperatures in central-north Greenland warmest in past millennium. Nature, 613, 503-+, doi:10.1038/s41586-022-05517-z.
- Huo, W. J., Z. N. Xiao, and L. Zhao, 2023: Phase-Locked Impact of the 11-Year Solar Cycle on Tropical Pacific Decadal Variability. J. Clim., 36, 421-439, doi:10.1175/jcli-d-21-0595.1.
- Jahfer, S., K. J. Ha, C. L. E. Franzke, S. S. Lee, K. B. Rodgers, and D. E. Lee, 2023: Decoupling of Arctic variability from the North Pacific in a warmer climate. Npj Climate and Atmospheric Science, 6, doi:10.1038/s41612-023-00480-6.
- Ji, X. L., J. Feng, J. P. Li, and X. R. Chen, 2023: Relationship between the hadley circulation and tropical SST meridional structures under different thermal conditions in the indo-pacific warm pool. Frontiers in Marine Science, 9, doi:10.3389/fmars.2022.1088276.
- Jiang, L. S., T. Li, and Y. G. Ham, 2023: Asymmetric Impacts of El Nino and La Nina on Equatorial Atlantic Warming. J. Clim., 36, 193-212, doi:10.1175/jcli-d-22-0158.1.
- Jiang, Y. Y., J. Li, B. Wang, Y. M. Yang, and Z. W. Zhu, 2023: Weakening of decadal variation of Northern Hemisphere land monsoon rainfall under global warming. Npj Climate and Atmospheric Science, 6, doi:10.1038/s41612-023-00441-z.
- Jimenez, L. C. M., R. V. Andreoli, M. T. Kayano, R. A. F. de Souza, and W. L. Ceron, 2023: Multiyear versus single-year El Nino events: Contrasting their impacts on South American seasonal precipitation. International Journal of Climatology, doi:10.1002/joc.8186.
- Jung, C. S. P., and D. Schindler, 2023: Comprehensive validation of 68 wind speed models highlights the benefits of ensemble approaches. Energy Conversion and Management, 286, doi:10.1016/j.enconman.2023.117012.
- King, J., K. J. Anchukaitis, K. Allen, T. Vance, and A. Hessl, 2023: Trends and variability in the Southern Annular Mode over the Common Era. Nature Communications, 14, doi:10.1038/s41467-023-37643-1.
- King, M. P., N. Keenlyside, and C. Li, 2023: ENSO teleconnections in terms of non-NAO and NAO atmospheric variability. Climate Dynamics, 61, 2717-2733, doi:10.1007/s00382-023-06697-8.
- Lang, Q., W. Zhao, W. P. Yu, M. G. Ma, Y. Xiao, Y. J. Huang, and L. C. Wang, 2023: An Iterative Method Initialized by ERA5 Reanalysis Data for All-Sky Downward Surface Shortwave Radiation Estimation Over Complex Terrain With MODIS Observations. Ieee T Geosci Remote, 61, doi:10.1109/tgrs.2023.3323033.
- Lee, R., L. Chen, and G. Ren, 2023: A comparison of East-Asia landfall tropical cyclone in recent reanalysis datasets--before and after satellite era. Frontiers in Earth Science, 10, doi:10.3389/feart.2022.1026945.
- Lei, T., and S. L. Li, 2023: The Role of Underlying Boundary Forcing in Shaping the Recent Decadal Change of Persistent Anomalous Activity over the Ural Mountains. Advances in Atmospheric Sciences, doi:10.1007/s00376-023-2365-6.
- Li, M. F., and Coauthors, 2023: Strength of the winter North Atlantic jet stream has deviated from its natural trend under anthropogenic warming. Geology, doi:10.1130/g51329.1.
- Li, Y. D., X. C. Li, J. Feng, Y. Zhou, W. Z. Wang, and Y. R. Hou, 2023: Uncertainties of ENSO-related Regional Hadley Circulation Anomalies within Eight Reanalysis Datasets. Advances in Atmospheric Sciences, doi:10.1007/s00376-023-3047-0.
- Liu, G., S. S. Peng, C. Huntingford, and Y. Xi, 2023: A new precipitation emulator (PREMU v1.0) for lower-complexity models. Geoscientific Model Development, 16, 1277-1296, doi:10.5194/gmd-16-1277-2023.
- Liu, L. B., and Coauthors, 2023: Increasingly negative tropical water-interannual CO2 growth rate coupling. Nature, 618, 755-+, doi:10.1038/s41586-023-06056-x.
- Liu, Y. L., X. G. Sun, and X. Q. Yang, 2023: Stage-dependent influence of PDO on interdecadal summer precipitation anomalies in eastern China. Climate Dynamics, 61, 2071-2084, doi:10.1007/s00382-023-06667-0.
- Lu, C. X., and Coauthors, 2023: TropNet: a deep spatiotemporal neural network for tropospheric delay modeling and forecasting. Journal of Geodesy, 97, doi:10.1007/s00190-023-01722-4.
- Luo, F. Y., J. Ying, T. Y. Liu, and D. K. Chen, 2023: Origins of Southern Ocean warm sea surface temperature bias in CMIP6 models. Npj Climate and Atmospheric Science, 6, doi:10.1038/s41612-023-00456-6.
- Ma, X. G., and Coauthors, 2023: Large Uncertainties in Precipitation Exert Considerable Impact on Land Surface Temperature Modeling Over the Tibetan Plateau. Journal of Geophysical Research-Atmospheres, 128, doi:10.1029/2022jd037615.
- Minola, L., and Coauthors, 2023: The contribution of large-scale atmospheric circulation to variations of observed near-surface wind speed across Sweden since 1926. Climatic Change, 176, doi:10.1007/s10584-023-03525-0.
- O'Reilly, C. H., M. Patterson, J. Robson, P. A. Monerie, D. Hodson, and Y. Ruprich-Robert, 2023: Challenges with interpreting the impact of Atlantic Multidecadal Variability using SST-restoring experiments. Npj Climate and Atmospheric Science, 6, doi:10.1038/s41612-023-00335-0.
- Ojelabi, O., J. Hounkpè, K. O. Oluwasemire, and A. E. Lawin, 2023: Hydroclimatic trends, breakpoints and future projection analysis of the Ogun River Basin in West Africa. Water Practice and Technology, 18, 2023-2044, doi:10.2166/wpt.2023.137.
- Paik, S., and Coauthors, 2023: Impact of volcanic eruptions on extratropical atmospheric circulations: review, revisit and future directions. Environmental Research Letters, 18, doi:10.1088/1748-9326/acd5e6.
- Penserini, B. D., and Coauthors, 2023: Magnitude and timing of transient incision resulting from large-scale drainage capture, Sutlej River, Northwest Himalaya. Earth Surface Processes and Landforms, doi:10.1002/esp.5705.
- Piskala, V., and R. Huth, 2023: Identifying Shifts in Modes of Low-Frequency Circulation Variability Using the 20CR Renalysis Ensemble. J. Clim., 36, 7771-7783, doi:10.1175/jcli-d-22-0620.1.
- Rateb, S. A. A., A. Srivastava, and B. Zerouali, 2023: On the role of land-surface hydrology schemes in simulating the daily maximum and minimum air temperatures of Australia using a regional climate model (RegCM4). Journal of Water and Climate Change, 14, 989-1011, doi:10.2166/wcc.2023.512.
- Renard, B., 2023: Use of a national flood mark database to estimate flood hazard in the distant past. Hydrological Sciences Journal, 68, 1078-1094, doi:10.1080/02626667.2023.2212165.
- Renard, B., D. McInerney, S. Westra, M. Leonard, D. Kavetski, M. Thyer, and J. P. Vidal, 2023: Floods and Heavy Precipitation at the Global Scale: 100-Year Analysis and 180-Year Reconstruction. Journal of Geophysical Research-Atmospheres, 128, doi:10.1029/2022jd037908.
- Reynolds, C. A., and Coauthors, 2023: Impacts of Northeastern Pacific Buoy Surface Pressure Observations. Monthly Weather Review, 151, 211-226, doi:10.1175/mwr-d-22-0124.1.
- Rutllant, J. A., F. Matus, V. Rudloff, and R. Rondanelli, 2023: The role of atmospheric rivers in rainfall-induced landslides: A study from the Elqui valley. Journal of Arid Environments, 216, doi:10.1016/j.jaridenv.2023.105016.
- Salinger, M. J., and Coauthors, 2023: Coupled ocean-atmosphere summer heatwaves in the New Zealand region: an update. Weather and Climate, 42, 18-41, doi:Schneider, A., C. Zender, N. Loeb, and S. Price, 2023: Use of Shallow Ice Core Measurements to Evaluate and Constrain 1980-1990 Global Reanalyses of Ice Sheet Precipitation Rates. Geophysical Research Letters, 50, doi:10.1029/2023gl103943.
- Schurer, A. P., and Coauthors, 2023: Quantifying the contribution of forcing and three prominent modes of variability to historical climate. Climate of the Past, 19, 943-957, doi:10.5194/cp-19-943-2023.
- Scussolini, P., and Coauthors, 2023: Modeled storm surge changes in a warmer world: the Last Interglacial. Climate of the Past, 19, 141-157, doi:10.5194/cp-19-141-2023.
- Si, D., and L. W. Yu, 2023: Impact of the Atlantic multidecadal variability on East Asian summer climate in idealized simulations. Atmospheric and Oceanic Science Letters, 16, doi:10.1016/j.aosl.2023.100399.
- Souza, I. P., R. V. Andreoli, M. T. Kayano, W. L. Ceron, R. A. F. Souza, and I. Roy, 2023: Interdecadal Pacific Oscillation modulation of ENSO teleconnections in its decaying stages: Relations with Indian Ocean basin-wide mode and South American precipitation. International Journal of Climatology, 43, 3264-3283, doi:10.1002/joc.8028.
- Stübner, K., G. Balco, and N. Schmeisser, 2023: RIVERSAND: A NEW TOOL FOR EFFICIENT COMPUTATION OF CATCHMENTWIDE EROSION RATES. Radiocarbon, doi:10.1017/rdc.2023.74.
- Su, Y. B., J. A. Smith, and G. Villarini, 2023: Extreme Convective Rainfall and Flooding from Winter Season Extratropical Cyclones in the Mid-Atlantic Region of the United States. Journal of Hydrometeorology, 24, 497-520, doi:10.1175/jhm-d-22-0069.1.
- Su, Y. B., J. A. Smith, and G. Villarini, 2023: The Hydrometeorology of Extreme Floods in the Lower Mississippi River. Journal of Hydrometeorology, 24, 203-219, doi:10.1175/jhm-d-22-0024.1.
- Szuwalski, C. S., and Coauthors, 2023: Unintended consequences of climate-adaptive fisheries management targets. Fish and Fisheries, 24, 439-453, doi:10.1111/faf.12737.
- Teleti, P., E. Hawkins, and K. R. Wood, 2023: Digitizing weather observations from World War II US naval ship logbooks. Geoscience Data Journal, doi:10.1002/gdj3.222.
- Topál, D., and Q. H. Ding, 2023: Atmospheric circulation-constrained model sensitivity recalibrates Arctic climate projections. Nature Climate Change, 13, 710-+, doi:10.1038/s41558-023-01698-1.
- Tu'uholoaki, M., A. Espejo, K. K. Sharma, A. Singh, M. Wandres, H. Damlamian, and S. Chand, 2023: Influence of the Madden-Julian Oscillation (MJO) on Tropical Cyclones Affecting Tonga in the Southwest Pacific. Atmosphere, 14, doi:10.3390/atmos14071189.
- Vasil'ev, D. Y., V. A. Semenov, and A. A. Chibilev, 2023: Climatic Changes of the Temperature Regime on the Territory of Russia in the 20th and Early 21st Centuries. Geography and Natural Resources, 44, 99-106, doi:10.1134/s1875372823020130.
- Vellalassery, A., G. Baumgarten, M. Grygalashvyly, and F. J. Lübken, 2023: Greenhouse gas effects on the solar cycle response of water vapour andnoctilucent clouds. Annales Geophysicae, 41, 289-300, doi:10.5194/angeo-41-289-2023.
- Viorica, N., R. Catalin-Constantin, M. Andrei, S. Marian-Ionut, P. Ionel, and I. Monica, 2023: The first tree-ring reconstrruction of streamflow variability over the last-250 years in the Lower Danube. Journal of Hydrology, 617, doi:10.1016/j.jhydrol.2023.129150.
- Wang, B., and Coauthors, 2023: Understanding the recent increase in multiyear La Niñas. Nature Climate Change, doi:10.1038/s41558-023-01801-6.
- Wang, Y. C., W. L. Tseng, Y. L. Chen, S. Y. Lee, H. H. Hsu, and H. C. Liang, 2023: ENSO statistics, teleconnections, and atmosphere-ocean coupling in theTaiwan Earth System Model version 1. Geoscientific Model Development, 16, 4599-4616, doi:10.5194/gmd-16-4599-2023.
- Weickmann, K., E. Berry, V. Gensini, D. Gold, and T. Petroski, 2023: Changes in the Global Climate: Atmospheric Angular Momentum and Pacific Ocean Temperatures. J. Clim., 36, 6597-6611, doi:10.1175/jcli-d-22-0322.1.
- Xu, C. Q., C. Liu, Y. B. Yao, Q. Wang, and X. Q. Wang, 2023: Tibetan zenith wet delay model with refined vertical correction. Journal of Geodesy, 97, doi:10.1007/s00190-023-01719-z.
- Xue, M. R., and T. Li, 2023: To what extent does ENSO rectify the tropical Pacific mean state? Climate Dynamics, doi:10.1007/s00382-023-06750-6.
- Yang, Y., Q. L. You, Z. Y. Zuo, Y. Q. Zhang, Z. Liu, S. C. Kang, and P. M. Zhai, 2023: Elevation dependency of temperature trend over the Qinghai-Tibetan Plateau during 1901-2015. Atmospheric Research, 290, doi:10.1016/j.atmosres.2023.106791.
- Yeasmin, A., S. Chand, and N. Sultanova, 2023: Tropical cyclones and depressions over the South Pacific Ocean since the late 19th century: Assessing synergistic relationship between the El Nino Southern Oscillation and Interdecadal Pacific Oscillation. International Journal of Climatology, 43, 5422-5443, doi:10.1002/joc.8154.
- Yeasmin, A., S. Chand, and N. Sultanova, 2023: Reconstruction of tropical cyclone and depression proxies for the South Pacific since the 1850s. Weather and Climate Extremes, 39, doi:10.1016/j.wace.2022.100543.
- Yilmaz, F., M. Tsamados, and D. Osborn, 2023: Digitizing Ottoman daily weather observations of Halkali Agricultural School in Istanbul, Turkiye (1896-1917). Geoscience Data Journal, doi:10.1002/gdj3.205.
- Yu, J. H., T. M. Li, and L. S. Jiang, 2023: Why Does a Stronger El Nino Favor Developing towards the Eastern Pacific while a Stronger La Nina Favors Developing towards the Central Pacific? Atmosphere, 14, doi:10.3390/atmos14071185.
- Yu, L. W., and Coauthors, 2023: Tibetan Plateau Booster Effect on the Influence of Atlantic Multidecadal Variability on the East Asian Summer Rainfall. J. Clim., 36, 3437-3452, doi:10.1175/jcli-d-22-0472.1.
- Yule, E. L., G. Hegerl, A. Schurer, and E. Hawkins, 2023: Using early extremes to place the 2022 UK heat waves into historical context. Atmospheric Science Letters, 24, doi:10.1002/asl.1159.
- Zhang, S. Q., and Coauthors, 2023: Changes in the mean and extreme temperature in the Yangtze River Basin over the past 120 years. Weather and Climate Extremes, 40, doi:10.1016/j.wace.2023.100557.
- Zhang, W. Y., J. Zeng, Y. T. Wang, Y. Z. Wang, and B. J. Huai, 2023: Capability of multi-reanalyses to represent precipitation over the Greenland Ice Sheet. Atmospheric Research, 284, doi:10.1016/j.atmosres.2022.106598.
- Altmann, M., and Coauthors, 2023: Quantitative Long-Term Monitoring (1890-2020) of Morphodynamic and Land-Cover Changes of a LIA Lateral Moraine Section. Geosciences, 13, doi:10.3390/geosciences13040095.
- Anderson, T. G., K. A. McKinnon, D. Pons, and K. J. Anchukaitis, 2023: How Exceptional Was the 2015-2019 Central American Drought? Geophysical Research Letters, 50, doi:10.1029/2023gl105391.
- Andree, E., J. Su, M. A. D. Larsen, M. Drews, M. Stendel, and K. S. Madsen, 2023: The role of preconditioning for extreme storm surges in the western Baltic Sea. Natural Hazards and Earth System Sciences, 23, 1817-1834, doi:10.5194/nhess-23-1817-2023.
- Badescu, V., N. Rotar, A. Dumitrescu, C. Oprea, and M. Paulescu, 2023: Solar global irradiance from actinometric degree data for Montsouris (Paris) 1873-1877. Theoretical and Applied Climatology, 153, 539-559, doi:10.1007/s00704-023-04485-2.
- Berezowski, T., and M. Wassen, 2023: Using water sources extent during inundation as a reliable predictor for vegetation zonation in a natural wetland floodplain. Ecological Indicators, 154, doi:10.1016/j.ecolind.2023.110854.
- Brierley, C., K. Thirumalai, E. Grindrod, and J. Barnsley, 2023: Indian Ocean variability changes in the Paleoclimate Modelling Intercomparison Project. Climate of the Past, 19, 681-701, doi:10.5194/cp-19-681-2023.
- Brönnimann, S., 2023: Evolution of total column ozone prior to the era of ozone depletion. Frontiers in Earth Science, 11, doi:10.3389/feart.2023.1079510.
- Brönnimann, S., and Y. Brugnara, 2023: The weather diaries of the Kirch family: Leipzig, Guben, and Berlin (1677-1774). Climate of the Past, 19, 1435-1445, doi:10.5194/cp-19-1435-2023.
- Brugnara, Y., S. Brönnimann, S. Grab, J. Steinkopf, A. M. Burgdorf, C. Wilkinson, and R. Allan, 2023: South African extreme weather during the 1877-1878 El Niño. Weather, 78, 286-293, doi:10.1002/wea.4468.
- Bui, T. Q., D. Lafarga, T. M. Smith, Y. T. Song, and S. S. P. Shen, 2023: Calculation, visualization, and interpretation of three-dimensional atmosphere-ocean coupled empirical orthogonal functions using the reanalyses data. Theoretical and Applied Climatology, 154, 59-73, doi:10.1007/s00704-023-04513-1.
- Cai, Z. Y., and Coauthors, 2023: Interdecadal variability of the warm Arctic-cold Eurasia pattern linked to the Barents oscillation. Atmospheric Research, 287, doi:10.1016/j.atmosres.2023.106712.
- Chang, M. H., C. H. Ho, J. H. Ho, and E. J. Cha, 2023: Centennial analysis in tropical cyclone-induced precipitation in Korea. Weather and Climate Extremes, 39, doi:10.1016/j.wace.2023.100549.
- Chemke, R., and J. Yuval, 2023: Human-induced weakening of the Northern Hemisphere tropical circulation. Nature, 617, 529-+, doi:10.1038/s41586-023-05903-1.
- Chen, Q. M., and Coauthors, 2023: Weakening of the Summer Monsoon Over the Past 150 Years Shown by a Tree-Ring Record From Shandong, Eastern China, and the Potential Role of North Atlantic Climate. Paleoceanography and Paleoclimatology, 38, doi:10.1029/2022pa004495.
- Chen, W. H., and Coauthors, 2023: Increased tropical South Pacific western boundary current transport over the past century. Nature Geoscience, 16, 590-+, doi:10.1038/s41561-023-01212-4.
- Chen, Y., and Coauthors, 2023: Weakened western Pacific teleconnection pattern caused a decrease in spring persistent rainfall in north of 26 °N over Southeast China. International Journal of Climatology, 43, 4337-4346, doi:10.1002/joc.8090.
- Christidis, N., D. Mitchell, and P. A. Stott, 2023: Rapidly increasing likelihood of exceeding 50 °C in parts of the Mediterranean and the Middle East due to human influence. Npj Climate and Atmospheric Science, 6, doi:10.1038/s41612-023-00377-4.
- Churakova, O. V., and Coauthors, 2023: Climate impacts on tree-ring stable isotopes across the Northern Hemispheric boreal zone. Science of the Total Environment, 870, doi:10.1016/j.scitotenv.2023.161644.
- Cornes, R. C., P. D. Jones, T. Brandsma, D. Cendrier, and S. Jourdain, 2023: The London, Paris and De Bilt sub-daily pressure series. Geoscience Data Journal, doi:10.1002/gdj3.226.
- Dalelane, C., K. Winderlich, and A. Walter, 2023: Evaluation of global teleconnections in CMIP6 climate projections using complex networks. Earth System Dynamics, 14, 17-37, doi:10.5194/esd-14-17-2023.
- Dangendorf, S., and Coauthors, 2023: Acceleration of US Southeast and Gulf coast sea-level rise amplified by internal climate variability. Nature Communications, 14, doi:10.1038/s41467-023-37649-9.
- Dong, J. J., L. Y. Sun, J. A. Carton, and S. G. Penny, 2023: Improvements of Lagrangian Data Assimilation Tested in the Gulf of Mexico. Monthly Weather Review, 151, 1927-1936, doi:10.1175/mwr-d-22-0202.1.
- Dooley, K., and Coauthors, 2023: Reassessing long-standing meteorological records: an example using thenational hottest day in Ireland. Climate of the Past, 19, 1-22, doi:10.5194/cp-19-1-2023.
- Fallah, B., E. Russo, C. Menz, P. Hoffmann, I. Didovets, and F. F. Hattermann, 2023: Anthropogenic influence on extreme temperature and precipitation in Central Asia. Scientific Reports, 13, doi:10.1038/s41598-023-33921-6.
- Faranda, D., S. Pascale, and B. Bulut, 2023: Persistent anticyclonic conditions and climate change exacerbated the exceptional 2022 European-Mediterranean drought. Environmental Research Letters, 18, doi:10.1088/1748-9326/acbc37.
- Fu, D., P. Chang, and X. Liu, 2023: Using Convolutional Neural Network to Emulate Seasonal Tropical Cyclone Activity. Journal of Advances in Modeling Earth Systems, 15, doi:10.1029/2022ms003596.
- Gbode, I. E., T. E. Babalola, G. T. Diro, and J. D. Intsiful, 2023: Assessment of ERA5 and ERA-Interim in Reproducing Mean and Extreme Climates over West Africa. Advances in Atmospheric Sciences, 40, 570-586, doi:10.1007/s00376-022-2161-8.
- Godoy, M. R. V., and Y. Markonis, 2023: pRecipe: A global precipitation climatology toolbox and database. Environmental Modelling & Software, 165, doi:10.1016/j.envsoft.2023.105711.
- Godoy, M. R. V., and Y. Markonis, 2023: Water cycle changes in reanalyses: a complementary framework. Scientific Reports, 13, doi:10.1038/s41598-023-31873-5.
- Gore, M. J., C. M. Zarzycki, and M. M. Gervais, 2023: Connecting Large-Scale Meteorological Patterns to Extratropical Cyclones in CMIP6 Climate Models Using Self-Organizing Maps. Earths Future, 11, doi:10.1029/2022ef003211.
- Gorokhovsky, E., and J. L. Anderson, 2023: Extending ensemble Kalman filter algorithms to assimilate observations with an unknown time offset. Nonlinear Proc Geoph, 30, 37-47, doi:10.5194/npg-30-37-2023.
- Grooms, I., 2023: Two Methods for Data Assimilation of Wind Direction. Tellus Series a-Dynamic Meteorology and Oceanography, 75, 145-158, doi:10.16993/tellusa.2005.
- Hao, X., H. J. Wang, B. T. Zhou, J. D. Li, J. F. Wei, and T. T. Han, 2023: Ocean Surface Warming Pattern Inhibits El Nin?o-Induced Atmospheric Teleconnections. J. Clim., 36, 1521-1539, doi:10.1175/jcli-d-22-0275.1.
- Hawkins, E., and Coauthors, 2023: Rescuing historical weather observations improves quantification of severewindstorm risks. Natural Hazards and Earth System Sciences, 23, 1465-1482, doi:10.5194/nhess-23-1465-2023.
- He, C. F., A. C. Clement, S. M. Kramer, M. A. Cane, J. M. Klavans, T. M. Fenske, and L. N. Murphy, 2023: Tropical Atlantic multidecadal variability is dominated by external forcing. Nature, doi:10.1038/s41586-023-06489-4.
- He, Y. J., and Coauthors, 2023: Constraint of Air-Sea Interaction Significant to Skillful Predictions of North Pacific Climate Variations. J. Clim., 36, 5941-5962, doi:10.1175/jcli-d-22-0635.1.
- He, Y. J., B. Wang, L. J. Li, J. J. Liu, Y. Wang, and F. F. Li, 2023: Role of Ocean Initialization in Skillful Prediction of Sahel Rainfall on the Decadal Time Scale. J. Clim., 36, 2109-2129, doi:10.1175/jcli-d-21-0729.1.
- Heidemann, H., T. Cowan, B. J. Henley, J. Ribbe, M. Freund, and S. Power, 2023: Variability and long-term change in Australian monsoon rainfall: A review. Wiley Interdisciplinary Reviews-Climate Change, doi:10.1002/wcc.823.
- Herceg-Bulic, I., S. Ivasic, and M. Popovic, 2023: Impact of tropical SSTs on the late-winter signal over the North Atlantic-European region and contribution of midlatitude Atlantic. Npj Climate and Atmospheric Science, 6, doi:10.1038/s41612-023-00493-1.
- Hoell, A., T. Magadzire, A. McNally, and J. Eischeid, 2023: Multiyear dry periods in Southern Africa. International Journal of Climatology, 43, 3225-3246, doi:10.1002/joc.8026.
- Hörhold, M., and Coauthors, 2023: Modern temperatures in central-north Greenland warmest in past millennium. Nature, 613, 503-+, doi:10.1038/s41586-022-05517-z.
- Imfeld, N., L. Pfister, Y. Brugnara, and S. Broennimann, 2023: A 258-year-long data set of temperature and precipitation fields for Switzerland since 1763. Climate of the Past, 19, 703-729, doi:10.5194/cp-19-703-2023.
- Jebri, B., and M. Khodri, 2023: Large Ensemble Particle Filter for Spatial Climate Reconstructions Using a Linear Inverse Model. Journal of Advances in Modeling Earth Systems, 15, doi:10.1029/2022ms003094.
- Jiang, K., Y. Wang, Y. Sun, and J. Lan, 2023: The seasonal variation of shallow meridional overturning circulation in the South China Sea and the related dynamics. Ocean Modelling, 186, doi:10.1016/j.ocemod.2023.102242.
- Josey, S. A., J. P. Grist, J. V. Mecking, B. I. Moat, and E. Schulz, 2023: A clearer view of Southern Ocean air-sea interaction using surface heat flux asymmetry. Philosophical Transactions of the Royal Society a-Mathematical Physical and Engineering Sciences, 381, doi:10.1098/rsta.2022.0067.
- Josey, S. A., and K. Schroeder, 2023: Declining winter heat loss threatens continuing ocean convection at a Mediterranean dense water formation site. Environmental Research Letters, 18, doi:10.1088/1748-9326/aca9e4.
- Keizer, I., D. Le Bars, C. de Valk, A. Jüling, R. van de Wal, and S. Drijfhout, 2023: The acceleration of sea-level rise along the coast of the Netherlands started in the 1960s. Ocean Science, 19, 991-1007, doi:10.5194/os-19-991-2023.
- Kendon, M., M. McCarthy, S. Jevrejeva, A. Matthews, J. Williams, T. Sparks, and F. West, 2023: State of the UK Climate 2022. International Journal of Climatology, 43, 1-82, doi:10.1002/joc.8167.
- King, J., K. J. Anchukaitis, K. Allen, T. Vance, and A. Hessl, 2023: Trends and variability in the Southern Annular Mode over the Common Era. Nature Communications, 14, doi:10.1038/s41467-023-37643-1.
- Klotzbach, P. J., C. J. Schreck, G. P. Compo, K. M. Wood, E. C. J. Oliver, S. G. Bowen, and M. M. Bell, 2023: Influence of the Madden-Julian Oscillation on Continental United States Hurricane Landfalls. Geophysical Research Letters, 50, doi:10.1029/2023gl102762.
- Kolbe, M., R. Bintanja, and E. C. van der Linden, 2023: Seasonal and regional contrasts of future trends in interannual arctic climate variability. Climate Dynamics, doi:10.1007/s00382-023-06766-y.
- Lee, R., L. Chen, and G. Ren, 2023: A comparison of East-Asia landfall tropical cyclone in recent reanalysis datasets--before and after satellite era. Frontiers in Earth Science, 10, doi:10.3389/feart.2022.1026945.
- Li, D. L., Y. Chen, J. F. Qi, Y. C. Zhu, C. H. Lu, and B. S. Yin, 2023: Attribution of the July 2021 Record-Breaking Northwest Pacific Marine Heatwave to Global Warming, Atmospheric Circulation, and ENSO. Bulletin of the American Meteorological Society, 104, E291-E297, doi:10.1175/bams-d-22-0142.1.
- Li, M., G. W. Wang, F. Q. Cao, S. W. Zong, and X. R. Chai, 2023: Determining optimal probability distributions for gridded precipitation data based on L-moments. Science of the Total Environment, 882, doi:10.1016/j.scitotenv.2023.163528.
- Little, C. M., 2023: Coastal Sea Level Observations Record the Twentieth-Century Enhancement of Decadal Climate Variability. J. Clim., 36, 243-260, doi:10.1175/jcli-d-22-0451.1.
- Lou, J. L., M. Newman, and A. Hoell, 2023: Multi-decadal variation of ENSO forecast skill since the late 1800s. Npj Climate and Atmospheric Science, 6, doi:10.1038/s41612-023-00417-z.
- Lundstad, E., and Coauthors, 2023: The global historical climate database HCLIM. Scientific Data, 10, doi:10.1038/s41597-022-01919-w.
- Montero-Martín, J., M. Antón, J. M. Vaquero, R. Román, J. Vaquero-Martinez, A. J. P. Aparicio, and A. Sanchez-Lorenzo, 2023: Reconstruction of daily global solar radiation under all-sky and cloud-free conditions in Badajoz (Spain) since 1929. International Journal of Climatology, 43, 3523-3537, doi:10.1002/joc.8042.
- Morineau, C., Y. Boulanger, P. Gachon, S. Plante, and M. H. St-Laurent, 2023: Climate change alone cannot explain boreal caribou range recession in Quebec since 1850. Global Change Biology, doi:10.1111/gcb.16949.
- Muñoz, S. E., B. Hamilton, and B. Parazin, 2023: Contrasting Ocean-Atmosphere Dynamics Mediate Flood Hazard across the Mississippi River Basin. Earth Interactions, 27, doi:10.1175/ei-d-22-0015.1.
- O'Reilly, C. H., M. Patterson, J. Robson, P. A. Monerie, D. Hodson, and Y. Ruprich-Robert, 2023: Challenges with interpreting the impact of Atlantic Multidecadal Variability using SST-restoring experiments. Npj Climate and Atmospheric Science, 6, doi:10.1038/s41612-023-00335-0.
- Park, J. H., and Coauthors, 2023: Distinct decadal modulation of Atlantic-Nino influence on ENSO. Npj Climate and Atmospheric Science, 6, doi:10.1038/s41612-023-00429-9.
- Peng, S. L., C. Y. Wang, Z. Li, K. Mihara, K. Kuramochi, Y. Toma, and R. Hatano, 2023: Climate change multi-model projections in CMIP6 scenarios in Central Hokkaido, Japan. Scientific Reports, 13, doi:10.1038/s41598-022-27357-7.
- Peng, T. T., and Coauthors, 2023: Changes in Temperature-Precipitation Compound Extreme Events in China During the Past 119 Years. Earth and Space Science, 10, doi:10.1029/2022ea002777.
- Piskala, V., and R. Huth, 2023: Identifying Shifts in Modes of Low-Frequency Circulation Variability Using the 20CR Renalysis Ensemble. J. Clim., 36, 7771-7783, doi:10.1175/jcli-d-22-0620.1.
- Rateb, S. A. A., A. Srivastava, and B. Zerouali, 2023: On the role of land-surface hydrology schemes in simulating the daily maximum and minimum air temperatures of Australia using a regional climate model (RegCM4). Journal of Water and Climate Change, 14, 989-1011, doi:10.2166/wcc.2023.512.
- Renard, B., D. McInerney, S. Westra, M. Leonard, D. Kavetski, M. Thyer, and J. P. Vidal, 2023: Floods and Heavy Precipitation at the Global Scale: 100-Year Analysis and 180-Year Reconstruction. Journal of Geophysical Research-Atmospheres, 128, doi:10.1029/2022jd037908.
- Saha, P., R. Mahanta, and B. N. Goswami, 2023: Present and future of the South Asian summer monsoon's rainy season over Northeast India. Npj Climate and Atmospheric Science, 6, doi:10.1038/s41612-023-00485-1.
- Sandhya, M., and S. Sridharan, 2023: On drastic change in the relationship between snow cover and Indian monsoon rainfall. Journal of Earth System Science, 132, doi:10.1007/s12040-023-02115-z.
- Schurer, A. P., and Coauthors, 2023: Quantifying the contribution of forcing and three prominent modes of variability to historical climate. Climate of the Past, 19, 943-957, doi:10.5194/cp-19-943-2023.
- Schwertfeger, B. T., G. Lohmann, and H. Lipskoch, 2023: Introduction of the BiasAdjustCXX command-line tool for the application of fast and efficient bias corrections in climatic research. Softwarex, 22, doi:10.1016/j.softx.2023.101379.
- Shu, Q., Y. Zhang, D. J. A. Maya, S. M. Larson, Y. U. Kosaka, J. C. Yang, and X. P. Lin, 2023: Role of Ocean Advections during the Evolution of the Pacific Meridional Modes. J. Clim., 36, 4327-4343, doi:10.1175/jcli-d-22-0296.1.
- Stone, L., C. Strong, H. S. L. Bai, T. Reichler, G. McCabe, and P. D. Brooks, 2023: Atlantic-Pacific influence on western U.S. hydroclimate and water resources. Npj Climate and Atmospheric Science, 6, doi:10.1038/s41612-023-00471-7.
- Su, Y. B., J. A. Smith, and G. Villarini, 2023: Extreme Convective Rainfall and Flooding from Winter Season Extratropical Cyclones in the Mid-Atlantic Region of the United States. Journal of Hydrometeorology, 24, 497-520, doi:10.1175/jhm-d-22-0069.1.
- Su, Y. B., J. A. Smith, and G. Villarini, 2023: The Hydrometeorology of Extreme Floods in the Lower Mississippi River. Journal of Hydrometeorology, 24, 203-219, doi:10.1175/jhm-d-22-0024.1.
- Sueki, S., A. Ishii, S. Coppieters, and A. Yamanaka, 2023: Inverse characterization of a material model using an ensemble-based four-dimensional variational method. International Journal of Solids and Structures, 279, doi:10.1016/j.ijsolstr.2023.112350.
- Taylor, L. M., and G. J. Hakim, 2023: Skillful Coupled Atmosphere-Ocean Forecasts on Interannual to Decadal Timescales Using a Linear Inverse Model. Earth and Space Science, 10, doi:10.1029/2022ea002679.
- Teleti, P., E. Hawkins, and K. R. Wood, 2023: Digitizing weather observations from World War II US naval ship logbooks. Geoscience Data Journal, doi:10.1002/gdj3.222.
- Terao, T., and Coauthors, 2023: AsiaPEX Challenges and Prospects in Asian Precipitation Research. Bulletin of the American Meteorological Society, 104, E884-E908, doi:10.1175/bams-d-20-0220.1.
- Terray, L., 2023: A Storyline Approach to the June 2021 Northwestern North American Heatwave. Geophysical Research Letters, 50, doi:10.1029/2022gl101640.
- Vaideanu, P., C. Stepanek, M. Dima, J. Schrepfer, F. Matos, M. Ionita, and G. Lohmann, 2023: Large-scale sea ice-Surface temperature variability linked to Atlantic meridional overturning circulation. Plos One, 18, doi:10.1371/journal.pone.0290437.
- Veiga, S. F., and Coauthors, 2023: Climate change over South America simulated by the Brazilian Earth system model under RCP4.5 and RCP8.5 scenarios. Journal of South American Earth Sciences, 131, doi:10.1016/j.jsames.2023.104598.
- Viorica, N., R. Catalin-Constantin, M. Andrei, S. Marian-Ionut, P. Ionel, and I. Monica, 2023: The first tree-ring reconstrruction of streamflow variability over the last-250 years in the Lower Danube. Journal of Hydrology, 617, doi:10.1016/j.jhydrol.2023.129150.
- Wang, H., Z. G. Li, J. P. Li, X. P. Lin, X. T. Zheng, L. Fan, and Y. Zhang, 2023: Interannual variation in the East Asian summer monsoon-tropical Atlantic SST relationship modulated by the Interdecadal Pacific Oscillation. Npj Climate and Atmospheric Science, 6, doi:10.1038/s41612-023-00497-x.
- Wang, H., K. F. Yu, T. Han, S. D. Xu, S. C. Tao, S. H. Dang, and X. P. Yu, 2023: Orbital-Insolation Controlled Porites Coral d13C Seasonality Variations Since the Mid-Holocene in the Northern South China Sea. Geophysical Research Letters, 50, doi:10.1029/2022gl101284.
- Wang, X., R. Y. Lu, and X. W. Hong, 2023: Weakening of the Silk Road Pattern in August after the Mid-1990s. J. Clim., 36, 4275-4286, doi:10.1175/jcli-d-22-0762.1.
- Wang, X. L., Y. Feng, V. Y. S. Cheng, and H. Xu, 2023: Observed Precipitation Trends Inferred from Canada's Homogenized Monthly Precipitation Dataset. J. Clim., 36, 7957-7971, doi:10.1175/JCLI-D-23-0193.s1.
- Wang, Y. G., X. R. Wu, L. P. Jiang, F. Zheng, and S. Brune, 2023: Editorial: Recent advances in climate reanalysis. Frontiers in Climate, 5, doi:10.3389/fclim.2023.1158244.
- Wegmann, M., and F. Jaume-Santero, 2023: Artificial intelligence achieves easy-to-adapt nonlinear global temperature reconstructions using minimal local data. Communications Earth & Environment, 4, doi:10.1038/s43247-023-00872-9.
- Williams, S. L., and Coauthors, 2023: Relative sea-level changes in southeastern Australia during the 19th and 20th centuries. Journal of Quaternary Science, 38, 1184-1201, doi:10.1002/jqs.3528.
- Wu, C. H., S. Y. Lee, I. C. Tsai, C. J. Shiu, and Y. Y. Chen, 2023: Volcanic contribution to the 1990s North Pacific climate shift in winter. Scientific Reports, 13, doi:10.1038/s41598-023-32956-z.
- Xavier, A. K., H. Varikoden, C. A. Babu, and T. Reshma, 2023: Influence of PDO and ENSO with Indian summer monsoon rainfall and its changing relationship before and after 1976 climate shift. Climate Dynamics, doi:10.1007/s00382-023-06865-w.
- Xiang, B. Q., S. P. Xie, S. M. Kang, and R. J. Kramer, 2023: An emerging Asian aerosol dipole pattern reshapes the Asian summer monsoon and exacerbates northern hemisphere warming. Npj Climate and Atmospheric Science, 6, doi:10.1038/s41612-023-00400-8.
- Yao, S. L., J. J. Luo, P. S. Chu, and F. Zheng, 2023: Decadal variations of Pacific Walker circulation tied to tropical Atlantic-Pacific trans-basin SST gradients. Environmental Research Letters, 18, doi:10.1088/1748-9326/acd12f.
- Yeasmin, A., S. Chand, and N. Sultanova, 2023: Reconstruction of tropical cyclone and depression proxies for the South Pacific since the 1850s. Weather and Climate Extremes, 39, doi:10.1016/j.wace.2022.100543.
- Zhou, L. M., W. J. Hua, S. E. Nicholson, and J. P. Clark, 2023: Interannual teleconnections in the Sahara temperatures associated with the North Atlantic Oscillation (NAO) during boreal winter. Climate Dynamics, doi:10.1007/s00382-023-06962-w.
- Abermann, J., and Coauthors, 2023: Learning from Alfred Wegener's pioneering field observations in West Greenland after a century of climate change. Scientific Reports, 13, doi:10.1038/s41598-023-33225-9.
- Alexandrov, G. A., V. A. Ginzburg, G. E. Insarov, and A. A. Romanovskaya, 2021: CMIP6 model projections leave no room for permafrost to persist in Western Siberia under the SSP5-8.5 scenario. Climatic Change, 169, doi:10.1007/s10584-021-03292-w.
- Anderson, T. G., K. A. McKinnon, D. Pons, and K. J. Anchukaitis, 2023: How Exceptional Was the 2015-2019 Central American Drought? Geophysical Research Letters, 50, doi:10.1029/2023gl105391.
- Baatz, R., and Coauthors, 2021: Reanalysis in Earth System Science: Toward Terrestrial Ecosystem Reanalysis. Reviews of Geophysics, 59, doi:10.1029/2020rg000715.
- Badescu, V., N. Rotar, A. Dumitrescu, C. Oprea, and M. Paulescu, 2023: Solar global irradiance from actinometric degree data for Montsouris (Paris) 1873-1877. Theoretical and Applied Climatology, 153, 539-559, doi:10.1007/s00704-023-04485-2.
- Biswas, S., S. S. Chand, A. J. Dowdy, W. Wright, C. Foale, X. H. Zhao, and A. Deo, 2022: Statistical Calibration of Long-Term Reanalysis Data for Australian Fire Weather Conditions. Journal of Applied Meteorology and Climatology, 61, 729-758, doi:10.1175/jamc-d-21-0034.1.
- Borhara, K., B. Fosu, and S. Y. S. Wang, 2023: The role of the western North Pacific (WNP) as an El Nino-Southern Oscillation (ENSO) precursor in a warmer future climate. Climate Dynamics, doi:10.1007/s00382-023-06773-z.
- Bourdeau-Goulet, S. C., and E. Hassanzadeh, 2021: Comparisons Between CMIP5 and CMIP6 Models: Simulations of Climate Indices Influencing Food Security, Infrastructure Resilience, and Human Health in Canada. Earths Future, 9, doi:10.1029/2021ef001995.
- Brönnimann, S., 2022: Historical Observations for Improving Reanalyses. Frontiers in Climate, 4, doi:10.3389/fclim.2022.880473.
- Brönnimann, S., and Coauthors, 2022: Influence of warming and atmospheric circulation changes on multidecadal European flood variability. Climate of the Past, 18, 919-933, doi:10.5194/cp-18-919-2022.
- Burt, S. D., 2023: A twice-daily barometric pressure record from Durham Observatory in north-east England, 1843-1960. Geoscience Data Journal, 10, 3-17, doi:10.1002/gdj3.135.
- Cai, Z. Y., and Coauthors, 2023: Interdecadal variability of the warm Arctic-cold Eurasia pattern linked to the Barents oscillation. Atmospheric Research, 287, doi:10.1016/j.atmosres.2023.106712.
- Cerón, W. L., M. T. Kayano, R. V. Andreoli, A. Avila-Diaz, I. P. de Souza, and R. A. F. Souza, 2021: Pacific and Atlantic Multidecadal Variability Relations with the Choco and Caribbean Low-Level Jets during the 1900-2015 Period. Atmosphere, 12, doi:10.3390/atmos12091120.
- Chen, Y. F., Y. Du, and Z. S. Chen, 2023: Indo-western Pacific Ocean capacitor events recorded by coral proxies in the South China Sea. Palaeogeography Palaeoclimatology Palaeoecology, 609, doi:10.1016/j.palaeo.2022.111315.
- Churakova, O. V., and Coauthors, 2023: Climate impacts on tree-ring stable isotopes across the Northern Hemispheric boreal zone. Science of the Total Environment, 870, doi:10.1016/j.scitotenv.2023.161644.
- Crossett, C. C., L. A. L. Dupigny-Giroux, K. E. Kunkel, A. K. Betts, and A. Bomblies, 2023: Synoptic Typing of Multiduration, Heavy Precipitation Records in the Northeastern United States: 1895-2017. Journal of Applied Meteorology and Climatology, 62, 721-736, doi:10.1175/jamc-d-22-0091.1.
- Engdaw, M. M., A. K. Steiner, G. C. Hegerl, and A. P. Ballinger, 2023: Attribution of observed changes in extreme temperatures to anthropogenic forcing using CMIP6 models. Weather and Climate Extremes, 39, doi:10.1016/j.wace.2023.100548.
- Fallah, B., E. Russo, C. Menz, P. Hoffmann, I. Didovets, and F. F. Hattermann, 2023: Anthropogenic influence on extreme temperature and precipitation in Central Asia. Scientific Reports, 13, doi:10.1038/s41598-023-33921-6.
- Fan, Y. F., W. Liu, P. F. Zhang, R. Chen, and L. F. Li, 2023: North Atlantic Oscillation contributes to the subpolar North Atlantic cooling in the past century. Climate Dynamics, doi:10.1007/s00382-023-06847-y.
- Fox-Hughes, P., and Coauthors, 2022: A review of early severe weather applications of high-resolution regional reanalysis in Australia. Meteorological Applications, 29, doi:10.1002/met.2087.
- Gergis, J., Z. Baillie, S. Ingallina, L. Ashcroft, and T. Ellwood, 2021: A historical climate dataset for southwestern Australia, 1830-1875. International Journal of Climatology, 41, 4898-4919, doi:10.1002/joc.7105.
- Gillespie, I., L. Haimberger, G. P. Compo, and P. W. Thorne, 2023: Assessing homogeneity of land surface air temperature observations using sparse-input reanalyses. International Journal of Climatology, 43, 736-760, doi:10.1002/joc.7822.
- Ginzburg, A. S., G. A. Alexandrov, and A. V. Chernokulsky, 2022: Climatic Criteria of the Need for Preventive Adaptation. Izvestiya Atmospheric and Oceanic Physics, 58, 536-544, doi:10.1134/s0001433822060068.
- Godoy, M. R. V., and Y. Markonis, 2023: Water cycle changes in reanalyses: a complementary framework. Scientific Reports, 13, doi:10.1038/s41598-023-31873-5.
- Han, J., and V. P. Singh, 2021: Impacts of Rossby Wave Packets and Atmospheric Rivers on Meteorological Drought in the Continental United States. Water Resources Research, 57, doi:10.1029/2021wr029966.
- Harvey, B., E. Hawkins, and R. Sutton, 2023: Storylines for future changes of the North Atlantic jet and associated impacts on the UK. International Journal of Climatology, 43, 4424-4441, doi:10.1002/joc.8095.
- Hawkins, E., L. V. Alexander, and R. J. Allan, 2023: Millions of digitized historical sea-level pressure observations rediscovered. Geoscience Data Journal, 10, 385-395, doi:10.1002/gdj3.163.
- Hawkins, E., and Coauthors, 2023: Rescuing historical weather observations improves quantification of severewindstorm risks. Natural Hazards and Earth System Sciences, 23, 1465-1482, doi:10.5194/nhess-23-1465-2023.
- Horton, P., 2022: Analogue methods and ERA5: Benefits and pitfalls. International Journal of Climatology, 42, 4078-4096, doi:10.1002/joc.7484.
- Huang, J. Y., Q. X. Li, and Z. Y. Song, 2022: Historical global land surface air apparent temperature and its future changes based on CMIP6 projections. Science of the Total Environment, 816, doi:10.1016/j.scitotenv.2021.151656.
- Hyncica, M., and R. Huth, 2022: Temporal evolution of relationships between temperature and circulation modes in five reanalyses. International Journal of Climatology, 42, 4391-4404, doi:10.1002/joc.7474.
- Ionita, M., V. Nagavciuc, P. Scholz, and M. Dima, 2022: Long-term drought intensification over Europe driven by the weakening trend of the Atlantic Meridional Overturning Circulation. J Hydrol-Reg Stud, 42, doi:10.1016/j.ejrh.2022.101176.
- Karmalkar, A. V., and R. M. Horton, 2021: Drivers of exceptional coastal warming in the northeastern United States. Nature Climate Change, 11, 854-+, doi:10.1038/s41558-021-01159-7.
- Kettle, A. J., and C. Murphy, 2023: Deciphering extreme rainfall and historical floods at Easkey on the west coast of Ireland. Weather, doi:10.1002/wea.4452.
- Klotzbach, P. J., C. J. Schreck, G. P. Compo, K. M. Wood, E. C. J. Oliver, S. G. Bowen, and M. M. Bell, 2023: Influence of the Madden-Julian Oscillation on Continental United States Hurricane Landfalls. Geophysical Research Letters, 50, doi:10.1029/2023gl102762.
- Labe, Z. M., and E. A. Barnes, 2022: Comparison of Climate Model Large Ensembles With Observations in the Arctic Using Simple Neural Networks. Earth and Space Science, 9, doi:10.1029/2022ea002348.
- Lakkis, S. G., P. O. Canziani, J. O. Rodriquez, and A. E. Yuchechen, 2023: Early meteorological records from Corrientes and Bahia Blanca, Argentina: Initial ACRE-Argentina data rescue and related activities. Geoscience Data Journal, 10, 328-346, doi:10.1002/gdj3.176.
- Lieber, R., A. King, J. Brown, L. Ashcroft, M. Freund, and C. McMichael, 2022: ENSO Teleconnections More Uncertain in Regions of Lower Socioeconomic Development. Geophysical Research Letters, 49, doi:10.1029/2022gl100553.
- Lorrey, A. M., and Coauthors, 2022: Meteorological data rescue: Citizen science lessons learned from Southern Weather Discovery. Patterns, 3, doi:10.1016/j.patter.2022.100495.
- Lu, Z. C., T. B. Zhao, W. C. Zhou, and H. K. Zhao, 2022: Interdecadal Variation of the Antarctic Circumpolar Wave Based on the 20CRV3 Dataset. Atmosphere, 13, doi:10.3390/atmos13050736.
- Mahoney, K., C. McColl, D. M. Hultstrand, W. D. Kappel, B. McCormick, and G. P. Compo, 2022: Blasts from the Past Reimagining Historical Storms with Model Simulations to Modernize Dam Safety and Flood Risk Assessment. Bulletin of the American Meteorological Society, 103, E266-E280, doi:10.1175/bams-d-21-0133.1.
- Mo, R. P., 2022: Prequel to the Stories of Warm Conveyor Belts and Atmospheric Rivers The Moist Tongues Identified by Rossby and His Collaborators in the 1930s. Bulletin of the American Meteorological Society, 103, E1019-E1040, doi:10.1175/bams-d-20-0276.1.
- Morineau, C., Y. Boulanger, P. Gachon, S. Plante, and M. H. St-Laurent, 2023: Climate change alone cannot explain boreal caribou range recession in Quebec since 1850. Global Change Biology, doi:10.1111/gcb.16949.
- Nolin, A. F., M. P. Girardin, J. C. Tardif, X. J. Guo, F. Conciatori, and Y. Bergeron, 2022: A 247-year tree-ring reconstruction of spring temperature and relation to spring flooding in eastern boreal Canada. International Journal of Climatology, 42, 6479-6498, doi:10.1002/joc.7608.
- Pan, Z. T., S. Kumar, Y. J. Zhang, and C. H. Shi, 2022: Central Continental Boreal Summer "Warming Holes" Modulated by Atlantic Multidecadal Oscillation Via Low-Level Jets. Journal of Geophysical Research-Atmospheres, 127, doi:10.1029/2021jd035217.
- Pohl, B., A. Sturman, J. Renwick, H. Quénol, N. Fauchereau, A. Lorrey, and J. Pergaud, 2023: Precipitation and temperature anomalies over Aotearoa New Zealand analysed by weather types and descriptors of atmospheric centres of action. International Journal of Climatology, 43, 331-353, doi:10.1002/joc.7762.
- Przybylak, R., P. Wyszynski, and A. Arazny, 2022: Comparison of Early-Twentieth-Century Arctic Warming and Contemporary Arctic Warming in the Light of Daily and Subdaily Data. J. Clim., 35, 2269-2290, doi:10.1175/jcli-d-21-0162.1.
- Qiao, P. J., Z. Q. Gong, W. Q. Liu, Y. W. Zhang, G. L. Feng, and W. J. Dong, 2021: Extreme rainfall synchronization network between Southwest China and Asia-Pacific region. Climate Dynamics, 57, 3207-3221, doi:10.1007/s00382-021-05865-y.
- Reed, E. V., D. M. Thompson, and K. J. Anchukaitis, 2022: Coral-Based Sea Surface Salinity Reconstructions and the Role of Observational Uncertainties in Inferred Variability and Trends. Paleoceanography and Paleoclimatology, 37, doi:10.1029/2021pa004371.
- Reynolds, C. A., and Coauthors, 2023: Impacts of Northeastern Pacific Buoy Surface Pressure Observations. Monthly Weather Review, 151, 211-226, doi:10.1175/mwr-d-22-0124.1.
- Schurer, A. P., G. C. Hegerl, H. Goosse, M. A. Bollasina, M. H. England, D. M. Smith, and S. F. B. Tett, 2023: Role of multi-decadal variability of the winter North Atlantic Oscillation on Northern Hemisphere climate. Environmental Research Letters, 18, doi:10.1088/1748-9326/acc477.
- Shirley, I. A., and Coauthors, 2022: Near-Surface Hydrology and Soil Properties Drive Heterogeneity in Permafrost Distribution, Vegetation Dynamics, and Carbon Cycling in a Sub-Arctic Watershed. Journal of Geophysical Research-Biogeosciences, 127, doi:10.1029/2022jg006864.
- Viorica, N., R. Catalin-Constantin, M. Andrei, S. Marian-Ionut, P. Ionel, and I. Monica, 2023: The first tree-ring reconstrruction of streamflow variability over the last-250 years in the Lower Danube. Journal of Hydrology, 617, doi:10.1016/j.jhydrol.2023.129150.
- Wang, H., Z. G. Li, J. P. Li, X. P. Lin, X. T. Zheng, L. Fan, and Y. Zhang, 2023: Interannual variation in the East Asian summer monsoon-tropical Atlantic SST relationship modulated by the Interdecadal Pacific Oscillation. Npj Climate and Atmospheric Science, 6, doi:10.1038/s41612-023-00497-x.
- Wegmann, M., and F. Jaume-Santero, 2023: Artificial intelligence achieves easy-to-adapt nonlinear global temperature reconstructions using minimal local data. Communications Earth & Environment, 4, doi:10.1038/s43247-023-00872-9.
- Yang, Y., Q. X. Li, Z. Y. Song, W. B. Sun, and W. J. Dong, 2022: A comparison of global surface temperature variability, extremes and warming trend using reanalysis datasets and CMST-Interim. International Journal of Climatology, 42, 5609-5628, doi:10.1002/joc.7551.
- Yao, W. J., X. Q. Yan, Y. M. Tang, D. J. Yang, X. X. Tan, X. S. Song, and T. Liu, 2022: Multidecadal Variation in the Seasonal Predictability of Winter PNA and Its Sources. Geophysical Research Letters, 49, doi:10.1029/2022gl099393.
- Yilmaz, F., M. Tsamados, and D. Osborn, 2023: Digitizing Ottoman daily weather observations of Halkali Agricultural School in Istanbul, Turkiye (1896-1917). Geoscience Data Journal, doi:10.1002/gdj3.205.
- Yu, B., and Coauthors, 2022: Northern Hemisphere Extratropical Cyclone Activity in the Twentieth Century Reanalysis Version 3 (20CRv3) and Its Relationship with Continental Extreme Temperatures. Atmosphere, 13, doi:10.3390/atmos13081166.
- Yule, E. L., G. Hegerl, A. Schurer, and E. Hawkins, 2023: Using early extremes to place the 2022 UK heat waves into historical context. Atmospheric Science Letters, 24, doi:10.1002/asl.1159.
- Zaplotnik, Z., M. Pikovnik, and L. Boljka, 2022: Recent Hadley Circulation Strengthening: A Trend or Multidecadal Variability. J. Clim., 35, 4157-4176, doi:10.1175/jcli-d-21-0204.1.
2022
Compo et al. 2011- Anderson, G. B., A. Schumacher, and J. Done, 2022: Exposure Assessment for Tropical Cyclone Epidemiology. Current Environmental Health Reports, 9, 104-119, doi:10.1007/s40572-022-00333-z.
- Antico, A., and M. Vuille, 2022: ENSO and Parana flow variability: Long-term changes in their connectivity. International Journal of Climatology, 42, 7269-7279, doi:10.1002/joc.7643.
- Basharin, D., and G. Stankunavicius, 2022: European precipitation response to Indian ocean dipole events. Atmospheric Research, 273, doi:10.1016/j.atmosres.2022.106142.
- Birkel, S. D., P. A. Mayewski, L. B. Perry, A. Seimon, and M. Andrade-Flores, 2022: Evaluation of Reanalysis Temperature and Precipitation for the Andean Altiplano and Adjacent Cordilleras. Earth and Space Science, 9, doi:10.1029/2021ea001934.
- Biswas, S., S. S. Chand, A. J. Dowdy, W. Wright, C. Foale, X. H. Zhao, and A. Deo, 2022: Statistical Calibration of Long-Term Reanalysis Data for Australian Fire Weather Conditions. Journal of Applied Meteorology and Climatology, 61, 729-758, doi:10.1175/jamc-d-21-0034.1.
- Bliznak, V., L. Pokorna, and Z. Rulfova, 2022: Assessment of the capability of modern reanalyses to simulate precipitation in warm months using adjusted radar precipitation. J Hydrol-Reg Stud, 42, doi:10.1016/j.ejrh.2022.101121.
- Bokuchava, D. D., and V. A. Semenov, 2022: The role of natural fluctuations and factors of external forcing in the Early 20th Century Warming in Northern Hemisphere. Led I Sneg-Ice and Snow, 62, 455-474, doi:10.31857/s2076673422030144.
- Brönnimann, S., 2022: Historical Observations for Improving Reanalyses. Frontiers in Climate, 4, doi:10.3389/fclim.2022.880473.
- Callahan, C. W., and J. S. Mankin, 2022: National attribution of historical climate damages. Climatic Change, 172, doi:10.1007/s10584-022-03387-y.
- Chand, S. S., and Coauthors, 2022: Declining tropical cyclone frequency under global warming. Nature Climate Change, 12, 655-+, doi:10.1038/s41558-022-01388-4.
- Chen, H. C., and F. F. Jin, 2022: Dynamics of ENSO Phase-Locking and Its Biases in Climate Models. Geophysical Research Letters, 49, doi:10.1029/2021gl097603.
- Chen, K. F., and Coauthors, 2022: Modulating and Resetting Impacts of Different Volcanic Eruptions on North Atlantic SST Variations. Journal of Geophysical Research-Atmospheres, 127, doi:10.1029/2021jd036246.
- Chen, L., and T. W. Ford, 2023: Future changes in the transitions of monthly-to-seasonal precipitation extremes over the Midwest in Coupled Model Intercomparison Project Phase 6 models. International Journal of Climatology, 43, 255-274, doi:10.1002/joc.7756.
- Chen, Z., B. L. Gan, F. Huang, J. P. Li, L. X. Wu, L. Fan, and Y. N. Diao, 2022: The influence of Pacific-North American teleconnection on the North Pacific SST anomalies in Wintertime under the global warming. Climate Dynamics, doi:10.1007/s00382-022-06398-8.
- Chen, Z. H., P. Q. Wang, S. L. Bao, and W. M. Zhang, 2022: Rapid reconstruction of temperature and salinity fields based on machine learning and the assimilation application. Frontiers in Marine Science, 9, doi:10.3389/fmars.2022.985048.
- Chih, C. H., K. H. Chou, and C. C. Wu, 2022: Idealized simulations of tropical cyclones with thermodynamic conditions under reanalysis and CMIP5 scenarios. Geoscience Letters, 9, doi:10.1186/s40562-022-00239-6.
- Chowdary, J. S., T. S. Saikrishna, D. A. Ramu, P. Darshana, A. Parekh, C. Gnanaseelan, and K. K. Osuri, 2023: Symmetric and asymmetric response of Indian Summer Monsoon rainfall to different ENSO decay phases in observations and CMIP6 models. Global and Planetary Change, 220, doi:10.1016/j.gloplacha.2022.104000.
- Christiansen, B., S. T. Yang, and D. Matte, 2022: The Forced Response and Decadal Predictability of the North Atlantic Oscillation: Nonstationary and Fragile Skills. J. Clim., 35, 5869-5882, doi:10.1175/jcli-d-21-0807.1.
- Codilean, A. T., and Coauthors, 2022: OCTOPUS database (v.2). Earth System Science Data, 14, 3695-3713, doi:10.5194/essd-14-3695-2022.
- Cresswell-Clay, N., C. C. Ummenhofer, D. L. Thatcher, A. D. Wanamaker, R. F. Denniston, Y. Asmerom, and V. J. Polyak, 2022: Twentieth-century Azores High expansion unprecedented in the past 1,200 years. Nature Geoscience, 15, 548-+, doi:10.1038/s41561-022-00971-w.
- Creutin, J. D., J. Blanchet, A. Reverdy, A. Brochet, C. Lutoff, and Y. Robert, 2022: Reported Occurrence of Multiscale Flooding in an Alpine Conurbation over the Long Run (1850-2019). Water, 14, doi:10.3390/w14040548.
- Cui, J. X., and T. Li, 2022: Changes in MJO Characteristics and Impacts in the Past Century. J. Clim., 35, 577-590, doi:10.1175/jcli-d-21-0306.1.
- Cwik, P., R. A. McPherson, M. B. Richman, and A. E. Mercer, 2023: Climatology of 500-hPa geopotential height anomalies associated with May tornado outbreaks in the United States. International Journal of Climatology, 43, 893-913, doi:10.1002/joc.7841.
- Darshana, P., J. S. Chowdary, A. Parekh, and C. Gnanaseelan, 2022: Relationship between the Indo-western Pacific Ocean capacitor mode and Indian summer monsoon rainfall in CMIP6 models. Climate Dynamics, 59, 393-415, doi:10.1007/s00382-021-06133-9.
- Diao, C. R., and Y. Y. Xu, 2022: Reassessing the relative role of anthropogenic aerosols and natural decadal variability in driving the mid-twentieth century global "cooling": a focus on the latitudinal gradient of tropospheric temperature. Climate Dynamics, 59, 2655-2681, doi:10.1007/s00382-022-06235-y.
- Diarra, A., and Coauthors, 2022: Medium-Resolution Mapping of Evapotranspiration at the Catchment Scale Based on Thermal Infrared MODIS Data and ERA-Interim Reanalysis over North Africa. Remote Sensing, 14, doi:10.3390/rs14205071.
- Diouf, I., and Coauthors, 2022: Oceanic Influence on Seasonal Malaria Incidence in West Africa. Weather Climate and Society, 14, 287-302, doi:10.1175/wcas-d-20-0160.1.
- Dong, J. Z., F. N. Lei, and W. T. Crow, 2022: Land transpiration-evaporation partitioning errors responsible for modeled summertime warm bias in the central United States. Nature Communications, 13, doi:10.1038/s41467-021-27938-6.
- Dutta, A., and J. M. Neena, 2022: Exploring the circum-global teleconnection-Indian summer monsoon interactions in the interannual and multidecadal timescales. Frontiers in Earth Science, 10, doi:10.3389/feart.2022.973468.
- Dwivedi, S., P. Pandey, and B. N. Goswami, 2022: Nonstationarity and potential multi-decadal variability in Indian Summer Monsoon Rainfall and Southern Annular Mode teleconnection. Climate Dynamics, 59, 671-683, doi:10.1007/s00382-022-06146-y.
- Egli, M., S. Sippel, A. G. Pendergrass, I. de Vries, and R. Knutti, 2022: Reconstruction of Zonal Precipitation From Sparse Historical Observations Using Climate Model Information and Statistical Learning. Geophysical Research Letters, 49, doi:10.1029/2022gl099826.
- Ehmele, F., and Coauthors, 2022: Adaptation and application of the large LAERTES-EU regional climate model ensemble for modeling hydrological extremes: a pilot study for the Rhine basin. Natural Hazards and Earth System Sciences, 22, 677-692, doi:10.5194/nhess-22-677-2022.
- Fang, M., X. Li, H. W. Chen, and D. L. Chen, 2022: Arctic amplification modulated by Atlantic Multidecadal Oscillation and greenhouse forcing on multidecadal to century scales. Nature Communications, 13, doi:10.1038/s41467-022-29523-x.
- Fazel-Rastgar, F., and V. Sivakumar, 2022: A severe weather system accompanied by a stratospheric intrusion during unusual warm winter in 2015 over the South Africa: An initial synoptic analysis. Remote Sensing Applications-Society and Environment, 28, doi:10.1016/j.rsase.2022.100833.
- Finkenbinder, M. S., and Coauthors, 2022: A 5000-year lacustrine sediment oxygen isotope record of late Holocene climate change in Newfoundland, Canada. Quaternary Science Reviews, 278, doi:10.1016/j.quascirev.2022.107376.
- Fraga, H., N. Guimaraes, T. R. Freitas, A. C. Malheiro, and J. A. Santos, 2022: Future Scenarios for Olive Tree and Grapevine Potential Yields in the World Heritage Coa Region, Portugal. Agronomy-Basel, 12, doi:10.3390/agronomy12020350.
- Frazao, H. C., R. D. Prien, D. E. Schulz-Bull, D. Seidov, and J. J. Waniek, 2022: The Forgotten Azores Current: A Long-Term Perspective. Frontiers in Marine Science, 9, doi:10.3389/fmars.2022.842251.
- Frederiksen, J. S., and S. L. Osbrough, 2022: Tipping Points and Changes in Australian Climate and Extremes. Climate, 10, doi:10.3390/cli10050073.
- Fu, Z., P. C. Hsu, J. Li, J. Cao, Y. M. Yang, and F. Liu, 2022: Multidecadal Changes in Zonal Displacement of Tropical Pacific MJO Variability Modulated by North Atlantic SST. J. Clim., 35, 5951-5966, doi:10.1175/jcli-d-21-0819.1.
- Gao, X., and Coauthors, 2022: Evaluation of Sea Ice Simulation of CAS-ESM 2.0 in Historical Experiment. Atmosphere, 13, doi:10.3390/atmos13071056.
- Gibson, A. J., D. C. Verdon-Kidd, and G. R. Hancock, 2022: Characterising the seasonal nature of meteorological drought onset and termination across Australia. Journal of Southern Hemisphere Earth Systems Science, 72, 38-51, doi:10.1071/es21009.
- Gillespie, I., L. Haimberger, G. P. Compo, and P. W. Thorne, 2023: Assessing homogeneity of land surface air temperature observations using sparse-input reanalyses. International Journal of Climatology, 43, 736-760, doi:10.1002/joc.7822.
- Guan, X. D., Z. K. Gao, J. P. Huang, C. Y. Cao, K. W. Zhu, and J. M. Wang, 2022: Speeding extreme cold events under global warming. Environmental Research Letters, 17, doi:10.1088/1748-9326/ac8110.
- Hallam, S., S. A. Josey, G. D. McCarthy, and J. J. M. Hirschi, 2022: A regional (land-ocean) comparison of the seasonal to decadal variability of the Northern Hemisphere jet stream 1871-2011. Climate Dynamics, 59, 1897-1918, doi:10.1007/s00382-022-06185-5.
- Hamill, T. M., and Coauthors, 2022: The Reanalysis for the Global Ensemble Forecast System, Version 12. Monthly Weather Review, 150, 59-79, doi:10.1175/mwr-d-21-0023.1.
- Han, S. Z., H. L. Ren, B. H. Su, and J. X. Li, 2022: Connection between the North Atlantic sea surface temperature and the late autumn snow cover anomalies over the central Tibetan Plateau. Atmospheric Research, 279, doi:10.1016/j.atmosres.2022.106405.
- Hardouin, L., and Coauthors, 2022: Uncertainty in land carbon budget simulated by terrestrial biosphere models: the role of atmospheric forcing. Environmental Research Letters, 17, doi:10.1088/1748-9326/ac888d.
- Harvey, P. J., and S. W. Grab, 2022: Australian sub-regional temperature responses to volcanic forcing: A critical analysis using CMIP5 models. International Journal of Climatology, 42, 6109-6125, doi:10.1002/joc.7580.
- Haslinger, K., and K. Mayer, 2023: Early spring droughts in Central Europe: Indications for atmospheric and oceanic drivers. Atmospheric Science Letters, 24, doi:10.1002/asl.1136.
- Hong, X., and J. Li, 2022: Typhoon wind hazard analysis using the decoupling approach. Wind and Structures, 35, 287-296, doi:10.12989/was.2022.35.4.287.
- Horwath, M., and Coauthors, 2022: Global sea-level budget and ocean-mass budget, with a focus on advanced data products and uncertainty characterisation. Earth System Science Data, 14, 411-447, doi:10.5194/essd-14-411-2022.
- Huang, H. L., and Coauthors, 2022: Changes in Mechanisms and Characteristics of Western US Floods Over the Last Sixty Years. Geophysical Research Letters, 49, doi:10.1029/2021gl097022.
- Hudson, A. R., W. K. Smith, D. J. P. Moore, and V. Trouet, 2022: Length of growing season is modulated by Northern Hemisphere jet stream variability. International Journal of Climatology, 42, 5644-5660, doi:10.1002/joc.7553.
- Kayano, M. T., W. L. Cerón, R. V. Andreoli, R. A. F. Souza, A. Avila-Diaz, C. F. Zuluaga, and L. M. V. Carvalho, 2022: Does the El Nino-Southern Oscillation Affect the Combined Impact of the Atlantic Multidecadal Oscillation and Pacific Decadal Oscillation on the Precipitation and Surface Air Temperature Variability over South America? Atmosphere, 13, doi:10.3390/atmos13020231.
- Kotal, S. D., and S. K. Bhattacharya, 2023: Impact of evolution of initial conditions in tropical cyclone forecasting. Natural Hazards, 115, 807-837, doi:10.1007/s11069-022-05575-6.
- Kotsuki, S., T. Miyoshi, K. Kondo, and R. Potthast, 2022: A local particle filter and its Gaussian mixture extensionimplemented with minor modifications to the LETKF. Geoscientific Model Development, 15, 8325-8348, doi:10.5194/gmd-15-8325-2022.
- Kunz, M., C. Kottmeier, W. Lähne, I. Bertram, and C. Ehmann, 2022: The Karlsruhe temperature time series since 1779. Meteorologische Zeitschrift, 31, 175-202, doi:10.1127/metz/2022/1106.
- Labrousse, C., W. Ludwig, S. Pinel, M. Sadaoui, A. Toreti, and G. Lacquement, 2022: Declining water resources in response to global warming and changes inatmospheric circulation patterns over southern Mediterranean France. Hydrology and Earth System Sciences, 26, 6055-6071, doi:10.5194/hess-26-6055-2022.
- Lai, W. K. M., J. I. Robson, L. J. Wilcox, and N. Dunstone, 2022: Mechanisms of Internal Atlantic Multidecadal Variability in HadGEM3-GC3.1 at Two Different Resolutions. J. Clim., 35, 1365-1383, doi:10.1175/jcli-d-21-0281.1.
- Li, L. H., and S. L. Li, 2022: A Comparison of Two 20th Century Reanalysis Datasets from the Perspective of Cross-Equatorial Flows. Journal of the Meteorological Society of Japan, 100, 807-824, doi:10.2151/jmsj.2022-042.
- Li, X. L., and Coauthors, 2022: A Comparison of Land Surface Phenology in the Northern Hemisphere Derived from Satellite Remote Sensing and the Community Land Model. Journal of Hydrometeorology, 23, 859-873, doi:10.1175/jhm-d-21-0169.1.
- Li, Y. D., X. C. Li, S. P. Xie, G. Zhang, Z. Wang, W. Z. Wang, and Y. R. Hou, 2022: Regional Perspective of Hadley Circulation and Its Uncertainties Among Different Datasets: Spread in Reanalysis Datasets. Journal of Geophysical Research-Atmospheres, 127, doi:10.1029/2022jd036940.
- Lieber, R., A. King, J. Brown, L. Ashcroft, M. Freund, and C. McMichael, 2022: ENSO Teleconnections More Uncertain in Regions of Lower Socioeconomic Development. Geophysical Research Letters, 49, doi:10.1029/2022gl100553.
- Ling, F. H., J. J. Luo, Y. Li, T. Tang, L. Bai, W. L. Ouyang, and T. Yamagata, 2022: Multi-task machine learning improves multi-seasonal prediction of the Indian Ocean Dipole. Nature Communications, 13, doi:10.1038/s41467-022-35412-0.
- Liu, Y. J., Y. G. Zhang, N. Shan, Z. Y. Zhang, and Z. W. Wei, 2022: Global assessment of partitioning transpiration from evapotranspiration based on satellite solar-induced chlorophyll fluorescence data. Journal of Hydrology, 612, doi:10.1016/j.jhydrol.2022.128044.
- Lopes, A. B., R. V. Andreoli, R. A. F. Souza, W. L. Cerón, M. T. Kayano, T. Canchala, and D. S. de Moraes, 2022: Multiyear La Nina effects on the precipitation in South America. International Journal of Climatology, 42, 9567-9582, doi:10.1002/joc.7847.
- Lorrey, A. M., and Coauthors, 2022: Meteorological data rescue: Citizen science lessons learned from Southern Weather Discovery. Patterns, 3, doi:10.1016/j.patter.2022.100495.
- Lu, Y., Y. L. Li, J. Duan, P. F. Lin, and F. Wang, 2022: Multidecadal Sea Level Rise in the Southeast Indian Ocean: The Role of Ocean Salinity Change. J. Clim., 35, 1479-1496, doi:10.1175/jcli-d-21-0288.1.
- Lu, Y. L., J. Q. Feng, F. Jia, and D. X. Hu, 2022: Interdecadal Change in the Relationship Between the El Nino-Southern Oscillation and the North/South Pacific Meridional Mode. Journal of Geophysical Research-Oceans, 127, doi:10.1029/2021jc018284.
- Luo, M., J. M. Feng, Z. F. Xu, J. Wang, and L. Dan, 2022: Numerical simulation and cause analysis of persistent summer drought during the 1920s in eastern China. Science China-Earth Sciences, 65, 966-982, doi:10.1007/s11430-021-9891-9.
- Lyu, A., and Q. Z. Yin, 2022: The spatial-temporal patterns of East Asian climate in response to insolation, CO2 and ice sheets during MIS-5. Quaternary Science Reviews, 293, doi:10.1016/j.quascirev.2022.107689.
- Mahoney, K., C. McColl, D. M. Hultstrand, W. D. Kappel, B. McCormick, and G. P. Compo, 2022: Blasts from the Past Reimagining Historical Storms with Model Simulations to Modernize Dam Safety and Flood Risk Assessment. Bulletin of the American Meteorological Society, 103, E266-E280, doi:10.1175/bams-d-21-0133.1.
- Marshall, G. J., R. L. Fogt, J. Turner, and K. R. Clem, 2022: Can current reanalyses accurately portray changes in Southern Annular Mode structure prior to 1979? Climate Dynamics, 59, 3717-3740, doi:10.1007/s00382-022-06292-3.
- McKenna, C. M., and A. C. Maycock, 2022: The Role of the North Atlantic Oscillation for Projections of Winter Mean Precipitation in Europe. Geophysical Research Letters, 49, doi:10.1029/2022gl099083.
- McPhaden, M. J., and C. Karamperidou, 2022: La Nina Came to Eden. Bulletin of the American Meteorological Society, 103, E2862-E2877, doi:10.1175/bams-d-21-0343.1.
- Mezzina, B., J. García-Serrano, T. Ambrizzi, D. Matei, E. Manzini, and I. Bladé, 2023: Tropospheric pathways of the late-winter ENSO teleconnection to Europe. Climate Dynamics, 60, 3307-3317, doi:10.1007/s00382-022-06508-6.
- Mo, R. P., 2022: Prequel to the Stories of Warm Conveyor Belts and Atmospheric Rivers The Moist Tongues Identified by Rossby and His Collaborators in the 1930s. Bulletin of the American Meteorological Society, 103, E1019-E1040, doi:10.1175/bams-d-20-0276.1.
- Mohanty, M. P., and S. P. Simonovic, 2022: A Comprehensive Approach for Floodplain Mapping through Identification of Hazard Using Publicly Available Data Sets over Canada. Water, 14, doi:10.3390/w14142280.
- Mok, H. Y., and Coauthors, 2022: A historical re-analysis of the calamitous midget typhoon passing through Hong Kong on 18 September 1906 and its storm surge impact to Hong Kong. Tropical Cyclone Research and Review, 11, 174-218, doi:10.1016/j.tcrr.2022.09.005.
- Mondal, P., and S. Chaudhuri, 2022: Temporal variability in the withdrawal phase of southwest monsoon over India and related consequences in northeast monsoon: a climatological perspective. Theoretical and Applied Climatology, 148, 1021-1034, doi:10.1007/s00704-022-03979-9.
- Monteverde, C., F. De Sales, and C. Jones, 2022: Evaluation of the CMIP6 Performance in Simulating Precipitation in the Amazon River Basin. Climate, 10, doi:10.3390/cli10080122.
- Noad, N. C., and P. P. Bonnaventure, 2022: Surface temperature inversion characteristics in dissimilar valleys, Yukon Canada. Arctic Science, doi:10.1139/as-2021-0048.
- Oksman, M., and Coauthors, 2022: Impact of freshwater runoff from the southwest Greenland Ice Sheet on fjord productivity since the late 19th century. Cryosphere, 16, 2471-2491, doi:10.5194/tc-16-2471-2022.
- Omrani, N. E., N. Keenlyside, K. Matthes, L. Boljka, D. Zanchettin, J. H. Jungclaus, and S. W. Lubis, 2022: Coupled stratosphere-troposphere-Atlantic multidecadal oscillation and its importance for near-future climate projection. Npj Climate and Atmospheric Science, 5, doi:10.1038/s41612-022-00275-1.
- Pandey, P., S. Dwivedi, and B. N. Goswami, 2022: Trend and variability in the long-term relationship between Eurasian snow cover and Indian summer monsoon rainfall. International Journal of Climatology, 42, 7751-7765, doi:10.1002/joc.7675.
- Pei, L., Z. W. Yan, D. L. Chen, and S. G. Miao, 2022: The Contribution of Human-Induced Atmospheric Circulation Changes to the Record-Breaking Winter Precipitation Event over Beijing in February 2020. Bulletin of the American Meteorological Society, 103, S55-S60, doi:10.1175/bams-d-21-0153.1.
- Peña, J. C., and Coauthors, 2022: Low-Frequency Atmospheric Variability Patterns and Synoptic Types Linked to Large Floods in the Lower Ebro River Basin. J. Clim., 35, 2351-2371, doi:10.1175/jcli-d-20-0394.1.
- Penland, C., and P. D. Sardeshmukh, 2022: A mechanism for the skew of ensemble forecasts. Quarterly Journal of the Royal Meteorological Society, 148, 1131-1143, doi:10.1002/qj.4251.
- Pronk, V., and Coauthors, 2022: Can reanalysis products outperform mesoscale numerical weather prediction models in modeling the wind resource in simple terrain? Wind Energy Science, 7, 487-504, doi:10.5194/wes-7-487-2022.
- Qian, D. W., Y. Y. Huang, and H. J. Wang, 2022: A preliminary attempt on decadal prediction of the East Asian summer monsoon. Theoretical and Applied Climatology, 148, 1499-1511, doi:10.1007/s00704-022-04011-w.
- Qu, Y., S. Jevrejeva, J. Williams, and J. C. Moore, 2022: Drivers for seasonal variability in sea level around the China seas. Global and Planetary Change, 213, doi:10.1016/j.gloplacha.2022.103819.
- Reddy, P. J., S. E. Perkins-Kirkpatrick, N. N. Ridder, and J. J. Sharples, 2022: Combined role of ENSO and IOD on compound drought and heatwaves in Australia using two CMIP6 large ensembles. Weather and Climate Extremes, 37, doi:10.1016/j.wace.2022.100469.
- Ren, Y. Y., G. Y. Ren, R. Allan, J. Li, G. W. Yang, and P. F. Zhang, 2022: The 1757-62 Temperature Observed in Beijing. Bulletin of the American Meteorological Society, 103, E2470-E2483, doi:10.1175/bams-d-21-0245.1.
- Renard, B., M. Thyer, D. McInerney, D. Kavetski, M. Leonard, and S. Westra, 2022: A Hidden Climate Indices Modeling Framework for Multivariable Space-Time Data. Water Resources Research, 58, doi:10.1029/2021wr030007.
- Renteria-Villalobos, M., R. T. Hanson, and C. Eastoe, 2022: Evaluation of climate variability on sustainability for transboundary water supply in Chihuahua, Mexico. J Hydrol-Reg Stud, 44, doi:10.1016/j.ejrh.2022.101207.
- Rimbu, N., M. Ionita, and G. Lohmann, 2022: Interdecadal Pacific Oscillation in Northern Greenland Dust Concentration Variability During the Last 400 Years. Geophysical Research Letters, 49, doi:10.1029/2022gl101500.
- Rogers, M. H., J. C. Furtado, and B. T. Anderson, 2022: The pacific decadal precession and its relationship to tropical pacific decadal variability in CMIP6 models. Climate Dynamics, 59, 23-40, doi:10.1007/s00382-021-06114-y.
- Roibu, C. C., V. Nagavciuc, M. Ionita, I. Popa, S. A. Horodnic, A. Mursa, and U. Büntgen, 2022: A tree ring-based hydroclimate reconstruction for eastern Europe reveals large-scale teleconnection patterns. Climate Dynamics, 59, 2979-2994, doi:10.1007/s00382-022-06255-8.
- Rojas-Labanda, C., F. González-Rouco, E. García-Bustamante, J. Navarro, E. E. Lucio-Eceiza, G. van der Schrier, and F. Kaspar, 2023: Surface wind over Europe: Data and variability. International Journal of Climatology, 43, 134-156, doi:10.1002/joc.7739.
- Rossby, T., J. Palter, and K. Donohue, 2022: What Can Hydrography Between the New England Slope, Bermuda and Africa Tell us About the Strength of the AMOC Over the Last 90 years? Geophysical Research Letters, 49, doi:10.1029/2022gl099173.
- Roustan, J. B., L. Pineau-Guillou, B. Chapron, N. Raillard, and M. Reinert, 2022: Shift of the storm surge season in Europe due to climate variability. Scientific Reports, 12, doi:10.1038/s41598-022-12356-5.
- Rutgersson, A., and Coauthors, 2022: Natural hazards and extreme events in the Baltic Sea region. Earth System Dynamics, 13, 251-301, doi:10.5194/esd-13-251-2022.
- Shiogama, H., M. Watanabe, H. Kim, and N. Hirota, 2022: Emergent constraints on future precipitation changes. Nature, 602, 612-+, doi:10.1038/s41586-021-04310-8.
- Smedsrud, L. H., and Coauthors, 2022: Nordic Seas Heat Loss, Atlantic Inflow, and Arctic Sea Ice Cover Over the Last Century. Reviews of Geophysics, 60, doi:10.1029/2020rg000725.
- Song, K. X., J. W. Zhao, R. F. Zhan, L. Tao, and L. Chen, 2022: Confidence and Uncertainty in Simulating Tropical Cyclone Long-Term Variability Using the CMIP6-HighResMIP. J. Clim., 35, 2829-2849, doi:10.1175/jcli-d-21-0875.1.
- Soster, F., and R. Parfitt, 2022: On Objective Identification of Atmospheric Fronts and Frontal Precipitation in Reanalysis Datasets. J. Clim., 35, 4513-4534, doi:10.1175/jcli-d-21-0596.1.
- Steffelbauer, D. B., R. E. M. Riva, J. S. Timmermans, J. H. Kwakkel, and M. Bakker, 2022: Evidence of regional sea-level rise acceleration for the North Sea. Environmental Research Letters, 17, doi:10.1088/1748-9326/ac753a.
- Steptoe, H., C. Souch, and J. Slingo, 2022: Advances in numerical weather prediction, data science, and open-source software herald a paradigm shift in catastrophe risk modeling and insurance underwriting. Risk Management and Insurance Review, 25, 69-81, doi:10.1111/rmir.12199.
- Sun, J. Z., and Coauthors, 2022: An online ensemble coupled data assimilation capability for the Community Earth System Model: system design and evaluation. Geoscientific Model Development, 15, 4805-4830, doi:10.5194/gmd-15-4805-2022.
- Sun, X. T., and Coauthors, 2022: Enhanced jet stream waviness induced by suppressed tropical Pacific convection during boreal summer. Nature Communications, 13, doi:10.1038/s41467-022-28911-7.
- Sun, Y. B., and Coauthors, 2022: A review of orbital-scale monsoon variability and dynamics in East Asia during the Quaternary. Quaternary Science Reviews, 288, doi:10.1016/j.quascirev.2022.107593.
- Tadesse, M. G., T. Wahl, M. M. Rashid, S. Dangendorf, A. Rodríguez-Enríquez, and S. A. Talke, 2022: Long-term trends in storm surge climate derived from an ensemble of global surge reconstructions. Scientific Reports, 12, doi:10.1038/s41598-022-17099-x.
- Tao, L. J., and W. S. Duan, 2022: A novel precursory signal of the Central Pacific El Nino event: Eastern Pacific cooling mode. Climate Dynamics, 59, 2599-2617, doi:10.1007/s00382-022-06229-w.
- Tao, W. C., X. W. Kong, Y. Liu, Y. Wang, and D. H. Dong, 2022: Diversity of Northwest Pacific atmospheric circulation anomalies during post-ENSO summer. Frontiers in Environmental Science, 10, doi:10.3389/fenvs.2022.1068155.
- Teng, H. Y., R. Leung, G. Branstator, J. Lu, and Q. H. Ding, 2022: Warming Pattern over the Northern Hemisphere Midlatitudes in Boreal Summer 1979-2020. J. Clim., 35, 3479-3494, doi:10.1175/jcli-d-21-0437.1.
- Thatcher, D. L., and Coauthors, 2022: Iberian hydroclimate variability and the Azores High during the last 1200 years: evidence from proxy records and climate model simulations. Climate Dynamics, doi:10.1007/s00382-022-06427-6.
- Trinh, T., A. Diaz, Y. Iseri, E. Snider, M. L. Anderson, K. J. Carr, and M. L. Kavvas, 2022: A numerical coupled atmospheric-hydrologic modeling system for probable maximum flood estimation with application to California's southern Sierra Nevada foothills watersheds. Journal of Flood Risk Management, doi:10.1111/jfr3.12809.
- Trinh, T., Y. Iseri, A. J. Diaz, E. D. Snider, M. L. Anderson, and M. L. Kavvas, 2022: Maximization of Historical Storm Events over Seven Watersheds in Central/Southern Sierra Nevada by Means of Atmospheric Boundary Condition Shifting and Relative Humidity Optimization Methods. J Hydrol Eng, 27, doi:10.1061/(asce)he.1943-5584.0002159.
- Tucker, C. S., J. K. Pearl, E. A. Elliott, J. C. Bregy, J. M. Friedman, and M. D. Therrell, 2022: Baldcypress false ring formation linked to summer hydroclimatic extremes in the southeastern United States. Environmental Research Letters, 17, doi:10.1088/1748-9326/ac9745.
- Vashisht, A., and B. Zaitchik, 2022: Modulation of East African Boreal Fall Rainfall: Combined Effects of the Madden-Julian Oscillation (MJO) and El Nino-Southern Oscillation (ENSO). J. Clim., 35, 2019-2034, doi:10.1175/jcli-d-21-0583.1.
- Wade, M., B. Rodríguez-Fonseca, M. Martín-Rey, A. Lazar, J. López-Parages, and A. T. Gaye, 2023: Interdecadal changes in SST variability drivers in the Senegalese-upwelling: the impact of ENSO. Climate Dynamics, 60, 667-685, doi:10.1007/s00382-022-06311-3.
- Wahl, E., E. Zorita, and A. Hoell, 2022: The Kalman Filter as Post-Processor for Analog Data-Model Assimilation in Paleoclimate Reconstruction. J. Clim., 35, 5501-5518, doi:10.1175/jcli-d-21-0454.1.
- Wang, D. D., Y. H. Chen, L. Q. Hu, J. A. Voogt, and X. Y. He, 2022: Satellite-based daytime urban thermal anisotropy: A comparison of 25 global cities. Remote Sens Environ, 283, doi:10.1016/j.rse.2022.113312.
- Wang, G. J., and Coauthors, 2022: Future Southern Ocean warming linked to projected ENSO variability. Nature Climate Change, 12, 649-+, doi:10.1038/s41558-022-01398-2.
- Wang, J., and Coauthors, 2022: Synergistic impacts of westerlies and monsoon on interdecadal variations of late spring precipitation over the southeastern extension of the Tibetan Plateau. International Journal of Climatology, 42, 7342-7361, doi:10.1002/joc.7648.
- Wang, Y. F., and P. Huang, 2022: Potential fire risks in South America under anthropogenic forcing hidden by the Atlantic Multidecadal Oscillation. Nature Communications, 13, doi:10.1038/s41467-022-30104-1.
- Webb, E. J., and B. I. Magi, 2022: The Ensemble Oceanic Nino Index. International Journal of Climatology, 42, 5321-5341, doi:10.1002/joc.7535.
- Wilhelm, B., B. Amann, J. P. Corella, W. Rapuc, C. Giguet-Covex, B. Merz, and E. Storen, 2022: Reconstructing Paleoflood Occurrence and Magnitude from Lake Sediments. Quaternary, 5, doi:10.3390/quat5010009.
- Wu, H. H., C. S. Fu, L. L. Zhang, and H. W. Wu, 2022: Elevated Wildfire and Ecosystem Carbon Loss Risks Due to Plant Hydraulic Stress Functions: A Global Modeling Perspective. Fire-Switzerland, 5, doi:10.3390/fire5060187.
- Xie, M. M., C. Z. Wang, and S. Chen, 2022: The Role of the Maritime Continent SST Anomalies in Maintaining the Pacific-Japan Pattern on Decadal Time Scales. J. Clim., 35, 1079-1095, doi:10.1175/jcli-d-21-0555.1.
- Xie, Y. Y., and Coauthors, 2022: Tripling of western US particulate pollution from wildfires in a warming climate. Proceedings of the National Academy of Sciences of the United States of America, 119, doi:10.1073/pnas.2111372119.
- Xu, D. H., G. Bisht, T. Zhou, L. R. Leung, and M. Pan, 2022: Development of Land-River Two-Way Hydrologic Coupling for Floodplain Inundation in the Energy Exascale Earth System Model. Journal of Advances in Modeling Earth Systems, 14, doi:10.1029/2021ms002772.
- Xu, P. Q., L. Wang, Z. Z. Dong, Y. J. Li, X. C. Shen, and W. Chen, 2022: The British-Okhotsk Corridor Pattern and Its Linkage to the Silk Road Pattern. J. Clim., 35, 5787-5804, doi:10.1175/jcli-d-21-0705.1.
- Xu, Z. Q., and K. Fan, 2022: Enhanced Intensity of the Interannual Variability of February Surface Air Temperature Over Mid- and High-Latitude Asia Since the Late-1990s. Journal of Geophysical Research-Atmospheres, 127, doi:10.1029/2022jd036873.
- Yu, B., and Coauthors, 2022: Northern Hemisphere Extratropical Cyclone Activity in the Twentieth Century Reanalysis Version 3 (20CRv3) and Its Relationship with Continental Extreme Temperatures. Atmosphere, 13, doi:10.3390/atmos13081166.
- Yu, M. X., J. Feng, J. P. Li, and R. An, 2023: Interdecadal shift of the El Nino's modulation on the connection between the Hadley circulation and tropical SST. Climate Dynamics, 60, 2167-2181, doi:10.1007/s00382-022-06407-w.
- Zanchettin, D., S. Rubinetti, and A. Rubino, 2022: Is the Atlantic a Source for Decadal Predictability of Sea-Level Rise in Venice? Earth and Space Science, 9, doi:10.1029/2022ea002494.
- Zhang, H., and Coauthors, 2022: Recent climate change has driven divergent hydrological shifts in high-latitude peatlands. Nature Communications, 13, doi:10.1038/s41467-022-32711-4.
- Zhang, W., B. Kirtman, L. Siqueira, B. Q. Xiang, J. Infanti, and N. Perlin, 2022: Decadal Variability of Southeast US Rainfall in an Eddying Global Coupled Model. Geophysical Research Letters, 49, doi:10.1029/2021gl096709.
- Zhang, Z. Y., and G. Li, 2022: Uncertainty in the projected changes of Sahel summer rainfall under global warming in CMIP5 and CMIP6 multi-model ensembles. Climate Dynamics, 59, 3579-3597, doi:10.1007/s00382-022-06284-3.
- Zheng, S. H., H. L. Liu, and X. D. Wang, 2022: A robust mode of the winter oceanic mixed layer depth in the North Pacific. Dynamics of Atmospheres and Oceans, 97, doi:10.1016/j.dynatmoce.2022.101281.
- Zhirnova, D. F., L. V. Belokopytova, K. V. Krutovsky, Y. A. Kholdaenko, E. A. Babushkina, and E. A. Vaganov, 2022: Spatial-Coherent Dynamics and Climatic Signals in the Radial Growth of Siberian Stone Pine (Pinus sibirica Du Tour) in Subalpine Stands along the Western Sayan Mountains. Forests, 13, doi:10.3390/f13121994.
- Zhirnova, D. F., L. V. Belokopytova, K. K. Upadhyay, S. K. Tripathi, E. A. Babushkina, and E. A. Vaganov, 2022: 495-Year Wood Anatomical Record of Siberian Stone Pine (Pinus sibirica Du Tour) as Climatic Proxy on the Timberline. Forests, 13, doi:10.3390/f13020247.
- Antico, A., and M. Vuille, 2022: ENSO and Parana flow variability: Long-term changes in their connectivity. International Journal of Climatology, 42, 7269-7279, doi:10.1002/joc.7643.
- Augustine, J. A., and A. Capotondi, 2022: Forcing for Multidecadal Surface Solar Radiation Trends Over Northern Hemisphere Continents. Journal of Geophysical Research-Atmospheres, 127, doi:10.1029/2021jd036342.
- Bracegirdle, T. J., 2022: Early-to-Late Winter 20th Century North Atlantic Multidecadal Atmospheric Variability in Observations, CMIP5 and CMIP6. Geophysical Research Letters, 49, doi:10.1029/2022gl098212.
- Bracegirdle, T. J., H. Lu, and J. Robson, 2022: Early-winter North Atlantic low-level jet latitude biases in climate models: implications for simulated regional atmosphere-ocean linkages. Environmental Research Letters, 17, doi:10.1088/1748-9326/ac417f.
- Brönnimann, S., 2022: Historical Observations for Improving Reanalyses. Frontiers in Climate, 4, doi:10.3389/fclim.2022.880473.
- Brönnimann, S., and Coauthors, 2022: Influence of warming and atmospheric circulation changes on multidecadal European flood variability. Climate of the Past, 18, 919-933, doi:10.5194/cp-18-919-2022.
- Burgdorf, A. M., 2022: A global inventory of quantitative documentary evidence related to climate since the 15th century. Climate of the Past, 18, 1407-1428, doi:10.5194/cp-18-1407-2022.
- Capozzi, V., C. De Vivo, and G. Budillon, 2022: Synoptic control over winter snowfall variability observed in a remote site of Apennine Mountains (Italy), 1884-2015. Cryosphere, 16, 1741-1763, doi:10.5194/tc-16-1741-2022.
- Cassalho, F., T. W. Miesse, A. Khalid, A. D. de Lima, C. M. Ferreira, M. Henke, and T. M. Ravens, 2022: Intercomparing atmospheric reanalysis products for hydrodynamic and wave modeling of extreme events during the open-water Arctic season. Arct Antarct Alp Res, 54, 125-146, doi:10.1080/15230430.2022.2059957.
- Cesana, G. V., T. Khadir, H. Chepfer, and M. Chiriaco, 2022: Southern Ocean Solar Reflection Biases in CMIP6 Models Linked to Cloud Phase and Vertical Structure Representations. Geophysical Research Letters, 49, doi:10.1029/2022gl099777.
- Chakraborty, T., X. Lee, and D. M. Lawrence, 2022: Diffuse Radiation Forcing Constraints on Gross Primary Productivity and Global Terrestrial Evapotranspiration. Earths Future, 10, doi:10.1029/2022ef002805.
- Chand, S. S., and Coauthors, 2022: Declining tropical cyclone frequency under global warming. Nature Climate Change, 12, 655-+, doi:10.1038/s41558-022-01388-4.
- Chemke, R., Y. Ming, and J. Yuval, 2022: The intensification of winter mid-latitude storm tracks in the Southern Hemisphere. Nature Climate Change, 12, 553-+, doi:10.1038/s41558-022-01368-8.
- Christidis, N., and P. A. Stott, 2022: Human Influence on Seasonal Precipitation in Europe. J. Clim., 35, 5215-5231, doi:10.1175/jcli-d-21-0637.1.
- Dunn, R. J. H., M. G. Donat, and L. V. Alexander, 2022: Comparing extremes indices in recent observational and reanalysis products. Frontiers in Climate, 4, doi:10.3389/fclim.2022.989505.
- Dunn, R. J. H., and C. P. Morice, 2022: On the effect of reference periods on trends in percentile-based extreme temperature indices. Environmental Research Letters, 17, doi:10.1088/1748-9326/ac52c8.
- Dwivedi, S., P. Pandey, and B. N. Goswami, 2022: Nonstationarity and potential multi-decadal variability in Indian Summer Monsoon Rainfall and Southern Annular Mode teleconnection. Climate Dynamics, 59, 671-683, doi:10.1007/s00382-022-06146-y.
- Egli, M., S. Sippel, A. G. Pendergrass, I. de Vries, and R. Knutti, 2022: Reconstruction of Zonal Precipitation From Sparse Historical Observations Using Climate Model Information and Statistical Learning. Geophysical Research Letters, 49, doi:10.1029/2022gl099826.
- Eischeid, J. K., M. P. Hoerling, X. W. Quan, and H. F. Diaz, 2022: Diagnosing Hawaii's Recent Drought. J. Clim., 35, 3997-4012, doi:10.1175/jcli-d-21-0754.1.
- Fazel-Rastgar, F., and V. Sivakumar, 2022: A severe weather system accompanied by a stratospheric intrusion during unusual warm winter in 2015 over the South Africa: An initial synoptic analysis. Remote Sensing Applications-Society and Environment, 28, doi:10.1016/j.rsase.2022.100833.
- Garrett, E., W. R. Gehrels, B. W. Hayward, R. Newnham, M. J. Gehrels, C. J. Morey, and S. Dangendorf, 2022: Drivers of 20th century sea-level change in southern New Zealand determined from proxy and instrumental records. Journal of Quaternary Science, 37, 1025-1043, doi:10.1002/jqs.3418.
- Gergis, J., Z. Baillie, L. Ashcroft, B. Trewin, and R. J. Allan, 2023: Consolidating historical instrumental observations in southern Australia for assessing pre-industrial weather and climate variability. Climate Dynamics, 61, 1063-1087, doi:10.1007/s00382-022-06573-x.
- Gillespie, I., L. Haimberger, G. P. Compo, and P. W. Thorne, 2023: Assessing homogeneity of land surface air temperature observations using sparse-input reanalyses. International Journal of Climatology, 43, 736-760, doi:10.1002/joc.7822.
- Goswami, B. N., D. Chakraborty, P. V. Rajesh, and A. Mitra, 2022: Predictability of South-Asian monsoon rainfall beyond the legacy of Tropical Ocean Global Atmosphere program (TOGA). Npj Climate and Atmospheric Science, 5, doi:10.1038/s41612-022-00281-3.
- Goswami, D. J., K. Ashok, and B. N. Goswami, 2022: Local ocean-atmosphere interaction in Indian summer monsoon multi-decadal variability. Climate Dynamics, doi:10.1007/s00382-022-06377-z.
- Grooms, I., 2022: A comparison of nonlinear extensions to the ensemble Kalman filter Gaussian anamorphosis and two-step ensemble filters. Computational Geosciences, 26, 633-650, doi:10.1007/s10596-022-10141-x.
- Guo, S. Y., X. D. Guan, L. L. Gao, W. Sun, C. Y. Cao, and Y. L. He, 2022: Opposite Atlantic Multidecadal Oscillation effects on dry/wet changes over Central and East Asian drylands. Atmospheric Research, 271, doi:10.1016/j.atmosres.2022.106102.
- Gupta, R. S., S. Steinschneider, and P. M. Reed, 2023: A multi-objective paleo-informed reconstruction of western US weather regimes over the past 600 years. Climate Dynamics, 60, 339-358, doi:10.1007/s00382-022-06302-4.
- Hahmann, A. N., O. García-Santiago, and A. Peña, 2022: Current and future wind energy resources in the North Sea according to CMIP6. Wind Energy Science, 7, 2373-2391, doi:10.5194/wes-7-2373-2022.
- Halder, S., A. Parekh, J. S. Chowdary, and C. Gnanaseelan, 2022: Dynamical and moist thermodynamical processes associated with Western Ghats rainfall decadal variability. Npj Climate and Atmospheric Science, 5, doi:10.1038/s41612-022-00232-y.
- Hamill, T. M., and Coauthors, 2022: The Reanalysis for the Global Ensemble Forecast System, Version 12. Monthly Weather Review, 150, 59-79, doi:10.1175/mwr-d-21-0023.1.
- Hanna, E., T. E. Cropper, R. J. Hall, R. C. Cornes, and M. Barriendos, 2022: Extended North Atlantic Oscillation and Greenland Blocking Indices 1800-2020 from New Meteorological Reanalysis. Atmosphere, 13, doi:10.3390/atmos13030436.
- Heidemann, H., J. Ribbe, T. Cowan, B. J. Henley, C. Pudmenzky, R. Stone, and D. H. Cobon, 2022: The Influence of Interannual and Decadal Indo-Pacific Sea Surface Temperature Variability on Australian Monsoon Rainfall. J. Clim., 35, 425-444, doi:10.1175/jcli-d-21-0264.1.
- Hirano, J., T. Mikami, and M. Zaiki, 2022: Analysis of early Japanese meteorological data and historical weather documents to reconstruct the winter climate between the 1840s and the early 1850s. Climate of the Past, 18, 327-339, doi:10.5194/cp-18-327-2022.
- Iqbal, S. W., and Coauthors, 2022: Performance evaluation and comparison of observed and reanalysis gridded precipitation datasets over Pakistan. Theoretical and Applied Climatology, 149, 1093-1116, doi:10.1007/s00704-022-04100-w.
- Ivasic, S., and I. Herceg-Bulic, 2023: A modelling study of the impact of tropical SSTs on the variability and predictable components of seasonal atmospheric circulation in the North Atlantic-European region. Climate Dynamics, 60, 927-944, doi:10.1007/s00382-022-06357-3.
- Jaume-Santero, F., D. Barriopedro, R. García-Herrera, and J. Luterbacher, 2022: Monthly North Atlantic Sea Level Pressure Reconstruction Back to 1750 CE Using Artificial Intelligence Optimization. J. Clim., 35, 3395-3410, doi:10.1175/jcli-d-21-0155.1.
- Joshi, M. K., A. Rai, and A. Kulkarni, 2022: Global-scale interdecadal variability a skillful predictor at decadal-to-multidecadal timescales for Sahelian and Indian Monsoon Rainfall. Npj Climate and Atmospheric Science, 5, doi:10.1038/s41612-021-00227-1.
- Junqueira, R., M. R. Viola, J. D. Amorim, S. C. Wongchuig, C. R. de Mello, M. Vieira, and G. Coelho, 2022: Hydrological Retrospective and Historical Drought Analysis in a Brazilian Savanna Basin. Water, 14, doi:10.3390/w14142178.
- Karzani, M., Y. Ghavidel, and M. Farajzadeh, 2022: Temporal Changes in Lethal Temperatures Above 50 °C in the Northern Hemisphere. Pure and Applied Geophysics, 179, 3377-3390, doi:10.1007/s00024-022-03109-6.
- Konstali, K., and A. Sorteberg, 2022: Why has Precipitation Increased in the Last 120 Years in Norway? Journal of Geophysical Research-Atmospheres, 127, doi:10.1029/2021jd036234.
- Labe, Z. M., and E. A. Barnes, 2022: Comparison of Climate Model Large Ensembles With Observations in the Arctic Using Simple Neural Networks. Earth and Space Science, 9, doi:10.1029/2022ea002348.
- Li, J. C., Z. P. Wen, X. Z. Li, and Y. Y. Guo, 2022: Interdecadal Changes in the Relationship between Wintertime Surface Air Temperature over the Indo-China Peninsula and ENSO. J. Clim., 35, 975-995, doi:10.1175/jcli-d-21-0477.1.
- Li, L. H., and S. L. Li, 2022: A Comparison of Two 20th Century Reanalysis Datasets from the Perspective of Cross-Equatorial Flows. Journal of the Meteorological Society of Japan, 100, 807-824, doi:10.2151/jmsj.2022-042.
- Li, M. X., P. L. Wu, Z. G. Ma, Z. H. Pan, M. X. Lv, Q. Yang, and Y. W. Duan, 2022: The Increasing Role of Vegetation Transpiration in Soil Moisture Loss across China under Global Warming. Journal of Hydrometeorology, 23, 253-274, doi:10.1175/jhm-d-21-0132.1.
- Li, X. J., Y. M. Tang, X. S. Song, and T. Liu, 2022: Decadal Variation of the Rainfall Predictability over the Maritime Continent in the Wet Season. J. Clim., 35, 4859-4867, doi:10.1175/jcli-d-21-0862.1.
- Lieber, R., A. King, J. Brown, L. Ashcroft, M. Freund, and C. McMichael, 2022: ENSO Teleconnections More Uncertain in Regions of Lower Socioeconomic Development. Geophysical Research Letters, 49, doi:10.1029/2022gl100553.
- Liu, C. Y., and Coauthors, 2022: Blending TAC and BUFR Marine In Situ Data for ICOADS Near-Real-Time Release 3.0.2. Journal of Atmospheric and Oceanic Technology, 39, 1943-1959, doi:10.1175/jtech-d-21-0182.1.
- Liu, X. H., and F. C. Yao, 2022: Relationship of the Warming of Red Sea Surface Water over 140 Years with External Heat Elements. Journal of Marine Science and Engineering, 10, doi:10.3390/jmse10070846.
- Lorrey, A. M., and Coauthors, 2022: Meteorological data rescue: Citizen science lessons learned from Southern Weather Discovery. Patterns, 3, doi:10.1016/j.patter.2022.100495.
- Lu, Z. C., T. B. Zhao, W. C. Zhou, and H. K. Zhao, 2022: Interdecadal Variation of the Antarctic Circumpolar Wave Based on the 20CRV3 Dataset. Atmosphere, 13, doi:10.3390/atmos13050736.
- Lyu, A., and Q. Z. Yin, 2022: The spatial-temporal patterns of East Asian climate in response to insolation, CO2 and ice sheets during MIS-5. Quaternary Science Reviews, 293, doi:10.1016/j.quascirev.2022.107689.
- Mahoney, K., C. McColl, D. M. Hultstrand, W. D. Kappel, B. McCormick, and G. P. Compo, 2022: Blasts from the Past Reimagining Historical Storms with Model Simulations to Modernize Dam Safety and Flood Risk Assessment. Bulletin of the American Meteorological Society, 103, E266-E280, doi:10.1175/bams-d-21-0133.1.
- Maksic, J., M. H. Shimizu, M. T. Kayano, C. M. Chiessi, M. Prange, and G. Sampaio, 2022: Influence of the Atlantic Multidecadal Oscillation on South American Atmosphere Dynamics and Precipitation. Atmosphere, 13, doi:10.3390/atmos13111778.
- Marshall, G. J., R. L. Fogt, J. Turner, and K. R. Clem, 2022: Can current reanalyses accurately portray changes in Southern Annular Mode structure prior to 1979? Climate Dynamics, 59, 3717-3740, doi:10.1007/s00382-022-06292-3.
- Matskovsky, V., F. A. Roig, M. Fuentes, I. Korneva, D. Araneo, H. W. Linderholm, and J. C. Aravena, 2022: Summer temperature changes in Tierra del Fuego since AD 1765: atmospheric drivers and tree-ring reconstruction from the southernmost forests of the world. Climate Dynamics, doi:10.1007/s00382-022-06384-0.
- McKenna, C. M., and A. C. Maycock, 2022: The Role of the North Atlantic Oscillation for Projections of Winter Mean Precipitation in Europe. Geophysical Research Letters, 49, doi:10.1029/2022gl099083.
- Melo-Aguilar, C., and Coauthors, 2022: Near-surface soil thermal regime and land-air temperature coupling: A case study over Spain. International Journal of Climatology, 42, 7516-7534, doi:10.1002/joc.7662.
- Meyer, E. M. I., R. Weisse, I. Grabemann, B. Tinz, and R. Scholz, 2022: Reconstruction of wind and surge of the 1906 storm tide at the German North Sea coast. Natural Hazards and Earth System Sciences, 22, 2419-2432, doi:10.5194/nhess-22-2419-2022.
- Mo, R. P., 2022: Prequel to the Stories of Warm Conveyor Belts and Atmospheric Rivers The Moist Tongues Identified by Rossby and His Collaborators in the 1930s. Bulletin of the American Meteorological Society, 103, E1019-E1040, doi:10.1175/bams-d-20-0276.1.
- Mortimer, C., and Coauthors, 2022: Benchmarking algorithm changes to the Snow CCI plus snow water equivalent product. Remote Sens Environ, 274, doi:10.1016/j.rse.2022.112988.
- Nagavciuc, V., M. Ionita, Z. Kern, D. McCarroll, and I. Popa, 2022: A ∼700 years perspective on the 21st century drying in the eastern part of Europe based on δ18O in tree ring cellulose. Communications Earth & Environment, 3, doi:10.1038/s43247-022-00605-4.
- Nakano, H., S. Urakawa, K. Sakamoto, T. Toyoda, Y. Kawakami, and G. Yamanaka, 2022: Long-term sea-level variability along the coast of Japan during the 20th century revealed by a 1/10° OGCM. Journal of Oceanography, doi:10.1007/s10872-022-00671-4.
- Nielsen, A. H., A. Iosifidis, and H. Karstoft, 2022: Forecasting large-scale circulation regimes using deformable convolutional neural networks and global spatiotemporal climate data. Scientific Reports, 12, doi:10.1038/s41598-022-12167-8.
- Nolin, A. F., M. P. Girardin, J. C. Tardif, X. J. Guo, F. Conciatori, and Y. Bergeron, 2022: A 247-year tree-ring reconstruction of spring temperature and relation to spring flooding in eastern boreal Canada. International Journal of Climatology, 42, 6479-6498, doi:10.1002/joc.7608.
- Obregón, M. A., M. T. Rodas, A. M. M. Farrona, F. Domínguez-Castro, M. C. Gallego, R. García-Herrera, and J. M. Vaquero, 2022: On the Value of Early Marine Weather Observations the Malaspina Expedition (1789-94). Bulletin of the American Meteorological Society, 103, E1684-E1695, doi:10.1175/bams-d-21-0051.1.
- Ombadi, M., and M. D. Risser, 2022: What's the temperature tomorrow? Increasing trends in extreme volatility of daily maximum temperature in Central and Eastern United States (1950-2019). Weather and Climate Extremes, 38, doi:10.1016/j.wace.2022.100515.
- Pandey, P., S. Dwivedi, and B. N. Goswami, 2022: Trend and variability in the long-term relationship between Eurasian snow cover and Indian summer monsoon rainfall. International Journal of Climatology, 42, 7751-7765, doi:10.1002/joc.7675.
- Pappert, D., and Coauthors, 2022: Statistical reconstruction of daily temperature and sea level pressure in Europe for the severe winter 1788/89. Climate of the Past, 18, 2545-2565, doi:10.5194/cp-18-2545-2022.
- Park, J. H., J. S. Kug, Y. M. Yang, H. Oh, J. W. Zhao, and Y. K. Wu, 2022: Role of the Climatological North Pacific High in the North Tropical Atlantic-ENSO Connection. J. Clim., 35, 3215-3226, doi:10.1175/jcli-d-21-0933.1.
- Peña, J. C., and Coauthors, 2022: Low-Frequency Atmospheric Variability Patterns and Synoptic Types Linked to Large Floods in the Lower Ebro River Basin. J. Clim., 35, 2351-2371, doi:10.1175/jcli-d-20-0394.1.
- Peng, Q. H., and Coauthors, 2022: Surface warming-induced global acceleration of upper ocean currents. Science Advances, 8, doi:10.1126/sciadv.abj8394.
- Prein, A. F., J. Coen, and A. Jaye, 2022: The Character and Changing Frequency of Extreme California Fire Weather. Journal of Geophysical Research-Atmospheres, 127, doi:10.1029/2021jd035350.
- Przybylak, R., P. Wyszynski, and A. Arazny, 2022: Comparison of Early-Twentieth-Century Arctic Warming and Contemporary Arctic Warming in the Light of Daily and Subdaily Data. J. Clim., 35, 2269-2290, doi:10.1175/jcli-d-21-0162.1.
- Qiao, P. J., Z. Q. Gong, W. Q. Liu, Y. W. Zhang, and G. L. Feng, 2022: Asymmetrical synchronization of extreme rainfall events in southwest China. International Journal of Climatology, 42, 5935-5948, doi:10.1002/joc.7569.
- Reichen, L., and Coauthors, 2022: A decade of cold Eurasian winters reconstructed for the early 19th century. Nature Communications, 13, doi:10.1038/s41467-022-29677-8.
- Reynolds, D. J., V. R. von Biela, K. H. Dunton, D. C. Douglas, and B. A. Black, 2022: Sclerochronological records of environmental variability and bivalve growth in the Pacific Arctic. Prog Oceanogr, 206, doi:10.1016/j.pocean.2022.102864.
- Roustan, J. B., L. Pineau-Guillou, B. Chapron, N. Raillard, and M. Reinert, 2022: Shift of the storm surge season in Europe due to climate variability. Scientific Reports, 12, doi:10.1038/s41598-022-12356-5.
- Shi, F., C. Sun, A. Guion, Q. Z. Yin, S. Zhao, T. Liu, and Z. T. Guo, 2022: Roman Warm Period and Late Antique Little Ice Age in an Earth System Model Large Ensemble. Journal of Geophysical Research-Atmospheres, 127, doi:10.1029/2021jd035832.
- Stamatis, M., N. Hatzianastassiou, M. B. Korras-Carraca, C. Matsoukas, M. Wild, and I. Vardavas, 2022: Interdecadal Changes of the MERRA-2 Incoming Surface Solar Radiation (SSR) and Evaluation against GEBA & BSRN Stations. Applied Sciences-Basel, 12, doi:10.3390/app121910176.
- Steffelbauer, D. B., R. E. M. Riva, J. S. Timmermans, J. H. Kwakkel, and M. Bakker, 2022: Evidence of regional sea-level rise acceleration for the North Sea. Environmental Research Letters, 17, doi:10.1088/1748-9326/ac753a.
- Sukhdeo, R., P. A. Ullrich, and R. Grotjahn, 2022: Assessing the large-scale drivers of precipitation in the northeastern United States via linear orthogonal decomposition. Climate Dynamics, 59, 3657-3681, doi:10.1007/s00382-022-06289-y.
- Sun, J. Z., and Coauthors, 2022: An online ensemble coupled data assimilation capability for the Community Earth System Model: system design and evaluation. Geoscientific Model Development, 15, 4805-4830, doi:10.5194/gmd-15-4805-2022.
- Sun, L. Y., S. G. Penny, and M. Harrison, 2022: Impacts of the Lagrangian Data Assimilation of Surface Drifters on Estimating Ocean Circulation during the Gulf of Mexico Grand Lagrangian Deployment. Monthly Weather Review, 150, 949-965, doi:10.1175/mwr-d-21-0123.1.
- Sun, Y. B., and Coauthors, 2022: A review of orbital-scale monsoon variability and dynamics in East Asia during the Quaternary. Quaternary Science Reviews, 288, doi:10.1016/j.quascirev.2022.107593.
- Sylla, A., E. S. Gomez, J. Mignot, and J. Lopez-Parages, 2022: Impact of increased resolution on the representation of the Canary upwelling system in climate models. Geoscientific Model Development, 15, 8245-8267, doi:10.5194/gmd-15-8245-2022.
- Thapa, U. K., S. Stevenson, and M. Midhun, 2022: Orbital Forcing Strongly Influences the Poleward Shift of the Spring Himalayan Jet During the Past Millennium. Geophysical Research Letters, 49, doi:10.1029/2021gl095955.
- Tsavkov, E., N. Tsvetanov, V. Shishkova, and M. Panayotov, 2022: First dendrochronological studies of Quercus protoroburoides. Dendrochronologia, 75, doi:10.1016/j.dendro.2022.125984.
- Valipour, M., and J. Dietrich, 2022: Developing ensemble mean models of satellite remote sensing, climate reanalysis, and land surface models. Theoretical and Applied Climatology, 150, 909-926, doi:10.1007/s00704-022-04185-3.
- van der Wiel, K., T. J. Batelaan, and N. Wanders, 2022: Large increases of multi-year droughts in north-western Europe in a warmer climate. Climate Dynamics, doi:10.1007/s00382-022-06373-3.
- Wahl, E., E. Zorita, and A. Hoell, 2022: The Kalman Filter as Post-Processor for Analog Data-Model Assimilation in Paleoclimate Reconstruction. J. Clim., 35, 5501-5518, doi:10.1175/jcli-d-21-0454.1.
- Wang, L., and M. F. Ting, 2022: Stratosphere-Troposphere Coupling Leading to Extended Seasonal Predictability of Summer North Atlantic Oscillation and Boreal Climate. Geophysical Research Letters, 49, doi:10.1029/2021gl096362.
- Webb, E. J., and B. I. Magi, 2022: The Ensemble Oceanic Nino Index. International Journal of Climatology, 42, 5321-5341, doi:10.1002/joc.7535.
- Wethey, D. S., and S. A. Woodin, 2022: Climate change and Arenicola marina: Heat waves and the southern limit of an ecosystem engineer. Estuarine Coastal and Shelf Science, 276, doi:10.1016/j.ecss.2022.108015.
- Wu, C. H., C. J. Shiu, Y. Y. Chen, I. C. Tsai, and S. Y. Lee, 2023: Climatological changes in East Asian winter monsoon circulation in a warmer future. Atmospheric Research, 284, doi:10.1016/j.atmosres.2022.106593.
- Xiao, C. L., C. Qian, A. N. Huang, R. X. Guo, and X. Y. Kuang, 2023: Evaluation of AMIP models from CMIP6 in simulating winter surface air temperature trends over Eurasia during 1998-2012 based on dynamical adjustment. Climate Dynamics, 60, 17-31, doi:10.1007/s00382-022-06295-0.
- Xu, T. F., D. L. Yuan, and J. Wang, 2022: Assessment of the oceanic channel dynamics responsible for the IOD-ENSO precursory teleconnection in CMIP5 climate models. Frontiers in Climate, 4, doi:10.3389/fclim.2022.996343.
- Yang, Y., Q. X. Li, Z. Y. Song, W. B. Sun, and W. J. Dong, 2022: A comparison of global surface temperature variability, extremes and warming trend using reanalysis datasets and CMST-Interim. International Journal of Climatology, 42, 5609-5628, doi:10.1002/joc.7551.
- Yang, Y. M., and Coauthors, 2022: Increased Indian Ocean-North Atlantic Ocean warming chain under greenhouse warming. Nature Communications, 13, doi:10.1038/s41467-022-31676-8.
- Yao, W. J., X. Q. Yan, Y. M. Tang, D. J. Yang, X. X. Tan, X. S. Song, and T. Liu, 2022: Multidecadal Variation in the Seasonal Predictability of Winter PNA and Its Sources. Geophysical Research Letters, 49, doi:10.1029/2022gl099393.
- Yee, M., and J. O. Kaplan, 2022: Drivers of urban heat in Hong Kong over the past 116 years. Urban Climate, 46, doi:10.1016/j.uclim.2022.101308.
- Yu, B., and Coauthors, 2022: Northern Hemisphere Extratropical Cyclone Activity in the Twentieth Century Reanalysis Version 3 (20CRv3) and Its Relationship with Continental Extreme Temperatures. Atmosphere, 13, doi:10.3390/atmos13081166.
- Yu, L. J., S. Y. Zhong, and B. Sun, 2022: Synchronous Variation Patterns of Monthly Sea Ice Anomalies at the Arctic and Antarctic. J. Clim., 35, 2823-2847, doi:10.1175/jcli-d-21-0756.1.
- Yu, L. W., D. Si, X. Y. Shen, X. M. Lang, R. Zhang, and Q. Q. Li, 2023: Impact of Tibetan Plateau vertical heating on the Asian summer monsoon on the interdecadal scale. Atmospheric Science Letters, 24, doi:10.1002/asl.1140.
- Zhang, Y., and Coauthors, 2022: Atmospheric Forcing of the Pacific Meridional Mode: Tropical Pacific-Driven Versus Internal Variability. Geophysical Research Letters, 49, doi:10.1029/2022gl098148.
- Zhao, C. Y., X. Geng, and L. Qi, 2022: Atlantic Multidecadal Oscillation Modulates the Relation of ENSO With the Precipitation in the Central-Western Indian Ocean. Frontiers in Earth Science, 10, doi:10.3389/feart.2022.866241.
- Biswas, S., S. S. Chand, A. J. Dowdy, W. Wright, C. Foale, X. H. Zhao, and A. Deo, 2022: Statistical Calibration of Long-Term Reanalysis Data for Australian Fire Weather Conditions. Journal of Applied Meteorology and Climatology, 61, 729-758, doi:10.1175/jamc-d-21-0034.1.
- Brönnimann, S., 2022: Historical Observations for Improving Reanalyses. Frontiers in Climate, 4, doi:10.3389/fclim.2022.880473.
- Brönnimann, S., and Coauthors, 2022: Influence of warming and atmospheric circulation changes on multidecadal European flood variability. Climate of the Past, 18, 919-933, doi:10.5194/cp-18-919-2022.
- Chen, Y. F., Y. Du, and Z. S. Chen, 2023: Indo-western Pacific Ocean capacitor events recorded by coral proxies in the South China Sea. Palaeogeography Palaeoclimatology Palaeoecology, 609, doi:10.1016/j.palaeo.2022.111315.
- Fox-Hughes, P., and Coauthors, 2022: A review of early severe weather applications of high-resolution regional reanalysis in Australia. Meteorological Applications, 29, doi:10.1002/met.2087.
- Gillespie, I., L. Haimberger, G. P. Compo, and P. W. Thorne, 2023: Assessing homogeneity of land surface air temperature observations using sparse-input reanalyses. International Journal of Climatology, 43, 736-760, doi:10.1002/joc.7822.
- Ginzburg, A. S., G. A. Alexandrov, and A. V. Chernokulsky, 2022: Climatic Criteria of the Need for Preventive Adaptation. Izvestiya Atmospheric and Oceanic Physics, 58, 536-544, doi:10.1134/s0001433822060068.
- Hawkins, E., L. V. Alexander, and R. J. Allan, 2023: Millions of digitized historical sea-level pressure observations rediscovered. Geoscience Data Journal, 10, 385-395, doi:10.1002/gdj3.163.
- Huang, J. Y., Q. X. Li, and Z. Y. Song, 2022: Historical global land surface air apparent temperature and its future changes based on CMIP6 projections. Science of the Total Environment, 816, doi:10.1016/j.scitotenv.2021.151656.
- Ionita, M., V. Nagavciuc, P. Scholz, and M. Dima, 2022: Long-term drought intensification over Europe driven by the weakening trend of the Atlantic Meridional Overturning Circulation. J Hydrol-Reg Stud, 42, doi:10.1016/j.ejrh.2022.101176.
- Labe, Z. M., and E. A. Barnes, 2022: Comparison of Climate Model Large Ensembles With Observations in the Arctic Using Simple Neural Networks. Earth and Space Science, 9, doi:10.1029/2022ea002348.
- Lakkis, S. G., P. O. Canziani, J. O. Rodriquez, and A. E. Yuchechen, 2023: Early meteorological records from Corrientes and Bahia Blanca, Argentina: Initial ACRE-Argentina data rescue and related activities. Geoscience Data Journal, 10, 328-346, doi:10.1002/gdj3.176.
- Lieber, R., A. King, J. Brown, L. Ashcroft, M. Freund, and C. McMichael, 2022: ENSO Teleconnections More Uncertain in Regions of Lower Socioeconomic Development. Geophysical Research Letters, 49, doi:10.1029/2022gl100553.
- Lorrey, A. M., and Coauthors, 2022: Meteorological data rescue: Citizen science lessons learned from Southern Weather Discovery. Patterns, 3, doi:10.1016/j.patter.2022.100495.
- Lu, Z. C., T. B. Zhao, W. C. Zhou, and H. K. Zhao, 2022: Interdecadal Variation of the Antarctic Circumpolar Wave Based on the 20CRV3 Dataset. Atmosphere, 13, doi:10.3390/atmos13050736.
- Mahoney, K., C. McColl, D. M. Hultstrand, W. D. Kappel, B. McCormick, and G. P. Compo, 2022: Blasts from the Past Reimagining Historical Storms with Model Simulations to Modernize Dam Safety and Flood Risk Assessment. Bulletin of the American Meteorological Society, 103, E266-E280, doi:10.1175/bams-d-21-0133.1.
- Mo, R. P., 2022: Prequel to the Stories of Warm Conveyor Belts and Atmospheric Rivers The Moist Tongues Identified by Rossby and His Collaborators in the 1930s. Bulletin of the American Meteorological Society, 103, E1019-E1040, doi:10.1175/bams-d-20-0276.1.
- Nolin, A. F., M. P. Girardin, J. C. Tardif, X. J. Guo, F. Conciatori, and Y. Bergeron, 2022: A 247-year tree-ring reconstruction of spring temperature and relation to spring flooding in eastern boreal Canada. International Journal of Climatology, 42, 6479-6498, doi:10.1002/joc.7608.
- Pan, Z. T., S. Kumar, Y. J. Zhang, and C. H. Shi, 2022: Central Continental Boreal Summer "Warming Holes" Modulated by Atlantic Multidecadal Oscillation Via Low-Level Jets. Journal of Geophysical Research-Atmospheres, 127, doi:10.1029/2021jd035217.
- Pohl, B., A. Sturman, J. Renwick, H. Quénol, N. Fauchereau, A. Lorrey, and J. Pergaud, 2023: Precipitation and temperature anomalies over Aotearoa New Zealand analysed by weather types and descriptors of atmospheric centres of action. International Journal of Climatology, 43, 331-353, doi:10.1002/joc.7762.
- Przybylak, R., P. Wyszynski, and A. Arazny, 2022: Comparison of Early-Twentieth-Century Arctic Warming and Contemporary Arctic Warming in the Light of Daily and Subdaily Data. J. Clim., 35, 2269-2290, doi:10.1175/jcli-d-21-0162.1.
- Reed, E. V., D. M. Thompson, and K. J. Anchukaitis, 2022: Coral-Based Sea Surface Salinity Reconstructions and the Role of Observational Uncertainties in Inferred Variability and Trends. Paleoceanography and Paleoclimatology, 37, doi:10.1029/2021pa004371.
- Shirley, I. A., and Coauthors, 2022: Near-Surface Hydrology and Soil Properties Drive Heterogeneity in Permafrost Distribution, Vegetation Dynamics, and Carbon Cycling in a Sub-Arctic Watershed. Journal of Geophysical Research-Biogeosciences, 127, doi:10.1029/2022jg006864.
- Yang, Y., Q. X. Li, Z. Y. Song, W. B. Sun, and W. J. Dong, 2022: A comparison of global surface temperature variability, extremes and warming trend using reanalysis datasets and CMST-Interim. International Journal of Climatology, 42, 5609-5628, doi:10.1002/joc.7551.
- Yao, W. J., X. Q. Yan, Y. M. Tang, D. J. Yang, X. X. Tan, X. S. Song, and T. Liu, 2022: Multidecadal Variation in the Seasonal Predictability of Winter PNA and Its Sources. Geophysical Research Letters, 49, doi:10.1029/2022gl099393.
- Yu, B., and Coauthors, 2022: Northern Hemisphere Extratropical Cyclone Activity in the Twentieth Century Reanalysis Version 3 (20CRv3) and Its Relationship with Continental Extreme Temperatures. Atmosphere, 13, doi:10.3390/atmos13081166.
- Zaplotnik, Z., M. Pikovnik, and L. Boljka, 2022: Recent Hadley Circulation Strengthening: A Trend or Multidecadal Variability. J. Clim., 35, 4157-4176, doi:10.1175/jcli-d-21-0204.1.
2021
Compo et al. 2011- Abatzoglou, J. T., D. E. Rupp, L. W. O'Neill, and M. Sadegh, 2021: Compound Extremes Drive the Western Oregon Wildfires of September 2020. Geophysical Research Letters, 48, doi:10.1029/2021gl092520.
- Agrawal, S., C. R. Ferguson, L. Bosart, and D. A. Burrows, 2021: Teleconnections Governing the Interannual Variability of Great Plains Low-Level Jets in May. J. Clim., 34, 4785-4802, doi:10.1175/jcli-d-20-0451.1.
- Alexandrov, G. A., V. A. Ginzburg, G. E. Insarov, and A. A. Romanovskaya, 2021: CMIP6 model projections leave no room for permafrost to persist in Western Siberia under the SSP5-8.5 scenario. Climatic Change, 169, doi:10.1007/s10584-021-03292-w.
- Arthun, M., R. C. J. Wills, H. L. Johnson, L. Chafik, and H. R. Langehaug, 2021: Mechanisms of Decadal North Atlantic Climate Variability and Implications for the Recent Cold Anomaly. J. Clim., 34, 3421-3439, doi:10.1175/jcli-d-20-0464.1.
- Aubry, T. J., and Coauthors, 2021: The Independent Volcanic Eruption Source Parameter Archive (IVESPA, version 1.0): A new observational database to support explosive eruptive column model validation and development. Journal of Volcanology and Geothermal Research, 417, doi:10.1016/j.jvolgeores.2021.107295.
- Baatz, R., and Coauthors, 2021: Reanalysis in Earth System Science: Toward Terrestrial Ecosystem Reanalysis. Reviews of Geophysics, 59, doi:10.1029/2020rg000715.
- Balting, D. F., and Coauthors, 2021: Large-scale climate signals of a European oxygen isotope network from tree rings. Climate of the Past, 17, 1005-1023, doi:10.5194/cp-17-1005-2021.
- Bao, X. H., F. Q. Zhang, Y. Zhao, and Y. L. Chen, 2021: The Impact of the Observation Data Assimilation on Atmospheric Reanalyses over Tibetan Plateau and Western Yunnan-Guizhou Plateau. Atmosphere, 12, doi:10.3390/atmos12010038.
- Bell, B., and Coauthors, 2021: The ERA5 global reanalysis: Preliminary extension to 1950. Quarterly Journal of the Royal Meteorological Society, 147, 4186-4227, doi:10.1002/qj.4174.
- Benito, G., O. Castillo, J. A. Ballesteros-Canovas, M. Machado, and M. Barriendos, 2021: Enhanced flood hazard assessment beyond decadal climate cycles based on centennial historical data (Duero basin, Spain). Hydrology and Earth System Sciences, 25, 6107-6132, doi:10.5194/hess-25-6107-2021.
- Blaker, A. T., M. Joshi, B. Sinha, D. P. Stevens, R. S. Smith, and J. J. M. Hirschi, 2021: FORTE 2.0: a fast, parallel and flexible coupled climate model. Geoscientific Model Development, 14, 275-293, doi:10.5194/gmd-14-275-2021.
- Blanc, A., J. Blanchet, and J. D. Creutin, 2022: Characterizing large-scale circulations driving extreme precipitation in the Northern French Alps. International Journal of Climatology, 42, 465-480, doi:10.1002/joc.7254.
- Bodai, T., G. Drotos, K. J. Ha, J. Y. Lee, and E. S. Chung, 2021: Nonlinear Forced Change and Nonergodicity: The Case of ENSO-Indian Monsoon and Global Precipitation Teleconnections. Frontiers in Earth Science, 8, doi:10.3389/feart.2020.599785.
- Bokuchava, D. D., and V. A. Semenov, 2021: Mechanisms of the Early 20th Century Warming in the Arctic. Earth-Science Reviews, 222, doi:10.1016/j.earscirev.2021.103820.
- Bonnafous, L., and U. Lall, 2021: Space-time clustering of climate extremes amplify global climate impacts, leading to fat-tailed risk. Natural Hazards and Earth System Sciences, 21, 2277-2284, doi:10.5194/nhess-21-2277-2021.
- Bourdeau-Goulet, S. C., and E. Hassanzadeh, 2021: Comparisons Between CMIP5 and CMIP6 Models: Simulations of Climate Indices Influencing Food Security, Infrastructure Resilience, and Human Health in Canada. Earths Future, 9, doi:10.1029/2021ef001995.
- Bui, M. T., J. M. Lu, and L. M. Nie, 2021: Evaluation of the Climate Forecast System Reanalysis weather data for the hydrological model in the Arctic watershed Malselv. Journal of Water and Climate Change, 12, 3481-3504, doi:10.2166/wcc.2021.346.
- Caillouet, L., J. P. Vidal, E. Sauquet, A. Devers, C. Lauvernet, B. Graff, and O. Vannier, 2021: Inter-comparison of extreme low-flow events in France since 1871. Lhb-Hydroscience Journal, 107, doi:10.1080/00186368.2021.1914463.
- Carrasco, V. M. S., J. M. Vaquero, A. Ballesteros, M. Cruz Gallego, and J. A. Garcia, 2021: The tornado of Talavera de la Reina on September 3, 1880. Atmosfera, 34, 301-309, doi:10.20937/atm.52830.
- Ceron, W. L., R. V. Andreoli, M. T. Kayano, and A. Avila-Diaz, 2021: Role of the eastern Pacific-Caribbean Sea SST gradient in the Choco low-level jet variations from 1900-2015. Climate Research, 83, 61-74, doi:10.3354/cr01633.
- Ceron, W. L., M. T. Kayano, R. V. Andreoli, A. Avila-Diaz, I. P. de Souza, and R. A. F. Souza, 2021: Pacific and Atlantic Multidecadal Variability Relations with the Choco and Caribbean Low-Level Jets during the 1900-2015 Period. Atmosphere, 12, doi:10.3390/atmos12091120.
- Chai, R. F., and Coauthors, 2021: Human-caused long-term changes in global aridity. Npj Climate and Atmospheric Science, 4, doi:10.1038/s41612-021-00223-5.
- Chakravorty, S., R. C. Perez, C. Gnanaseelan, and B. T. Anderson, 2021: Revisiting the Recharge and Discharge Processes for Different Flavors of El Nino. Journal of Geophysical Research-Oceans, 126, doi:10.1029/2020jc017075.
- Chen, S. F., R. G. Wu, and W. Chen, 2021: Influence of North Atlantic sea surface temperature anomalies on springtime surface air temperature variation over Eurasia in CMIP5 models. Climate Dynamics, 57, 2669-2686, doi:10.1007/s00382-021-05826-5.
- Chimani, B., I. Auer, M. Prohom, M. Nadbath, A. Paul, and D. Rasol, 2022: Data rescue in selected countries in connection with the EUMETNET DARE activity. Geoscience Data Journal, 9, 187-200, doi:10.1002/gdj3.128.
- Chinta, V., Z. S. Chen, Y. Du, and J. S. Chowdary, 2022: Influence of the Interdecadal Pacific Oscillation on South Asian and East Asian summer monsoon rainfall in CMIP6 models. Climate Dynamics, 58, 1791-1809, doi:10.1007/s00382-021-05992-6.
- Chun, K. P., and Coauthors, 2021: Identifying drivers of streamflow extremes in West Africa to inform a nonstationary prediction model. Weather and Climate Extremes, 33, doi:10.1016/j.wace.2021.100346.
- Codilean, A. T., and Coauthors, 2021: Controls on denudation along the East Australian continental margin. Earth-Science Reviews, 214, doi:10.1016/j.earscirev.2021.103543.
- Coffel, E. D., and J. S. Mankin, 2021: Thermal power generation is disadvantaged in a warming world. Environmental Research Letters, 16, doi:10.1088/1748-9326/abd4a8.
- Dahri, Z. H., and Coauthors, 2021: Spatio-temporal evaluation of gridded precipitation products for the high-altitude Indus basin. International Journal of Climatology, 41, 4283-4306, doi:10.1002/joc.7073.
- Dangendorf, S., T. Frederikse, L. Chafik, J. M. Klinck, T. Ezer, and B. D. Hamlington, 2021: Data-driven reconstruction reveals large-scale ocean circulation control on coastal sea level. Nature Climate Change, 11, 514-+, doi:10.1038/s41558-021-01046-1.
- de Oliveira, M. M. F., J. L. F. de Oliveira, P. J. F. Fernandes, E. Gilleland, and N. F. F. Ebecken, 2021: Extreme climatic characteristics near the coastline of the southeast region of Brazil in the last 40 years. Theoretical and Applied Climatology, 146, 657-674, doi:10.1007/s00704-021-03711-z.
- Deepa, J. S., and C. Gnanaseelan, 2021: The decadal sea level variability observed in the Indian Ocean tide gauge records and its association with global climate modes. Global and Planetary Change, 198, doi:10.1016/j.gloplacha.2021.103427.
- Devers, A., J. P. Vidal, C. Lauvernet, and O. Vannier, 2021: FYRE Climate: a high-resolution reanalysis of daily precipitation and temperature in France from 1871 to 2012. Climate of the Past, 17, 1857-1879, doi:10.5194/cp-17-1857-2021.
- Dey, R., M. Bador, L. V. Alexander, and S. C. Lewis, 2021: The drivers of extreme rainfall event timing in Australia. International Journal of Climatology, 41, 6654-6673, doi:10.1002/joc.7218.
- Ding, Z. M., and R. G. Wu, 2021: Seasonally changing contribution of sea ice and snow cover to uncertainty in multi-decadal Eurasian surface air temperature trends based on CESM simulations. Climate Dynamics, 57, 917-932, doi:10.1007/s00382-021-05746-4.
- Diodato, N., I. Gomara, A. Baronetti, S. Fratianni, and G. Bellocchi, 2021: Reconstruction of erosivity density in northwest Italy since 1701. Hydrological Sciences Journal-Journal Des Sciences Hydrologiques, 66, 1185-1196, doi:10.1080/02626667.2021.1918696.
- Dong, T. Y., and W. J. Dong, 2021: Evaluation of extreme precipitation over Asia in CMIP6 models. Climate Dynamics, 57, 1751-1769, doi:10.1007/s00382-021-05773-1.
- Dosio, A., I. Pinto, C. Lennard, M. B. Sylla, C. Jack, and G. Nikulin, 2021: What Can We Know About Recent Past Precipitation Over Africa? Daily Characteristics of African Precipitation From a Large Ensemble of Observational Products for Model Evaluation. Earth and Space Science, 8, doi:10.1029/2020ea001466.
- Duan, J., and Coauthors, 2021: Rapid Sea Level Rise in the Southern Hemisphere Subtropical Oceans. J. Clim., 34, 9401-9423, doi:10.1175/jcli-d-21-0248.1.
- Eade, R., D. B. Stephenson, A. A. Scaife, and D. M. Smith, 2022: Quantifying the rarity of extreme multi-decadal trends: how unusual was the late twentieth century trend in the North Atlantic Oscillation? Climate Dynamics, 58, 1555-1568, doi:10.1007/s00382-021-05978-4.
- Emanuel, K., 2021: Atlantic tropical cyclones downscaled from climate reanalyses show increasing activity over past 150 years. Nature Communications, 12, doi:10.1038/s41467-021-27364-8.
- Ezer, T., and S. Dangendorf, 2021: Variability and upward trend in the kinetic energy of western boundary currents over the last century: impacts from barystatic and dynamic sea level change. Climate Dynamics, 57, 2351-2373, doi:10.1007/s00382-021-05808-7.
- Fan, F. X., R. P. Lin, X. H. Fang, F. Xue, F. Zheng, and J. Zhu, 2021: Influence of the Eastern Pacific and Central Pacific Types of ENSO on the South Asian Summer Monsoon. Advances in Atmospheric Sciences, 38, 12-28, doi:10.1007/s00376-020-0055-1.
- Fang, J. Y., T. Wahl, J. Fang, X. Sun, F. Kong, and M. Liu, 2021: Compound flood potential from storm surge and heavy precipitation in coastal China: dependence, drivers, and impacts. Hydrology and Earth System Sciences, 25, 4403-4416, doi:10.5194/hess-25-4403-2021.
- Feliks, Y., J. Small, and M. Ghil, 2021: Global oscillatory modes in high-end climate modeling and reanalyses. Climate Dynamics, 57, 3385-3411, doi:10.1007/s00382-021-05872-z.
- Feng, X. F., and Coauthors, 2021: A Multidecadal-Scale Tropically Driven Global Teleconnection over the Past Millennium and Its Recent Strengthening. J. Clim., 34, 2549-2565, doi:10.1175/jcli-d-20-0216.1.
- Feng, X. F., and L. G. Wu, 2021: The Contribution of Internal Variability to Asian Midlatitude Warming. J. Clim., 34, 2429-2439, doi:10.1175/jcli-d-20-0231.1.
- Feser, F., O. Krueger, K. Woth, and L. van Garderen, 2021: North Atlantic Winter Storm Activity in Modern Reanalyses and Pressure-Based Observations. J. Clim., 34, 2411-2428, doi:10.1175/jcli-d-20-0529.1.
- Freund, M. B., A. G. Marshall, M. C. Wheeler, and J. N. Brown, 2021: Central Pacific El Nino as a Precursor to Summer Drought-Breaking Rainfall Over Southeastern Australia. Geophysical Research Letters, 48, doi:10.1029/2020gl091131.
- Gagnon-Poire, A., P. Brigode, P. Francus, D. Fortin, P. Lajeunesse, H. Dorion, and A. P. Trottier, 2021: Reconstructing past hydrology of eastern Canadian boreal catchments using clastic varved sediments and hydro-climatic modelling: 160 years of fluvial inflows. Climate of the Past, 17, 653-673, doi:10.5194/cp-17-653-2021.
- Galbraith, P. S., P. Larouche, and C. Caverhill, 2021: A Sea-Surface Temperature Homogenization Blend for the Northwest Atlantic. Canadian Journal of Remote Sensing, 47, 554-568, doi:10.1080/07038992.2021.1924645.
- Gallego, D., R. Garcia-Herrera, T. Losada, E. Mohino, and B. R. de Fonseca, 2021: A Shift in the Wind Regime of the Southern End of the Canary Upwelling System at the Turn of the 20th Century. Journal of Geophysical Research-Oceans, 126, doi:10.1029/2020jc017093.
- Garrison, C., C. Kilburn, D. Smart, and S. Edwards, 2021: The blue suns of 1831: was the eruption of Ferdinandea, near Sicily, one of the largest volcanic climate forcing events of we nineteenth century? Climate of the Past, 17, 2607-2632, doi:10.5194/cp-17-2607-2021.
- Gauthier, N., K. J. Anchukaitis, and B. Coulthard, 2022: Pattern-based downscaling of snowpack variability in the western United States. Climate Dynamics, 58, 3225-3241, doi:10.1007/s00382-021-06094-z.
- Gergis, J., Z. Baillie, S. Ingallina, L. Ashcroft, and T. Ellwood, 2021: A historical climate dataset for southwestern Australia, 1830-1875. International Journal of Climatology, 41, 4898-4919, doi:10.1002/joc.7105.
- Gil-Guirado, S., A. Perez-Morales, D. Pino, J. C. Pena, and F. L. Martinez, 2022: Flood impact on the Spanish Mediterranean coast since 1960 based on the prevailing synoptic patterns. Science of the Total Environment, 807, doi:10.1016/j.scitotenv.2021.150777.
- Gong, Z. Q., Y. S. Liu, C. Sun, J. Zhang, J. P. Li, and C. M. Shi, 2021: Linking AMOC Variations With the Multidecadal Seesaw in Tropical Cyclone Activity Between Eastern North Pacific and Atlantic. Journal of Geophysical Research-Oceans, 126, doi:10.1029/2021jc017308.
- Gray, J. L., J. B. D. Jaffres, D. C. Verdon-Kidd, M. G. Hewson, J. M. Clarke, A. Pepler, and N. B. English, 2021: A comparison of the MATCHES and NCEP1 databases for use in Australian east coast low studies. Weather and Climate Extremes, 34, doi:10.1016/j.wace.2021.100400.
- Gutenstein, M., K. Fennig, M. Schroder, T. Trent, S. Bakan, J. B. Roberts, and F. R. Robertson, 2021: Intercomparison of freshwater fluxes over ocean and investigations into water budget closure. Hydrology and Earth System Sciences, 25, 121-146, doi:10.5194/hess-25-121-2021.
- Han, S. Z., and J. Q. Sun, 2021: A skillful prediction scheme for April precipitation over central East China. Atmospheric Research, 261, doi:10.1016/j.atmosres.2021.105737.
- Haslinger, K., M. Hofstatter, W. Schoner, and G. Bloschl, 2021: Changing summer precipitation variability in the Alpine region: on the role of scale dependent atmospheric drivers. Climate Dynamics, 57, 1009-1021, doi:10.1007/s00382-021-05753-5.
- He, K. J., and Coauthors, 2021: Effect of preceding soil moisture-snow cover anomalies around Turan Plain on June precipitation over the southern Yangtze River valley. Atmospheric Research, 264, doi:10.1016/j.atmosres.2021.105853.
- Helama, S., and Coauthors, 2021: Recurrent transitions to Little Ice Age-like climatic regimes over the Holocene. Climate Dynamics, 56, 3817-3833, doi:10.1007/s00382-021-05669-0.
- Hiraga, Y., Y. Iseri, M. D. Warner, C. D. Frans, A. M. Duren, J. F. England, and M. L. Kavvas, 2021: Estimation of Long-duration Maximum Precipitation during a winter season for large basins dominated by Atmospheric Rivers using a Numerical Weather Model. Journal of Hydrology, 598, doi:10.1016/j.jhydrol.2021.126224.
- Hochet, A., G. Dodet, F. Ardhuin, M. Hemer, and I. Young, 2021: Sea State Decadal Variability in the North Atlantic: A Review. Climate, 9, doi:10.3390/cli9120173.
- Hoerling, M., L. Smith, X. W. Quan, J. Eischeid, J. Barsugli, and H. F. Diaz, 2021: Explaining the Spatial Pattern of US Extreme Daily Precipitation Change. J. Clim., 34, 2759-2775, doi:10.1175/jcli-d-20-0666.1.
- Hong, X., and J. Li, 2021: A beta-advection typhoon track model and its application for typhoon hazard assessment. Journal of Wind Engineering and Industrial Aerodynamics, 208, doi:10.1016/j.jweia.2020.104439.
- Horsburgh, K., I. D. Haigh, J. Williams, M. De Dominicis, J. Wolf, A. Inayatillah, and D. Byrne, 2021: "Grey swan" storm surges pose a greater coastal flood hazard than climate change. Ocean Dynamics, 71, 715-730, doi:10.1007/s10236-021-01453-0.
- Horton, P., 2022: Analogue methods and ERA5: Benefits and pitfalls. International Journal of Climatology, 42, 4078-4096, doi:10.1002/joc.7484.
- Hyncica, M., and R. Huth, 2022: Temporal evolution of relationships between temperature and circulation modes in five reanalyses. International Journal of Climatology, 42, 4391-4404, doi:10.1002/joc.7474.
- Imfeld, N., L. Haimberger, A. Sterin, Y. Brugnara, and S. Bronnimann, 2021: Intercomparisons, error assessments, and technical information on historical upper-air measurements. Earth System Science Data, 13, 2471-2485, doi:10.5194/essd-13-2471-2021.
- Jacques-Coper, M., D. Veloso-Aguila, C. Segura, and A. Valencia, 2021: Intraseasonal teleconnections leading to heat waves in central Chile. International Journal of Climatology, 41, 4712-4731, doi:10.1002/joc.7096.
- Janicke, L., and Coauthors, 2021: Assessment of Tidal Range Changes in the North Sea From 1958 to 2014. Journal of Geophysical Research-Oceans, 126, doi:10.1029/2020jc016456.
- Jeong, J., and Coauthors, 2021: Using the International Tree-Ring Data Bank (ITRDB) records as century-long benchmarks for global land-surface models. Geoscientific Model Development, 14, 5891-5913, doi:10.5194/gmd-14-5891-2021.
- Jia, B. H., and Coauthors, 2021: CAS-LSM Datasets for the CMIP6 Land Surface Snow and Soil Moisture Model Intercomparison Project. Advances in Atmospheric Sciences, 38, 862-874, doi:10.1007/s00376-021-0293-x.
- Jiang, H., W. H. Xu, S. Yang, Y. N. Zhu, Z. J. Zhou, and J. Liao, 2021: Development of an Integrated Global Land Surface Dataset from 1901 to 2018. Journal of Meteorological Research, 35, 789-798, doi:10.1007/s13351-021-1058-2. Jing, B. Y., H. H. Tong, Y. D. Zhu, and Acm, 2021: Network of Tensor Time Series. 30th World Wide Web Conference (WWW), Electr Network, 2425-2437.
- Jones, E., A. A. Wing, and R. Parfitt, 2021: A Global Perspective of Tropical Cyclone Precipitation in Reanalyses. J. Clim., 34, 8461-8480, doi:10.1175/jcli-d-20-0892.1.
- Joshi, M. K., M. A. Abid, and F. Kucharski, 2021: The Role of an Indian Ocean Heating Dipole in the ENSO Teleconnection to the North Atlantic European Region in Early Winter during the Twentieth Century in Reanalysis and CMIP5 Simulations. J. Clim., 34, 1047-1060, doi:10.1175/jcli-d-20-0269.1.
- Kajtar, J. B., A. Santoso, M. Collins, A. S. Taschetto, M. H. England, and L. M. Frankcombe, 2021: CMIP5 Intermodel Relationships in the Baseline Southern Ocean Climate System and With Future Projections. Earths Future, 9, doi:10.1029/2020ef001873.
- Karimi, A. A., M. Bagherbandi, and M. Horemuz, 2021: Multidecadal Sea Level Variability in the Baltic Sea and Its Impact on Acceleration Estimations. Frontiers in Marine Science, 8, doi:10.3389/fmars.2021.702512.
- Karmalkar, A. V., and R. M. Horton, 2021: Drivers of exceptional coastal warming in the northeastern United States. Nature Climate Change, 11, 854-+, doi:10.1038/s41558-021-01159-7.
- Kim, D. I., D. W. Han, and T. Lee, 2021: Reanalysis Product-Based Nonstationary Frequency Analysis for Estimating Extreme Design Rainfall. Atmosphere, 12, doi:10.3390/atmos12020191.
- Kim, W. M., and C. C. Raible, 2021: Dynamies of the Mediterranean droughts from 850 to 2099 CE in the Community Earth System Model. Climate of the Past, 17, 887-911, doi:10.5194/cp-17-887-2021.
- Klotzbach, P. J., C. J. Schreck, G. P. Compo, S. G. Bowen, E. J. Gibney, E. C. J. Oliver, and M. M. Bell, 2021: The Record-Breaking 1933 Atlantic Hurricane Season. Bulletin of the American Meteorological Society, 102, E446-E463, doi:10.1175/bams-d-19-0330.1.
- Knoflach, B., and Coauthors, 2021: Modelling of Vegetation Dynamics from Satellite Time Series to Determine Proglacial Primary Succession in the Course of Global Warming-A Case Study in the Upper Martell Valley (Eastern Italian Alps). Remote Sensing, 13, doi:10.3390/rs13214450.
- Labe, Z. M., and E. A. Barnes, 2021: Detecting Climate Signals Using Explainable AI With Single-Forcing Large Ensembles. Journal of Advances in Modeling Earth Systems, 13, doi:10.1029/2021ms002464.
- Le Bras, I., F. Straneo, M. Muilwijk, L. H. Smedsrud, F. L. Li, M. S. Lozier, and N. P. Holliday, 2021: How Much Arctic Fresh Water Participates in the Subpolar Overturning Circulation? J Phys Oceanogr, 51, 955-973, doi:10.1175/jpo-d-20-0240.1.
- Lee, J., and Coauthors, 2021: Robust Evaluation of ENSO in Climate Models: How Many Ensemble Members Are Needed? Geophysical Research Letters, 48, doi:10.1029/2021gl095041.
- Lee, J., K. R. Sperber, P. J. Gleckler, K. E. Taylor, and C. J. W. Bonfils, 2021: Benchmarking Performance Changes in the Simulation of Extratropical Modes of Variability across CMIP Generations. J. Clim., 34, 6945-6969, doi:10.1175/jcli-d-20-0832-1.
- Lejk, A. M., S. Smolinski, G. Radtke, and A. Martyniak, 2021: Higher growth variability and stronger responses to temperature changes in wild than hatchery-reared sea trout (Salmo trutta L.). Ecology and Evolution, 11, 10207-10224, doi:10.1002/ece3.7827.
- Li, J., and X. Hong, 2021: Typhoon hazard analysis based on the probability density evolution theory. Journal of Wind Engineering and Industrial Aerodynamics, 219, doi:10.1016/j.jweia.2021.104796.
- Li, J. P., and Coauthors, 2022: Influence of the NAO on Wintertime Surface Air Temperature over East Asia: Multidecadal Variability and Decadal Prediction. Advances in Atmospheric Sciences, 39, 625-642, doi:10.1007/s00376-021-1075-1.
- Li, L. F., M. S. Lozier, and F. L. Li, 2022: Century-long cooling trend in subpolar North Atlantic forced by atmosphere: an alternative explanation. Climate Dynamics, 58, 2249-2267, doi:10.1007/s00382-021-06003-4.
- Li, R. C., and Coauthors, 2021: Simulated response of the active layer thickness of permafrost to climate change. Atmospheric and Oceanic Science Letters, 14, doi:10.1016/j.aosl.2020.100007.
- Li, T., and Coauthors, 2021: Refining the empirical global pressure and temperature model with the ERA5 reanalysis and radiosonde data. Journal of Geodesy, 95, doi:10.1007/s00190-021-01478-9.
- Li, X. C., and Coauthors, 2021: Local and remote SST variability contribute to the westward shift of the Pacific Walker circulation during 1979-2015. Geoscience Letters, 8, doi:10.1186/s40562-021-00180-0.
- Li, Y., Q. L. Chen, N. Xing, Z. G. Cheng, Y. L. Qi, F. Feng, and M. G. Li, 2021: Long-Term Trend of Equatorial Atlantic Zonal Sea Surface Temperature Gradient Linked to the Tropical Pacific Cold Tongue Mode Under Global Warming. Journal of Geophysical Research-Oceans, 126, doi:10.1029/2020jc017132.
- Liao, C. F., J. Ma, H. M. Xu, L. Wang, and H. Guo, 2021: The Impact of the Atlantic Multidecadal Oscillation on the Interannual Relationship Between the Storm Track and SST Over the North Atlantic in Spring. Atmosphere-Ocean, 59, 152-164, doi:10.1080/07055900.2021.1927665.
- Ling, X. L., and Coauthors, 2021: Comprehensive evaluation of satellite-based and reanalysis soil moisture products using in situ observations over China. Hydrology and Earth System Sciences, 25, 4209-4229, doi:10.5194/hess-25-4209-2021.
- Liu, F. Y., W. J. Zhang, F. F. Jin, and S. Q. Hu, 2021: Decadal Modulation of the ENSO-Indian Ocean Basin Warming Relationship during the Decaying Summer by the Interdecadal Pacific Oscillation. J. Clim., 34, 2685-2699, doi:10.1175/jcli-d-20-0457.1.
- Liu, K. S., J. C. L. Chan, and H. Kubota, 2021: Meridional oscillation of tropical cyclone activity in the western North Pacific during the past 110 years. Climatic Change, 164, doi:10.1007/s10584-021-02983-8.
- Liu, Y. S., C. Sun, Z. Q. Gong, J. P. Li, and Z. Shi, 2022: Multidecadal seesaw in cold wave frequency between central Eurasia and Greenland and its relation to the Atlantic Multidecadal Oscillation. Climate Dynamics, 58, 1403-1418, doi:10.1007/s00382-021-05967-7.
- Liu, Y. X., L. Zhuo, M. Pregnolato, and D. W. Han, 2022: An assessment of statistical interpolation methods suited for gridded rainfall datasets. International Journal of Climatology, 42, 2754-2772, doi:10.1002/joc.7389.
- Lubken, F. J., G. Baumgarten, and U. Berger, 2021: Long term trends of mesopheric ice layers: A model study. Journal of Atmospheric and Solar-Terrestrial Physics, 214, doi:10.1016/j.jastp.2020.105378.
- Lupikasza, E. B., T. Niedzwiedz, R. Przybylak, and O. Nordli, 2021: Importance of regional indices of atmospheric circulation for periods of warming and cooling in Svalbard during 1920-2018. International Journal of Climatology, 41, 3481-3502, doi:10.1002/joc.7031.
- Mahendra, N., J. S. Chowdary, P. Darshana, P. Sunitha, A. Parekh, and C. Gnanaseelan, 2021: Interdecadal modulation of interannual ENSO-Indian summer monsoon rainfall teleconnections in observations and CMIP6 models: Regional patterns. International Journal of Climatology, 41, 2528-2552, doi:10.1002/joc.6973.
- Maroon, E. A., S. G. Yeager, G. Danabasoglu, and N. Rosenbloom, 2021: Was the 2015 North Atlantic Subpolar Cold Anomaly Predictable? J. Clim., 34, 5403-5423, doi:10.1175/jcli-d-20-0750.1.
- Materia, S., and Coauthors, 2022: Summer temperature response to extreme soil water conditions in the Mediterranean transitional climate regime. Climate Dynamics, 58, 1943-1963, doi:10.1007/s00382-021-05815-8.
- McKenna, C. M., and A. C. Maycock, 2021: Sources of Uncertainty in Multimodel Large Ensemble Projections of the Winter North Atlantic Oscillation. Geophysical Research Letters, 48, doi:10.1029/2021gl093258.
- Medvedev, I., and A. Medvedeva, 2021: Seasonal and Decadal Variations of the Variance of the Synoptic and Mesoscale Sea Level Variability in the Baltic Sea. Water, 13, doi:10.3390/w13131785.
- Mengel, M., S. Treu, S. Lange, and K. Frieler, 2021: ATTRICI v1.1-counterfactual climate for impact attribution. Geoscientific Model Development, 14, 5269-5284, doi:10.5194/gmd-14-5269-2021.
- Miao, J. P., and D. B. Jiang, 2021: Multidecadal Variations in the East Asian Winter Monsoon and Their Relationship with the Atlantic Multidecadal Oscillation since 1850. J. Clim., 34, 7525-7539, doi:10.1175/jcli-d-21-0073.1.
- Mohanty, M. P., and S. P. Simonovic, 2021: Fidelity of reanalysis datasets in floodplain mapping: Investigating performance at inundation level over large regions. Journal of Hydrology, 597, doi:10.1016/j.jhydrol.2020.125757.
- Molina, M. O., C. Gutierrez, and E. Sanchez, 2021: Comparison of ERA5 surface wind speed climatologies over Europe with observations from the HadISD dataset. International Journal of Climatology, 41, 4864-4878, doi:10.1002/joc.7103.
- Murphy, L. N., J. M. Klavans, A. C. Clement, and M. A. Cane, 2021: Investigating the Roles of External Forcing and Ocean Circulation on the Atlantic Multidecadal SST Variability in a Large Ensemble Climate Model Hierarchy. J. Clim., 34, 4835-4849, doi:10.1175/jcli-d-20-0167.1.
- Nagashima, K., J. Addison, T. Irino, T. Omori, K. Yoshimura, and N. Harada, 2022: Aleutian Low variability for the last 7500 years and its relation to the Westerly Jet. Quaternary Research, 108, 161-179, doi:10.1017/qua.2020.116.
- Ng, B., W. J. Cai, T. Cowan, and D. H. Bi, 2021: Impacts of Low-Frequency Internal Climate Variability and Greenhouse Warming on El Nino-Southern Oscillation. J. Clim., 34, 2205-2218, doi:10.1175/jcli-d-20-0232.1.
- O'Kane, T. J., and Coauthors, 2021: CAFE60v1: A 60-Year Large Ensemble Climate Reanalysis. Part I: System Design, Model Configuration, and Data Assimilation. J. Clim., 34, 5153-5169, doi:10.1175/jcli-d-20-0974.1.
- O'Kane, T. J., and Coauthors, 2021: CAFE60v1: A 60-Year Large Ensemble Climate Reanalysis. Part II: Evaluation. J. Clim., 34, 5171-5194, doi:10.1175/jcli-d-20-0518.1.
- O'Reilly, C. H., D. J. Befort, A. Weisheimer, T. Woollings, A. Ballinger, and G. Hegerl, 2021: Projections of northern hemisphere extratropical climate underestimate internal variability and associated uncertainty. Communications Earth & Environment, 2, doi:10.1038/s43247-021-00268-7.
- Oh, J., and Y. Jung, 2021: Local climate impacts of dipole-like sea surface temperature oscillations in the Southern Hemisphere. Journal of Water and Climate Change, 12, 311-324, doi:10.2166/wcc.2020.113.
- Osman, M. B., S. Coats, S. B. Das, J. R. McConnell, and N. Chellman, 2021: North Atlantic jet stream projections in the context of the past 1,250 years. Proceedings of the National Academy of Sciences of the United States of America, 118, doi:10.1073/pnas.2104105118.
- Osman, M. B., and Coauthors, 2021: Abrupt Common Era hydroclimate shifts drive west Greenland ice cap change. Nature Geoscience, 14, 756-+, doi:10.1038/s41561-021-00818-w.
- Otto-Bliesner, B. L., and Coauthors, 2021: Large-scale features of Last Interglacial climate: results from evaluating the lig127k simulations for the Coupled Model Intercomparison Project (CMIP6)-Paleoclimate Modeling Intercomparison Project (PMIP4). Climate of the Past, 17, 63-94, doi:10.5194/cp-17-63-2021.
- Perkins, W. A., and G. J. Hakim, 2021: Coupled Atmosphere-Ocean Reconstruction of the Last Millennium Using Online Data Assimilation. Paleoceanography and Paleoclimatology, 36, doi:10.1029/2020pa003959.
- Pettit, J. L., and Coauthors, 2021: Both Cyclone-induced and Convective Storms Drive Disturbance Patterns in European Primary Beech Forests. Journal of Geophysical Research-Atmospheres, 126, doi:10.1029/2020jd033929.
- Pineau-Guillou, L., P. Lazure, and G. Woppelmann, 2021: Large-scale changes of the semidiurnal tide along North Atlantic coasts from 1846 to 2018. Ocean Science, 17, 17-34, doi:10.5194/os-17-17-2021.
- Planton, Y. Y., and Coauthors, 2021: Evaluating Climate Models with the CLIVAR 2020 ENSO Metrics Package. Bulletin of the American Meteorological Society, 102, E193-E217, doi:10.1175/bams-d-19-0337.1.
- Poletti, S., and I. Staffell, 2021: Understanding New Zealand's wind resources as a route to 100% renewable electricity. Renewable Energy, 170, 449-461, doi:10.1016/j.renene.2021.01.053.
- Power, S., and Coauthors, 2021: Decadal climate variability in the tropical Pacific: Characteristics, causes, predictability, and prospects. Science, 374, 48-+, doi:10.1126/science.aay9165.
- Prado, L. F., I. Wainer, and R. B. de Souza, 2021: The Representation of the Southern Annular Mode Signal in the Brazilian Earth System Model. Atmosphere, 12, doi:10.3390/atmos12081045.
- Prado, L. F., I. Wainer, E. Yokoyama, M. Khodri, and J. Garnier, 2021: Changes in summer precipitation variability in central Brazil over the past eight decades. International Journal of Climatology, 41, 4171-4186, doi:10.1002/joc.7065.
- Prado-Cabrero, A., and J. M. Nolan, 2021: Omega-3 nutraceuticals, climate change and threats to the environment: The cases of Antarctic krill and Calanus finmarchicus. Ambio, 50, 1184-1199, doi:10.1007/s13280-020-01472-z.
- Qi, L., 2022: Decadal shift of the interannual relationship between western North Pacific tropical cyclone genesis frequency and South China Sea monsoon trough around 1980s. International Journal of Climatology, 42, 4289-4299, doi:10.1002/joc.7465.
- Raicich, F., and R. R. Colucci, 2021: A mean-sea-level pressure time series for Trieste, Italy (1841-2018). Earth System Science Data, 13, 3363-3377, doi:10.5194/essd-13-3363-2021.
- Rajesh, P. V., B. N. Goswami, B. A. Choudhury, and Y. Zahan, 2021: Large Sensitivity of Simulated Indian Summer Monsoon Rainfall (ISMR) to Global Warming: Implications of ISMR Projections. Journal of Geophysical Research-Atmospheres, 126, doi:10.1029/2020jd033511.
- Rani, S. I., and Coauthors, 2021: IMDAA: High-Resolution Satellite-Era Reanalysis for the Indian Monsoon Region. J. Clim., 34, 5109-5133, doi:10.1175/jcli-d-20-0412.1.
- Rimbu, N., M. Ionita, and G. Lohmann, 2021: A Synoptic Scale Perspective on Greenland Ice Core delta O-18 Variability and Related Teleconnection Patterns. Atmosphere, 12, doi:10.3390/atmos12030294.
- Ruane, A. C., and Coauthors, 2021: Strong regional influence of climatic forcing datasets on global crop model ensembles. Agricultural and Forest Meteorology, 300, doi:10.1016/j.agrformet.2020.108313.
- Saemian, P., and Coauthors, 2021: Comprehensive evaluation of precipitation datasets over Iran. Journal of Hydrology, 603, doi:10.1016/j.jhydrol.2021.127054.
- Sanchez, S. C., G. J. Hakim, and C. P. Saenger, 2021: Climate Model Teleconnection Patterns Govern the Nino-3.4 Response to Early Nineteenth-Century Volcanism in Coral-Based Data Assimilation Reconstructions. J. Clim., 34, 1863-1880, doi:10.1175/jcli-d-20-0549.1.
- Sanchez, S. C., and K. B. Karnauskas, 2021: Diversity in the Persistence of El Nino Events Over the Last Millennium. Geophysical Research Letters, 48, doi:10.1029/2021gl093698.
- Sasaki, Y. N., and C. Umeda, 2021: Rapid Warming of Sea Surface Temperature along the Kuroshio and the China Coast in the East China Sea during the Twentieth Century. J. Clim., 34, 4803-4815, doi:10.1175/jcli-d-20-0421.1.
- Sayani, H. R., D. M. Thompson, J. E. Carilli, T. M. Marchitto, A. U. Chapman, and K. M. Cobb, 2021: Reproducibility of Coral Mn/Ca-Based Wind Reconstructions at Kiritimati Island and Butaritari Atoll. Geochemistry Geophysics Geosystems, 22, doi:10.1029/2020gc009398.
- Scaife, A. A., and Coauthors, 2021: The UK-China Climate Science to Service Partnership. Bulletin of the American Meteorological Society, 102, E1563-E1578, doi:10.1175/bams-d-20-0055.1.
- Scholz, S. R., and Coauthors, 2022: Changing hydroclimate dynamics and the 19th to 20th century wetting trend in the English Channel region of northwest Europe. Climate Dynamics, 58, 1539-1553, doi:10.1007/s00382-021-05977-5.
- Sekulic, A., M. Kilibarda, D. Protic, and B. Bajat, 2021: A high-resolution daily gridded meteorological dataset for Serbia made by Random Forest Spatial Interpolation. Scientific Data, 8, doi:10.1038/s41597-021-00901-2.
- Semenov, V. A., 2021: Modern Arctic Climate Research: Progress, Change of Concepts, and Urgent Problems. Izvestiya Atmospheric and Oceanic Physics, 57, 18-28, doi:10.1134/s0001433821010114.
- Serykh, I. V., and D. M. Sonechkin, 2021: El Nino-Global Atmospheric Oscillation as the Main Mode of Interannual Climate Variability. Atmosphere, 12, doi:10.3390/atmos12111443.
- Shen, C., J. L. Zha, J. Wu, and D. M. Zhao, 2021: Centennial-Scale Variability of Terrestrial Near-Surface Wind Speed over China from Reanalysis. J. Clim., 34, 5829-5846, doi:10.1175/jcli-d-20-0436.1.
- Shen, C., J. L. Zha, D. M. Zhao, J. Wu, W. X. Fan, M. X. Yang, and Z. B. Li, 2021: Estimating centennial-scale changes in global terrestrial near-surface wind speed based on CMIP6 GCMs. Environmental Research Letters, 16, doi:10.1088/1748-9326/ac1378.
- Shi, W. J., Q. Z. Wang, Z. N. Xiao, W. Cheng, and W. Duan, 2021: Modulation of Atlantic Multidecadal Oscillation on the Interdecadal Variation of South Asian High and Somali Jet in Summer. Frontiers in Earth Science, 9, doi:10.3389/feart.2021.772202.
- Si, D., D. B. Jiang, and Y. H. Ding, 2021: Synergistic Impacts of the Atlantic and Pacific Oceans on Interdecadal Variations of Summer Rainfall in Northeast Asia. Journal of Meteorological Research, 35, 844-856, doi:10.1007/s13351-021-0191-2.
- Siew, P. Y. F., C. Li, M. F. Ting, S. P. Sobolowski, Y. T. Wu, and X. D. Chen, 2021: North Atlantic Oscillation in winter is largely insensitive to autumn Barents-Kara sea ice variability. Science Advances, 7, doi:10.1126/sciadv.abg4893.
- Slivinski, L. C., and Coauthors, 2021: An Evaluation of the Performance of the Twentieth Century Reanalysis Version 3. J. Clim., 34, 1417-1438, doi:10.1175/jcli-d-20-0505.1.
- Storto, A., M. A. Balmaseda, E. de Boisseson, B. S. Giese, S. Masina, and C. X. Yang, 2021: The 20th century global warming signature on the ocean at global and basin scales as depicted from historical reanalyses. International Journal of Climatology, 41, 5977-5997, doi:10.1002/joc.7163.
- Stratimirovic, D., I. Batas-Bjelic, V. Djurdjevic, and S. Blesic, 2021: Changes in long-term properties and natural cycles of the Danube river level and flow induced by damming. Physica a-Statistical Mechanics and Its Applications, 566, doi:10.1016/j.physa.2020.125607.
- Suarez-Moreno, R., Y. Kushnir, and R. Seager, 2022: Observational analysis of decadal and long-term hydroclimate drivers in the Mediterranean region: role of the ocean-atmosphere system and anthropogenic forcing. Climate Dynamics, 58, 2079-2107, doi:10.1007/s00382-021-05765-1.
- Sullivan, R. M., P. J. van Hengstum, S. J. Coats, J. P. Donnelly, A. E. Tamalavage, T. S. Winkler, and N. A. Albury, 2021: Hydroclimate Dipole Drives Multi-Centennial Variability in the Western Tropical North Atlantic Margin During the Middle and Late Holocene. Paleoceanography and Paleoclimatology, 36, doi:10.1029/2020pa004184.
- Sun, C., Y. S. Liu, J. Q. Xue, F. Kucharski, J. P. Li, and X. C. Li, 2021: The importance of inter-basin atmospheric teleconnection in the SST footprint of Atlantic multidecadal oscillation over western Pacific. Climate Dynamics, 57, 239-252, doi:10.1007/s00382-021-05705-z.
- Sung, H. M., and Coauthors, 2021: Climate Change Projection in the Twenty-First Century Simulated by NIMS-KMA CMIP6 Model Based on New GHGs Concentration Pathways. Asia-Pacific Journal of Atmospheric Sciences, 57, 851-862, doi:10.1007/s13143-021-00225-6.
- Svendsen, L., N. Keenlyside, M. Muilwijk, I. Bethke, N. E. Omrani, and Y. Q. Gao, 2021: Pacific contribution to decadal surface temperature trends in the Arctic during the twentieth century. Climate Dynamics, 57, 3223-3243, doi:10.1007/s00382-021-05868-9.
- Szuwalski, C., and Coauthors, 2021: Climate change and the future productivity and distribution of crab in the Bering Sea. Ices J Mar Sci, 78, 502-515, doi:10.1093/icesjms/fsaa140.
- Tadesse, M. G., and T. Wahl, 2021: A database of global storm surge reconstructions. Scientific Data, 8, doi:10.1038/s41597-021-00906-x.
- Tan, P. H., J. Y. Tu, and M. Y. Tsai, 2021: Large-scale processes modulating the frequency of typhoons affecting Taiwan during 1900-1945. Terrestrial Atmospheric and Oceanic Sciences, 32, 1197-1213, doi:10.3319/tao.2021.11.29.01.
- Tang, T., J. J. Luo, K. Peng, L. Qi, and S. L. Tang, 2021: Over-projected Pacific warming and extreme El Nino frequency due to CMIP5 common biases. National Science Review, 8, doi:10.1093/nsr/nwab056.
- Taszarek, M., N. Pilguj, J. T. Allen, V. Gensini, H. E. Brooks, and P. Szuster, 2021: Comparison of Convective Parameters Derived from ERA5 and MERRA-2 with Rawinsonde Data over Europe and North America. J. Clim., 34, 3211-3237, doi:10.1175/jcli-d-20-0484.1.
- Teckentrup, L., M. G. De Kauwe, A. J. Pitman, and B. Smith, 2021: Examining the sensitivity of the terrestrial carbon cycle to the expression of El Nino. Biogeosciences, 18, 2181-2203, doi:10.5194/bg-18-2181-2021.
- Thandlam, V., A. Rutgersson, and E. Sahlee, 2022: Spatio-temporal variability of atmospheric rivers and associated atmospheric parameters in the Euro-Atlantic region. Theoretical and Applied Climatology, 147, 13-33, doi:10.1007/s00704-021-03776-w.
- Thompson, D. M., 2022: Environmental records from coral skeletons: A decade of novel insights and innovation. Wiley Interdisciplinary Reviews-Climate Change, 13, doi:10.1002/wcc.745.
- Tichavsky, R., A. Fabianova, and R. Tolasz, 2021: Intra-annual dendrogeomorphic dating and climate linkages of flood events in headwaters of central Europe. Science of the Total Environment, 763, doi:10.1016/j.scitotenv.2020.142953.
- Titus, M. L., K. R. Thompson, E. C. J. Oliver, and P. J. Klotzbach, 2021: Statistical Reconstruction of Seasonal Tropical Cyclone Variability in the North Atlantic Basin. Journal of Geophysical Research-Atmospheres, 126, doi:10.1029/2020jd032669.
- Vaccaro, A., J. Emile-Geay, D. Guillot, R. Verna, C. Morice, J. Kennedy, and B. Rajaratnam, 2021: Climate Field Completion via Markov Random Fields: Application to the HadCRUT4.6 Temperature Dataset. J. Clim., 34, 4169-4188, doi:10.1175/jcli-d-19-0814.1.
- Vanderkelen, I., and Coauthors, 2021: Simulating the Impact of Global Reservoir Expansion on the Present-Day Climate. Journal of Geophysical Research-Atmospheres, 126, doi:10.1029/2020jd034485.
- Vanmaercke, M., and Coauthors, 2021: Measuring, modelling and managing gully erosion at large scales: A state of the art. Earth-Science Reviews, 218, doi:10.1016/j.earscirev.2021.103637.
- Villamayor, J., M. Khodri, R. Villalba, and V. Daux, 2021: Causes of the long-term variability of southwestern South America precipitation in the IPSL-CM6A-LR model. Climate Dynamics, 57, 2391-2414, doi:10.1007/s00382-021-05811-y.
- Wang, X., R. Y. Lu, and X. W. Hong, 2021: Reduction of mid-summer rainfall in northern India after the late-1990s induced by the decadal change of the Silk Road pattern. Environmental Research Letters, 16, doi:10.1088/1748-9326/ac2cea.
- Wang, X. Y., and Coauthors, 2021: Underestimated responses of Walker circulation to ENSO-related SST anomaly in atmospheric and coupled models. Geoscience Letters, 8, doi:10.1186/s40562-021-00186-8.
- Wang, Y. C., and Coauthors, 2021: Performance of the Taiwan Earth System Model in Simulating Climate Variability Compared With Observations and CMIP6 Model Simulations. Journal of Advances in Modeling Earth Systems, 13, doi:10.1029/2020ms002353.
- Wang, Z. Y., T. Li, and Y. Sun, 2021: Interdecadal variability of intensity of the Madden-Julian oscillation. Atmospheric Science Letters, 22, doi:10.1002/asl.1027.
- Wei, W. U., Z. W. Yan, and Z. Li, 2021: Influence of Pacific Decadal Oscillation on global precipitation extremes. Environmental Research Letters, 16, doi:10.1088/1748-9326/abed7c.
- Williamson, F., 2021: Building a long-time series for weather and extreme weather in the Straits Settlements: a multi-disciplinary approach to the archives of societies. Climate of the Past, 17, 791-803, doi:10.5194/cp-17-791-2021.
- Wu, M. N., T. J. Zhou, and X. L. Chen, 2021: The Source of Uncertainty in Projecting the Anomalous Western North Pacific Anticyclone during El Nino-Decaying Summers. J. Clim., 34, 6603-6617, doi:10.1175/jcli-d-20-0904.1.
- Wu, M. N., and Coauthors, 2021: A very likely weakening of Pacific Walker Circulation in constrained near-future projections. Nature Communications, 12, doi:10.1038/s41467-021-26693-y.
- Wu, X. B., X. H. Yan, Y. Li, H. Mei, Y. A. Liou, and G. Li, 2021: Climatic Variation of Maximum Intensification Rate for Major Tropical Cyclones over the Western North Pacific. Atmosphere, 12, doi:10.3390/atmos12040494.
- Xie, T. J., J. P. Li, K. Q. Chen, Y. Z. Zhang, and C. Sun, 2021: Origin of Indian Ocean multidecadal climate variability: role of the North Atlantic Oscillation. Climate Dynamics, 56, 3277-3294, doi:10.1007/s00382-021-05643-w.
- Yang, X. S., and Coauthors, 2021: On the Development of GFDL's Decadal Prediction System: Initialization Approaches and Retrospective Forecast Assessment. Journal of Advances in Modeling Earth Systems, 13, doi:10.1029/2021ms002529.
- Yeasmin, A., S. Chand, C. Turville, and N. Sultanova, 2021: Detection and verification of tropical cyclones and depressions over the South Pacific Ocean basin using ERA-5 reanalysis dataset. International Journal of Climatology, 41, 5318-5330, doi:10.1002/joc.7131.
- Zahan, Y., P. V. Rajesh, B. A. Choudhury, and B. N. Goswami, 2021: Why Indian summer monsoon circulation indices? Fidelity in representing rainfall variability and teleconnections. Quarterly Journal of the Royal Meteorological Society, 147, 1300-1316, doi:10.1002/qj.3972.
- Zerbini, S., S. Bruni, and F. Raicich, 2021: Tide gauge data archaeology provides natural subsidence rates along the coasts of the Po Plain and of the Veneto-Friuli Plain, Italy. Geophysical Journal International, 225, 253-260, doi:10.1093/gji/ggaa602.
- Zhang, C. A. L., X. J. Sun, W. Lu, Y. N. Shi, N. Y. Dou, and S. H. Li, 2021: Relationship between wind observation accuracy and the ascending node of the sun-synchronous orbit for the Aeolus-type spaceborne Doppler wind lidar. Atmos Meas Tech, 14, 4787-4803, doi:10.5194/amt-14-4787-2021.
- Zhang, H. B., W. W. Immerzeel, F. Zhang, R. J. de Kok, S. J. Gorrie, and M. Ye, 2021: Creating 1-km long-term (1980-2014) daily average air temperatures over the Tibetan Plateau by integrating eight types of reanalysis and land data assimilation products downscaled with MODIS-estimated temperature lapse rates based on machine learning. International Journal of Applied Earth Observation and Geoinformation, 97, doi:10.1016/j.jag.2021.102295.
- Zhang, H. H., R. Seager, J. He, H. S. Diao, and S. Pascale, 2021: Quantifying atmosphere and ocean origins of North American precipitation variability. Climate Dynamics, 56, 4051-4074, doi:10.1007/s00382-021-05685-0.
- Zhang, L., B. L. Gan, X. C. Li, H. Wang, C. Y. Wang, W. J. Cai, and L. X. Wu, 2021: Remote Influence of the Midlatitude South Atlantic Variability in Spring on Antarctic Summer Sea Ice. Geophysical Research Letters, 48, doi:10.1029/2020gl090810.
- Zhang, L. Y., and Coauthors, 2021: Pacific Warming Pattern Diversity Modulated by Indo-Pacific Sea Surface Temperature Gradient. Geophysical Research Letters, 48, doi:10.1029/2021gl095516.
- Zhang, S. Q., G. Y. Ren, Y. Y. Ren, Y. X. Zhang, and X. Y. Xue, 2021: Comprehensive evaluation of surface air temperature reanalysis over China against urbanization-bias-adjusted observations. Advances in Climate Change Research, 12, 783-794, doi:10.1016/j.accre.2021.09.010.
- Zhang, W., B. Kirtman, L. Siqueira, A. Clement, and J. F. Xia, 2021: Understanding the signal-to-noise paradox in decadal climate predictability from CMIP5 and an eddying global coupled model. Climate Dynamics, 56, 2895-2913, doi:10.1007/s00382-020-05621-8.
- Zheng, X. G., and C. S. Frederiksen, 2021: Variability of Multisite Decadal Running Means Arising from Year-To-Year Fluctuations. J. Clim., 34, 1337-1350, doi:10.1175/jcli-d-20-0414.1.
- Zhou, B. T., Z. Y. Wang, B. Sun, and X. Hao, 2021: Decadal Change of Heavy Snowfall over Northern China in the Mid-1990s and Associated Background Circulations. J. Clim., 34, 825-837, doi:10.1175/jcli-d-19-0815.1.
- Alexandrov, G. A., V. A. Ginzburg, G. E. Insarov, and A. A. Romanovskaya, 2021: CMIP6 model projections leave no room for permafrost to persist in Western Siberia under the SSP5-8.5 scenario. Climatic Change, 169, doi:10.1007/s10584-021-03292-w.
- Baatz, R., and Coauthors, 2021: Reanalysis in Earth System Science: Toward Terrestrial Ecosystem Reanalysis. Reviews of Geophysics, 59, doi:10.1029/2020rg000715.
- Bourdeau-Goulet, S. C., and E. Hassanzadeh, 2021: Comparisons Between CMIP5 and CMIP6 Models: Simulations of Climate Indices Influencing Food Security, Infrastructure Resilience, and Human Health in Canada. Earths Future, 9, doi:10.1029/2021ef001995.
- Burt, S. D.: A twice-daily barometric pressure record from Durham Observatory in north-east England, 1843-1960. Geoscience Data Journal, doi:10.1002/gdj3.135.
- Ceron, W. L., M. T. Kayano, R. V. Andreoli, A. Avila-Diaz, I. P. de Souza, and R. A. F. Souza, 2021: Pacific and Atlantic Multidecadal Variability Relations with the Choco and Caribbean Low-Level Jets during the 1900-2015 Period. Atmosphere, 12, doi:10.3390/atmos12091120.
- Gergis, J., Z. Baillie, S. Ingallina, L. Ashcroft, and T. Ellwood, 2021: A historical climate dataset for southwestern Australia, 1830-1875. International Journal of Climatology, 41, 4898-4919, doi:10.1002/joc.7105.
- Han, J., and V. P. Singh, 2021: Impacts of Rossby Wave Packets and Atmospheric Rivers on Meteorological Drought in the Continental United States. Water Resources Research, 57, doi:10.1029/2021wr029966.
- Horton, P., 2022: Analogue methods and ERA5: Benefits and pitfalls. International Journal of Climatology, 42, 4078-4096, doi:10.1002/joc.7484.
- Hyncica, M., and R. Huth, 2022: Temporal evolution of relationships between temperature and circulation modes in five reanalyses. International Journal of Climatology, 42, 4391-4404, doi:10.1002/joc.7474.
- Karmalkar, A. V., and R. M. Horton, 2021: Drivers of exceptional coastal warming in the northeastern United States. Nature Climate Change, 11, 854-+, doi:10.1038/s41558-021-01159-7.
- Qiao, P. J., Z. Q. Gong, W. Q. Liu, Y. W. Zhang, G. L. Feng, and W. J. Dong, 2021: Extreme rainfall synchronization network between Southwest China and Asia-Pacific region. Climate Dynamics, 57, 3207-3221, doi:10.1007/s00382-021-05865-y.
- Alexandrov, G. A., V. A. Ginzburg, G. E. Insarov, and A. A. Romanovskaya, 2021: CMIP6 model projections leave no room for permafrost to persist in Western Siberia under the SSP5-8.5 scenario. Climatic Change, 169, doi:10.1007/s10584-021-03292-w.
- Baatz, R., and Coauthors, 2021: Reanalysis in Earth System Science: Toward Terrestrial Ecosystem Reanalysis. Reviews of Geophysics, 59, doi:10.1029/2020rg000715.
- Bourdeau-Goulet, S. C., and E. Hassanzadeh, 2021: Comparisons Between CMIP5 and CMIP6 Models: Simulations of Climate Indices Influencing Food Security, Infrastructure Resilience, and Human Health in Canada. Earths Future, 9, doi:10.1029/2021ef001995.
- Burt, S. D.: A twice-daily barometric pressure record from Durham Observatory in north-east England, 1843-1960. Geoscience Data Journal, doi:10.1002/gdj3.135.
- Ceron, W. L., M. T. Kayano, R. V. Andreoli, A. Avila-Diaz, I. P. de Souza, and R. A. F. Souza, 2021: Pacific and Atlantic Multidecadal Variability Relations with the Choco and Caribbean Low-Level Jets during the 1900-2015 Period. Atmosphere, 12, doi:10.3390/atmos12091120.
- Gergis, J., Z. Baillie, S. Ingallina, L. Ashcroft, and T. Ellwood, 2021: A historical climate dataset for southwestern Australia, 1830-1875. International Journal of Climatology, 41, 4898-4919, doi:10.1002/joc.7105.
- Han, J., and V. P. Singh, 2021: Impacts of Rossby Wave Packets and Atmospheric Rivers on Meteorological Drought in the Continental United States. Water Resources Research, 57, doi:10.1029/2021wr029966.
- Horton, P., 2022: Analogue methods and ERA5: Benefits and pitfalls. International Journal of Climatology, 42, 4078-4096, doi:10.1002/joc.7484.
- Hyncica, M., and R. Huth, 2022: Temporal evolution of relationships between temperature and circulation modes in five reanalyses. International Journal of Climatology, 42, 4391-4404, doi:10.1002/joc.7474.
- Karmalkar, A. V., and R. M. Horton, 2021: Drivers of exceptional coastal warming in the northeastern United States. Nature Climate Change, 11, 854-+, doi:10.1038/s41558-021-01159-7.
- Qiao, P. J., Z. Q. Gong, W. Q. Liu, Y. W. Zhang, G. L. Feng, and W. J. Dong, 2021: Extreme rainfall synchronization network between Southwest China and Asia-Pacific region. Climate Dynamics, 57, 3207-3221, doi:10.1007/s00382-021-05865-y.
2020
Compo et al. 2011- Allchin, M. I., and S. J. Dery, 2020: The Climatological Context of Trends in the Onset of Northern Hemisphere Seasonal Snow Cover, 1972-2017. Journal of Geophysical Research-Atmospheres, 125, doi:10.1029/2019jd032367.
- Ardilouze, C., S. Materia, L. Batte, M. Benassi, and C. Prodhomme: Precipitation response to extreme soil moisture conditions over the Mediterranean. Climate Dynamics, doi:10.1007/s00382-020-05519-5.
- Armal, S., N. Devineni, N. Y. Krakauer, and R. Khanbilvardi, 2020: Simulating precipitation in the Northeast United States using aclimate-informedK-nearestneighbour algorithm. Hydrological Processes, 34, 3966-3980, doi:10.1002/hyp.13853.
- Ballinger, T. J., and Coauthors, 2021: The role of blocking circulation and emerging open water feedbacks on Greenland cold-season air temperature variability over the last century. International Journal of Climatology, 41, E2778-E2800, doi:10.1002/joc.6879.
- Baudouin, J. P., M. Herzog, and C. A. Petrie, 2020: Cross-validating precipitation datasets in the Indus River basin. Hydrology and Earth System Sciences, 24, 427-450, doi:10.5194/hess-24-427-2020.
- Blanchet, J., and J. D. Creutin, 2020: Explaining Rainfall Accumulations over Several Days in the French Alps Using Low-Dimensional Atmospheric Predictors Based on Analogy. Journal of Applied Meteorology and Climatology, 59, 237-250, doi:10.1175/jamc-d-19-0112.1.
- Boe, J., and Coauthors, 2020: Past long-term summer warming over western Europe in new generation climate models: role of large-scale atmospheric circulation. Environmental Research Letters, 15, doi:10.1088/1748-9326/ab8a89.
- Bohm, C., M. Reyers, J. H. Schween, and S. Crewell, 2020: Water vapor variability in the Atacama Desert during the 20th century. Global and Planetary Change, 190, doi:10.1016/j.gloplacha.2020.103192.
- Bonnet, R., J. Boe, and F. Habets, 2020: Influence of multidecadal variability on high and low flows: the case of the Seine basin. Hydrology and Earth System Sciences, 24, 1611-1631, doi:10.5194/hess-24-1611-2020.
- Boustead, B. M., M. D. Shulski, and S. D. Hilberg, 2020: The Long Winter of 1880/81. Bulletin of the American Meteorological Society, 101, E797-E813, doi:10.1175/bams-d-19-0014.1.
- Brady, R. X., N. S. Lovenduski, S. G. Yeager, M. C. Long, and K. Lindsay, 2020: Skillful multiyear predictions of ocean acidification in the California Current System. Nature Communications, 11, doi:10.1038/s41467-020-15722-x.
- Brennan, M. K., G. J. Hakim, and E. Blanchard-Wrigglesworth, 2020: Arctic Sea-Ice Variability During the Instrumental Era. Geophysical Research Letters, 47, doi:10.1029/2019gl086843.
- Brierley, C. M., and Coauthors, 2020: Large-scale features and evaluation of the PMIP4-CMIP6 midHolocene simulations. Climate of the Past, 16, 1847-1872, doi:10.5194/cp-16-1847-2020.
- Bronnimann, S., 2020: Synthetic weather diaries: concept and application to Swiss weather in 1816. Climate of the Past, 16, 1937-1952, doi:10.5194/cp-16-1937-2020.
- Brown, J. R., and Coauthors, 2020: Comparison of past and future simulations of ENSO in CMIP5/PMIP3 and CMIP6/PMIP4 models. Climate of the Past, 16, 1777-1805, doi:10.5194/cp-16-1777-2020.
- Brown, J. R., and Coauthors, 2020: South Pacific Convergence Zone dynamics, variability and impacts in a changing climate. Nature Reviews Earth & Environment, 1, 530-543, doi:10.1038/s43017-020-0078-2.
- Caceres, D., B. Marzeion, J. H. Malles, B. D. Gutknecht, H. M. Schmied, and P. Doll, 2020: Assessing global water mass transfers from continents to oceans over the period 1948-2016. Hydrology and Earth System Sciences, 24, 4831-4851, doi:10.5194/hess-24-4831-2020.
- Cannon, A. J., 2020: Reductions in daily continental-scale atmospheric circulation biases between generations of global climate models: CMIP5 to CMIP6. Environmental Research Letters, 15, doi:10.1088/1748-9326/ab7e4f.
- Capozzi, V., Y. Cotroneo, P. Castagno, C. De Vivo, and G. Budillon, 2020: Rescue and quality control of sub-daily meteorological data collected at Montevergine Observatory (Southern Apennines), 1884-1963. Earth System Science Data, 12, 1467-1487, doi:10.5194/essd-12-1467-2020.
- Ceglar, A., M. Zampieri, N. Gonzalez-Reviriego, P. Ciais, B. Schauberger, and M. Van der Velde, 2020: Time-varying impact of climate on maize and wheat yields in France since 1900. Environmental Research Letters, 15, doi:10.1088/1748-9326/aba1be.
- Champagne, O., M. Leduc, P. Coulibaly, and M. A. Arain, 2020: Winter hydrometeorological extreme events modulated by large-scale atmospheric circulation in southern Ontario. Earth System Dynamics, 11, 301-318, doi:10.5194/esd-11-301-2020. Chand, S. S., A. Dowdy, S. Bell, and K. Tory, 2020: A Review of South Pacific Tropical Cyclones: Impacts of Natural Climate Variability and Climate Change. Climate Change and Impacts in the Pacific, L. Kumar, Ed., 251-273.
- Chen, D., Y. Gao, J. Q. Sun, H. J. Wang, and J. H. Ma, 2020: Interdecadal Variation and Causes of Drought in Northeast China in Recent Decades. Journal of Geophysical Research-Atmospheres, 125, doi:10.1029/2019jd032069.
- Chen, D., J. Q. Sun, and Y. Gao, 2020: Distinct impact of the Pacific multi-decadal oscillation on precipitation in Northeast China during April in different Pacific multi-decadal oscillation phases. International Journal of Climatology, 40, 1630-1643, doi:10.1002/joc.6291.
- Chen, D., J. Q. Sun, and Y. Gao, 2020: Effects of AO on the interdecadal oscillating relationship between the ENSO and East Asian winter monsoon. International Journal of Climatology, 40, 4374-4383, doi:10.1002/joc.6459.
- Chen, R. Y., I. R. Simpson, C. Deser, and B. Wang, 2020: Model Biases in the Simulation of the Springtime North Pacific ENSO Teleconnection. J. Clim., 33, 9985-10002, doi:10.1175/jcli-d-19-1004.1.
- Chen, S. F., W. Chen, R. G. Wu, and L. Y. Song, 2020: Impacts of the Atlantic Multidecadal Oscillation on the Relationship of the Spring Arctic Oscillation and the Following East Asian Summer Monsoon. J. Clim., 33, 6651-6672, doi:10.1175/jcli-d-19-0978.1.
- Choi, H. Y., H. J. Lee, S. Y. Kim, and W. Park, 2020: Deepening of Future Aleutian Low in Ensemble Global Warming Simulations with the Kiel Climate Model. Ocean Science Journal, 55, 219-230, doi:10.1007/s12601-020-0017-7.
- Cook, E. R., and Coauthors, 2020: The European Russia Drought Atlas (1400-2016 CE). Climate Dynamics, 54, 2317-2335, doi:10.1007/s00382-019-05115-2.
- Cowan, T., and Coauthors, 2020: Ocean and land forcing of the record-breaking Dust Bowl heatwaves across central United States. Nature Communications, 11, doi:10.1038/s41467-020-16676-w.
- Cowan, T., S. Undorf, G. C. Hegerl, L. J. Harrington, and F. E. L. Otto, 2020: Present-day greenhouse gases could cause more frequent and longer Dust Bowl heatwaves. Nature Climate Change, 10, 505-+, doi:10.1038/s41558-020-0771-7.
- Craig, P. M., and E. Hawkins, 2020: Digitizing observations from the Met Office Daily Weather Reports for 1900-1910 using citizen scientist volunteers. Geoscience Data Journal, 7, 116-134, doi:10.1002/gdj3.93.
- Dai, N., and P. A. Arkin, 2021: Diagnosis of ENSO-related precipitation changes during the twentieth and twenty-first centuries using reanalyses and two multi-model clusters. Climate Dynamics, 56, 727-748, doi:10.1007/s00382-020-05495-w.
- Darshana, P., J. S. Chowdary, C. Gnanaseelan, A. Parekh, and G. Srinivas, 2020: Interdecadal modulation of the Indo-western Pacific Ocean Capacitor mode and its influence on Indian summer monsoon rainfall. Climate Dynamics, 54, 1761-1777, doi:10.1007/s00382-019-05085-5.
- Dasgupta, P., A. Metya, C. V. Naidu, M. Singh, and M. K. Roxy, 2020: Exploring the long-term changes in the Madden Julian Oscillation using machine learning. Scientific Reports, 10, doi:10.1038/s41598-020-75508-5.
- Delunel, R., and Coauthors, 2020: Late-Pleistocene catchment-wide denudation patterns across the European Alps. Earth-Science Reviews, 211, doi:10.1016/j.earscirev.2020.103407.
- Ding, Z. M., and R. G. Wu, 2020: Quantifying the internal variability in multi-decadal trends of spring surface air temperature over mid-to-high latitudes of Eurasia. Climate Dynamics, 55, 2013-2030, doi:10.1007/s00382-020-05365-5.
- Diodato, N., N. Filizola, P. Borrelli, P. Panagos, and G. Bellocchi, 2020: The Rise of Climate-Driven Sediment Discharge in the Amazonian River Basin. Atmosphere, 11, doi:10.3390/atmos11020208.
- Diouf, I., and Coauthors, 2020: Climate Variability and Malaria over West Africa. American Journal of Tropical Medicine and Hygiene, 102, 1037-1047, doi:10.4269/ajtmh.19-0062.
- Djebbar, A., H. Goosse, and F. Klein, 2020: Robustness of the Link between Precipitation in North Africa and Standard Modes of Atmospheric Variability during the Last Millennium. Climate, 8, doi:10.3390/cli8050062. Donat, M. G., J. Sillmann, and E. M. Fischer, 2020: Changes in climate extremes in observations and climate model simulations. From the past to the future. 31-57 pp.
- Dunne, J. P., and Coauthors, 2020: The GFDL Earth System Model Version 4.1 (GFDL-ESM 4.1): Overall Coupled Model Description and Simulation Characteristics. Journal of Advances in Modeling Earth Systems, 12, doi:10.1029/2019ms002015.
- Ehmele, F., L. A. Kautz, H. Feldmann, and J. G. Pinto, 2020: Long-term variance of heavy precipitation across central Europe using a large ensemble of regional climate model simulations. Earth System Dynamics, 11, 469-490, doi:10.5194/esd-11-469-2020.
- Fasullo, J. T., A. S. Phillips, and C. Deser, 2020: Evaluation of Leading Modes of Climate Variability in the CMIP Archives. J. Clim., 33, 5527-5545, doi:10.1175/jcli-d-19-1024.1.
- Figliuolo, G. C., R. V. Andreoli, M. T. Kayano, J. A. C. da Costa, W. H. T. Rego, and D. S. de Moraes, 2020: The role of the Atlantic Multidecadal Oscillation precondition in the teleconnection of different El Nino-Southern Oscillation types and impacts on the 15 degrees N-15 degrees S South American sector precipitation. International Journal of Climatology, 40, 1943-1964, doi:10.1002/joc.6309.
- Fogt, R. L., C. P. Belak, J. M. Jones, L. C. Slivinski, and G. P. Compo, 2021: An assessment of early 20th century Antarctic pressure reconstructions using historical observations. International Journal of Climatology, 41, E672-E689, doi:10.1002/joc.6718.
- Forster, K., and L. B. Thiele, 2020: Variations in sub-daily precipitation at centennial scale. Npj Climate and Atmospheric Science, 3, doi:10.1038/s41612-020-0117-1.
- Fu, Z., P. C. Hsu, and F. Liu, 2020: Factors Regulating the Multidecadal Changes in MJO Amplitude over the Twentieth Century. J. Clim., 33, 9513-9529, doi:10.1175/jcli-d-20-0111.1.
- Fujiwara, M., P. Martineau, and J. S. Wright, 2020: Surface temperature response to the major volcanic eruptions in multiple reanalysis data sets. Atmospheric Chemistry and Physics, 20, 345-374, doi:10.5194/acp-20-345-2020.
- Fulop, R. H., and Coauthors, 2020: Million-year lag times in a post-orogenic sediment conveyor. Science Advances, 6, doi:10.1126/sciadv.aaz8845.
- Gavrilov, A., S. Kravtsov, and D. Mukhin, 2020: Analysis of 20th century surface air temperature using linear dynamical modes. Chaos, 30, doi:10.1063/5.0028246.
- Geng, T., W. J. Cai, and L. X. Wu, 2020: Two Types of ENSO Varying in Tandem Facilitated by Nonlinear Atmospheric Convection. Geophysical Research Letters, 47, doi:10.1029/2020gl088784.
- Gergis, J., L. Ashcroft, and P. Whetton, 2020: A historical perspective on Australian temperature extremes. Climate Dynamics, 55, 843-868, doi:10.1007/s00382-020-05298-z.
- Ghil, M., and V. Lucarini, 2020: The physics of climate variability and climate change. Reviews of Modern Physics, 92, doi:10.1103/RevModPhys.92.035002.
- Gibson, A. J., D. C. Verdon-Kidd, G. R. Hancock, and G. Willgoose, 2020: Catchment-scale drought: capturing the whole drought cycle using multiple indicators. Hydrology and Earth System Sciences, 24, 1985-2002, doi:10.5194/hess-24-1985-2020.
- Gibson, P. B., D. E. Waliser, B. Guan, M. J. DeFlorio, F. M. Ralph, and D. L. Swain, 2020: Ridging Associated with Drought across the Western and Southwestern United States: Characteristics, Trends, and Predictability Sources. J. Clim., 33, 2485-2508, doi:10.1175/jcli-d-19-0439.1.
- Gillespie, I. M., L. Haimberger, G. P. Compo, and P. W. Thorne, 2021: Assessing potential of sparse-input reanalyses for centennial-scale land surface air temperature homogenisation. International Journal of Climatology, 41, E3000-E3020, doi:10.1002/joc.6898.
- Gong, Y. H., T. Li, and L. Chen, 2020: Interdecadal modulation of ENSO amplitude by the Atlantic multi-decadal oscillation (AMO). Climate Dynamics, 55, 2689-2702, doi:10.1007/s00382-020-05408-x.
- Gos, M., P. Baranowski, J. Krzyszczak, A. Kieliszek, and K. Siwek, 2021: Dynamics of meteorological time series on the base of ground measurements and retrospective data fromMERRA-2 for Poland. International Journal of Climatology, 41, E1531-E1552, doi:10.1002/joc.6787.
- Haakenstad, H., O. Breivik, M. Reistad, and O. J. Aarnes, 2020: NORA10EI: A revised regional atmosphere-wave hindcast for the North Sea, the Norwegian Sea and the Barents Sea. International Journal of Climatology, 40, 4347-4373, doi:10.1002/joc.6458.
- Han, Z. X., and Coauthors, 2020: The changes in ENSO-induced tropical Pacific precipitation variability in the past warm and cold climates from the EC-Earth simulations. Climate Dynamics, 55, 503-519, doi:10.1007/s00382-020-05280-9.
- Hawley, W. B., C. C. Hay, J. X. Mitrovica, and R. E. Kopp, 2020: A Spatially Variable Time Series of Sea Level Change Due to Artificial Water Impoundment. Earths Future, 8, doi:10.1029/2020ef001497.
- Hernandez, A., and Coauthors, 2020: Modes of climate variability: Synthesis and review of proxy-based reconstructions through the Holocene. Earth-Science Reviews, 209, doi:10.1016/j.earscirev.2020.103286.
- Hernandez, A., and Coauthors, 2020: A 2,000-year Bayesian NAO reconstruction from the Iberian Peninsula. Scientific Reports, 10, doi:10.1038/s41598-020-71372-5.
- Hersbach, H., and Coauthors, 2020: The ERA5 global reanalysis. Quarterly Journal of the Royal Meteorological Society, 146, 1999-2049, doi:10.1002/qj.3803.
- Hogan, R. J., and M. Matricardi, 2020: Evaluating and improving the treatment of gases in radiation schemes: the Correlated K-Distribution Model Intercomparison Project (CKDMIP). Geoscientific Model Development, 13, 6501-6521, doi:10.5194/gmd-13-6501-2020.
- Hong, H. X., J. Q. Sun, and H. J. Wang, 2020: Interdecadal variation in the frequency of extreme hot events in Northeast China and the possible mechanism. Atmospheric Research, 244, doi:10.1016/j.atmosres.2020.105065.
- Hong, X., A. Kareem, and J. Li, 2020: Validation of the fast intensity model for typhoon and its application to the estimation of typhoon wind hazard for the southeast coast of China. Journal of Wind Engineering and Industrial Aerodynamics, 206, doi:10.1016/j.jweia.2020.104379.
- Hounsou-Gbo, A., J. Servain, F. D. Vasconcelos, E. Martins, and M. Araujo, 2020: Summer and winter Atlantic Nino: connections with ENSO and implications. Climate Dynamics, 55, 2939-2956, doi:10.1007/s00382-020-05424-x.
- Hu, S. J., J. Sprintall, C. Guan, M. J. McPhaden, F. Wang, D. X. Hu, and W. J. Cai, 2020: Deep-reaching acceleration of global mean ocean circulation over the past two decades. Science Advances, 6, doi:10.1126/sciadv.aax7727.
- Huang, Y. Y., and H. J. Wang, 2020: A Possible Approach for Decadal Prediction of the PDO. Journal of Meteorological Research, 34, 63-72, doi:10.1007/s13351-020-9144-4.
- Huang, Y. Y., and H. J. Wang, 2020: Is the Regional Precipitation Predictable in Decadal Scale? A Possible Approach for the Decadal Prediction of the Summer Precipitation Over North China. Earth and Space Science, 7, doi:10.1029/2019ea000986.
- Hyncica, M., and R. Huth, 2020: Modes of Atmospheric Circulation Variability in the Northern Extratropics: A Comparison of Five Reanalyses. J. Clim., 33, 10707-10726, doi:10.1175/jcli-d-19-0904.1.
- Jebri, B., M. Khodri, V. Echevin, G. Gastineau, S. Thiria, J. Vialard, and N. Lebas, 2020: Contributions of Internal Variability and External Forcing to the Recent Trends in the Southeastern Pacific and Peru-Chile Upwelling System. J. Clim., 33, 10555-10578, doi:10.1175/jcli-d-19-0304.1.
- Jing, Y. J., Y. C. Li, and Y. F. Xu, 2020: Assessment of responses of North Atlantic winter sea surface temperature to the North Atlantic Oscillation on an interannual scale in 13 CMIP5 models. Ocean Science, 16, 1509-1527, doi:10.5194/os-16-1509-2020.
- Johnson, N. C., D. J. Amaya, Q. H. Ding, Y. Kosaka, H. Tokinaga, and S. P. Xie, 2020: Multidecadal modulations of key metrics of global climate change. Global and Planetary Change, 188, doi:10.1016/j.gloplacha.2020.103149.
- Jong, B. T., M. F. Ting, R. Seager, and W. B. Anderson, 2020: ENSO Teleconnections and Impacts on US Summertime Temperature during a Multiyear La Nina Life Cycle. J. Clim., 33, 6009-6024, doi:10.1175/jcli-d-19-0701.1.
- Kadow, C., D. M. Hall, and U. Ulbrich, 2020: Artificial intelligence reconstructs missing climate information. Nature Geoscience, 13, 408-+, doi:10.1038/s41561-020-0582-5.
- Karmakar, N., A. Chakraborty, and R. S. Nanjundiah, 2020: Influence of global sea-surface temperature on ultra-low-frequency variability in Indian summer monsoon rainfall. Quarterly Journal of the Royal Meteorological Society, 146, 904-921, doi:10.1002/qj.3715.
- Kim, D. I., H. H. Kwon, D. W. Han, and Y. T. Kim, 2020: Exploration of Daily Rainfall Intensity Change in South Korea 1900-2010 Using Bias-Corrected ERA-20C. J Hydrol Eng, 25, doi:10.1061/(asce)he.1943-5584.0001928.
- Kirdyanov, A. V., and Coauthors, 2020: Ecological and conceptual consequences of Arctic pollution. Ecology Letters, 23, 1827-1837, doi:10.1111/ele.13611.
- Krieger, D., O. Krueger, F. Feser, R. Weisse, B. Tinz, and H. von Storch, 2021: German Bight storm activity, 1897-2018. International Journal of Climatology, 41, E2159-E2177, doi:10.1002/joc.6837.
- Kudo, Y., 2020: Maintaining law and order: Welfare implications from village vigilante groups in northern Tanzania. Journal of Economic Behavior & Organization, 178, 607-628, doi:10.1016/j.jebo.2020.08.007.
- Kwon, Y. O., H. Seo, C. C. Ummenhofer, and T. M. Joyce, 2020: Impact of Multidecadal Variability in Atlantic SST on Winter Atmospheric Blocking. J. Clim., 33, 867-892, doi:10.1175/jcli-d-19-0324.1.
- Larson, S. M., and K. Pegion, 2020: Do asymmetries in ENSO predictability arise from different recharged states? Climate Dynamics, 54, 1507-1522, doi:10.1007/s00382-019-05069-5.
- Le, T., K. J. Ha, D. H. Bae, and S. H. Kim, 2020: Causal effects of Indian Ocean Dipole on El Nino-Southern Oscillation during 1950-2014 based on high-resolution models and reanalysis data. Environmental Research Letters, 15, doi:10.1088/1748-9326/abb96d.
- Lhotka, O., and S. Bronnimann, 2020: Possible Increase of Vegetation Exposure to Spring Frost under Climate Change in Switzerland. Atmosphere, 11, doi:10.3390/atmos11040391.
- Li, L. F., M. S. Lozier, and M. W. Buckley, 2020: An Investigation of the Ocean's Role in Atlantic Multidecadal Variability. J. Clim., 33, 3019-3035, doi:10.1175/jcli-d-19-0236.1.
- Li, X., F. Liu, and M. Fang, 2020: Harmonizing models and observations: Data assimilation in Earth system science. Science China-Earth Sciences, 63, 1059-1068, doi:10.1007/s11430-019-9620-x.
- Liu, Y. S., Z. Q. Gong, C. Sun, J. P. Li, and L. Wang, 2020: Multidecadal Seesaw in Hadley Circulation Strength Between the Two Hemispheres Caused by the Atlantic Multidecadal Variability. Frontiers in Earth Science, 8, doi:10.3389/feart.2020.580457.
- Loope, G., D. Thompson, and J. Overpeck, 2020: The spectrum of Asian Monsoon variability: A proxy system model approach to the hydroclimate scaling mismatch. Quaternary Science Reviews, 240, doi:10.1016/j.quascirev.2020.106362.
- Lucio-Eceiza, E. E., J. F. Gonzalez-Rouco, E. Garcia-Bustamante, J. Navarro, C. Rojas-Labanda, and H. Beltrami, 2020: Summertime Surface Wind Variability over Northeastern North America at Multidecadal to Centennial Time Scales via Statistical Downscaling. J. Clim., 33, 1969-1990, doi:10.1175/jcli-d-19-0331.1.
- Luo, H., F. Zheng, N. Keenlyside, and J. Zhu, 2020: Ocean-atmosphere coupled Pacific Decadal variability simulated by a climate model. Climate Dynamics, 54, 4759-4773, doi:10.1007/s00382-020-05248-9.
- Martineau, P., H. Nakamura, Y. Kosaka, B. Taguchi, and M. Mori, 2020: Modulations of North American and European Weather Variability and Extremes by Interdecadal Variability of the Atmospheric Circulation over the North Atlantic Sector. J. Clim., 33, 8125-8146, doi:10.1175/jcli-d-19-0977.1.
- Massmann, C., 2020: Evaluating the Suitability of Century-Long Gridded Meteorological Datasets for Hydrological Modeling. Journal of Hydrometeorology, 21, 2565-2580, doi:10.1175/jhm-d-19-0113.1.
- McCabe, G. J., and D. M. Wolock, 2020: Hydro-Climatic Drought in the Delaware River Basin. Journal of the American Water Resources Association, 56, 981-994, doi:10.1111/1752-1688.12875.
- McCabe, G. J., and D. M. Wolock, 2021: Multi-year hydroclimatic droughts and pluvials across the conterminous United States. International Journal of Climatology, 41, 1731-1746, doi:10.1002/joc.6925.
- McDonald, A. J., and L. H. Cairns, 2020: A New Method to Evaluate Reanalyses Using Synoptic Patterns: An Example Application in the Ross Sea/Ross Ice Shelf Region. Earth and Space Science, 7, doi:10.1029/2019ea000794.
- Mekhaldi, F., and Coauthors, 2020: Radionuclide wiggle matching reveals a nonsynchronous early Holocene climate oscillation in Greenland and western Europe around a grand solar minimum. Climate of the Past, 16, 1145-1157, doi:10.5194/cp-16-1145-2020.
- Melnikova, I., and T. Sasai, 2020: Effects of Anthropogenic Activity on Global Terrestrial Gross Primary Production. Journal of Geophysical Research-Biogeosciences, 125, doi:10.1029/2019jg005403.
- Merrifield, A. L., L. Brunner, R. Lorenz, I. Medhaug, and R. Knutti, 2020: An investigation of weighting schemes suitable for incorporating large ensembles into multi-model ensembles. Earth System Dynamics, 11, 807-834, doi:10.5194/esd-11-807-2020.
- Meucci, A., I. R. Young, O. J. Aarnes, and O. Breivik, 2020: Comparison of Wind Speed and Wave Height Trends from Twentieth-Century Models and Satellite Altimeters. J. Clim., 33, 611-624, doi:10.1175/jcli-d-19-0540.1.
- Mezzina, B., J. Garcia-Serrano, I. Blade, and F. Kucharski, 2020: Dynamics of the ENSO Teleconnection and NAO Variability in the North Atlantic-European Late Winter. J. Clim., 33, 907-923, doi:10.1175/jcli-d-19-0192.1.
- Miao, J. P., T. Wang, and H. J. Wang, 2020: Interdecadal Variations of the East Asian Winter Monsoon in CMIP5 Preindustrial Simulations. J. Clim., 33, doi:10.1175/jcli-d-19-0148.1.
- Min, S. K., 2020: Human fingerprint in global weather. Nature Climate Change, 10, 15-16, doi:10.1038/s41558-019-0670-y.
- Mokhov, II, A. V. Chernokulsky, and A. M. Osipov, 2020: Atmospheric Centers of Action in the Northern and Southern Hemispheres: Features and Variability. Russ Meteorol Hydro+, 45, 749-761, doi:10.3103/s1068373920110011.
- Molteni, F., and Coauthors, 2020: Boreal-winter teleconnections with tropical Indo-Pacific rainfall in HighResMIP historical simulations from the PRIMAVERA project. Climate Dynamics, 55, 1843-1873, doi:10.1007/s00382-020-05358-4.
- Muller, W. A., L. Borchert, and R. Ghosh, 2020: Observed Subdecadal Variations of European Summer Temperatures. Geophysical Research Letters, 47, doi:10.1029/2019gl086043.
- Munoz, S. E., and Coauthors, 2020: Lipid Biomarker Record Documents Hydroclimatic Variability of the Mississippi River Basin During the Common Era. Geophysical Research Letters, 47, doi:10.1029/2020gl087237.
- Najibi, N., A. Mazor, N. Devineni, C. Mossel, and J. F. Booth, 2020: Understanding the Spatial Organization of Simultaneous Heavy Precipitation Events Over the Conterminous United States. Journal of Geophysical Research-Atmospheres, 125, doi:10.1029/2020jd033036.
- Nayak, M. A., M. K. Cowles, G. Villarini, and B. Ul Wafa, 2020: Bayesian Hierarchical Models for the Frequency of Winter Heavy Precipitation Events Over the Central United States: The Role of Atmospheric Rivers. Water Resources Research, 56, doi:10.1029/2020wr028256.
- Nicholson, S. E., and D. Klotter, 2021: The Tropical Easterly Jet over Africa, its representation in six reanalysis products, and its association with Sahel rainfall. International Journal of Climatology, 41, 328-347, doi:10.1002/joc.6623.
- Nitta, T., T. Arakawa, M. Hatono, A. Takeshima, and K. Yoshimura, 2020: Development of Integrated Land Simulator. Progress in Earth and Planetary Science, 7, doi:10.1186/s40645-020-00383-7.
- Noone, S., and Coauthors: Progress towards a holistic land and marine surface meteorological database and a call for additional contributions. Geoscience Data Journal, doi:10.1002/gdj3.109.
- Nordli, O., P. Wyszynski, H. M. Gjelten, K. Isaksen, E. Lupikasza, T. Niedzwiedz, and R. Przybylak, 2020: Revisiting the extended Svalbard Airport monthly temperature series, and the compiled corresponding daily series 1898-2018. Polar Research, 39, doi:10.33265/polar.v39.3614.
- O'Reilly, C. H., D. J. Befort, and A. Weisheimer, 2020: Calibrating large-ensemble European climate projections using observational data. Earth System Dynamics, 11, 1033-1049, doi:10.5194/esd-11-1033-2020.
- Paik, S., and S. K. Min, 2020: Quantifying the Anthropogenic Greenhouse Gas Contribution to the Observed Spring Snow-Cover Decline Using the CMIP6 Multimodel Ensemble. J. Clim., 33, 9261-9269, doi:10.1175/jcli-d-20-0002.1.
- Parfitt, R., C. C. Ummenhofer, B. M. Buckley, K. G. Hansen, and R. D. D'Arrigo, 2020: Distinct seasonal climate drivers revealed in a network of tree-ring records from Labrador, Canada. Climate Dynamics, 54, 1897-1911, doi:10.1007/s00382-019-05092-6.
- Pearl, J. K., K. J. Anchukaitis, N. Pederson, and J. P. Donnelly, 2020: Multivariate Climate Field Reconstructions Using Tree Rings for the Northeastern United States. Journal of Geophysical Research-Atmospheres, 125, doi:10.1029/2019jd031619.
- Pena, J. C., and L. Schulte, 2020: Simulated and reconstructed atmospheric variability and their relation with large Pre-industrial summer floods in the Hasli-Aare catchment (Swiss Alps) since 1300 CE. Global and Planetary Change, 190, doi:10.1016/j.gloplacha.2020.103191.
- Penna, A. C., R. R. Torres, S. R. Garcia, and J. A. Marengo, 2021: Moisture flows on Southeast Brazil: Present and future climate. International Journal of Climatology, 41, E935-E951, doi:10.1002/joc.6738.
- Perkins, W. A., and G. Hakim, 2020: Linear Inverse Modeling for Coupled Atmosphere-Ocean Ensemble Climate Prediction. Journal of Advances in Modeling Earth Systems, 12, doi:10.1029/2019ms001778.
- Piecuch, C. G., 2020: Likely weakening of the Florida Current during the past century revealed by sea-level observations. Nature Communications, 11, doi:10.1038/s41467-020-17761-w.
- Pinheiro, E., R. P. da Rocha, and A. Drumond, 2021: Assessment of 20th-century reanalysis circulation patterns associated with El Nino-Southern Oscillation impacts on the tropical Atlantic and northeastern Brazil rainy season. International Journal of Climatology, 41, 3824-3840, doi:10.1002/joc.6750.
- Pinheiro, H. R., K. I. Hodges, and M. A. Gan, 2020: An intercomparison of subtropical cut-off lows in the Southern Hemisphere using recent reanalyses: ERA-Interim, NCEP-CFRS, MERRA-2, JRA-55, and JRA-25. Climate Dynamics, 54, 777-792, doi:10.1007/s00382-019-05089-1.
- Pohl, E., C. Grenier, M. Vrac, and M. Kageyama, 2020: Emerging climate signals in the Lena River catchment: a non-parametric statistical approach. Hydrology and Earth System Sciences, 24, 2817-2839, doi:10.5194/hess-24-2817-2020.
- Polvani, L. M., and S. J. Camargo, 2020: Scant evidence for a volcanically forced winter warming over Eurasia following the Krakatau eruption of August 1883. Atmospheric Chemistry and Physics, 20, 13687-13700, doi:10.5194/acp-20-13687-2020.
- Przybylak, R., and P. Wyszynski, 2020: Air temperature changes in the Arctic in the period 1951-2015 in the light of observational and reanalysis data. Theoretical and Applied Climatology, 139, 75-94, doi:10.1007/s00704-019-02952-3.
- Raavi, P. H., and K. J. E. Walsh, 2020: Basinwise Statistical Analysis of Factors Limiting Tropical Storm Formation From an Initial Tropical Circulation. Journal of Geophysical Research-Atmospheres, 125, doi:10.1029/2019jd032006.
- Raavi, P. H., and K. J. E. Walsh, 2020: Sensitivity of Tropical Cyclone Formation to Resolution-Dependent and Independent Tracking Schemes in High-Resolution Climate Model Simulations. Earth and Space Science, 7, doi:10.1029/2019ea000906.
- Rajesh, P. V., and B. N. Goswami, 2020: Four-dimensional structure and sub-seasonal regulation of the Indian summer monsoon multi-decadal mode. Climate Dynamics, 55, 2645-2666, doi:10.1007/s00382-020-05407-y.
- Rao, K. K., and Coauthors, 2020: Projections of heat stress and associated work performance over India in response to global warming. Scientific Reports, 10, doi:10.1038/s41598-020-73245-3.
- Ratna, S. B., T. J. Osborn, M. Joshi, and J. Luterbacher, 2020: The Influence of Atlantic Variability on Asian Summer Climate Is Sensitive to the Pattern of the Sea Surface Temperature Anomaly. J. Clim., 33, 7567-7590, doi:10.1175/jcli-d-20-0039.1.
- Raynaud, D., B. Hingray, G. Evin, A. C. Favre, and J. Chardon, 2020: Assessment of meteorological extremes using a synoptic weather generator and a downscaling model based on analogues. Hydrology and Earth System Sciences, 24, 4339-4352, doi:10.5194/hess-24-4339-2020.
- Ren, Q. P., Y. L. Li, F. Wang, J. Duan, S. J. Hu, and F. J. Wang, 2020: Variability of the Mindanao Current Induced by El Ni(n)over-tildeo Events. J Phys Oceanogr, 50, 1753-1772, doi:10.1175/jpo-d-19-0150.1.
- Ren, Q. P., Y. L. Li, F. Zheng, F. Wang, J. Duan, and R. Li, 2020: Asymmetry of Interannual Sea Level Variability in the Western Tropical Pacific: Responses to El Nino and La Nina. Journal of Geophysical Research-Oceans, 125, doi:10.1029/2020jc016616.
- Ribera, P., P. Ordonez, D. Gallego, and C. Pena-Ortiz, 2020: Internal variability and external forcings in the ocean-atmosphere multidecadal oscillator over the North Atlantic. Climate Dynamics, 55, 909-923, doi:10.1007/s00382-020-05300-8.
- Rivera, J. A., and G. Arnould, 2020: Evaluation of the ability of CMIP6 models to simulate precipitation over Southwestern South America: Climatic features and long-term trends (1901-2014). Atmospheric Research, 241, doi:10.1016/j.atmosres.2020.104953.
- Robertson, F. R., and Coauthors, 2020: Uncertainties in Ocean Latent Heat Flux Variations over Recent Decades in Satellite-Based Estimates and Reduced Observation Reanalyses. J. Clim., 33, 8415-8437, doi:10.1175/jcli-d-19-0954.1.
- Robson, J., and Coauthors, 2020: The Evaluation of the North Atlantic Climate System in UKESM1 Historical Simulations for CMIP6. Journal of Advances in Modeling Earth Systems, 12, doi:10.1029/2020ms002126.
- Rocha, E., B. E. Gunnarson, and S. Holzkamper, 2020: Reconstructing Summer Precipitation with MXD Data fromPinus sylvestrisGrowing in the Stockholm Archipelago. Atmosphere, 11, doi:10.3390/atmos11080790.
- Rohmer, J., J. Louisor, G. Le Cozannet, P. Naveau, S. Thao, and X. Bertin, 2020: Attribution of Extreme Wave Height Records along the North Atlantic Coasts using Hindcast Data: Feasibility and Limitations. Journal of Coastal Research, 1268-1272, doi:10.2112/si95-245.1.
- Roy, I., 2020: Major Climate Variability and Natural Factors in Boreal Winter. Pure and Applied Geophysics, 177, 4983-5005, doi:10.1007/s00024-020-02522-z.
- Sabatier, P., and Coauthors, 2020: Past African dust inputs in the western Mediterranean area controlled by the complex interaction between the Intertropical Convergence Zone, the North Atlantic Oscillation, and total solar irradiance. Climate of the Past, 16, 283-298, doi:10.5194/cp-16-283-2020.
- Salinger, M. J., and Coauthors, 2020: Unparalleled coupled ocean-atmosphere summer heatwaves in the New Zealand region: drivers, mechanisms and impacts. Climatic Change, 162, 485-506, doi:10.1007/s10584-020-02730-5.
- Santolaria-Otin, M., and O. Zolina, 2020: Evaluation of snow cover and snow water equivalent in the continental Arctic in CMIP5 models. Climate Dynamics, 55, 2993-3016, doi:10.1007/s00382-020-05434-9.
- Saunders, M. A., P. J. Klotzbach, A. S. R. Lea, C. J. Schreck, and M. M. Bell, 2020: Quantifying the Probability and Causes of the Surprisingly Active 2018 North Atlantic Hurricane Season. Earth and Space Science, 7, doi:10.1029/2019ea000852.
- Schrapffer, A., A. Sorensson, J. Polcher, and L. Fita, 2020: Benefits of representing floodplains in a Land Surface Model: Pantanal simulated with ORCHIDEE CMIP6 version. Climate Dynamics, 55, 1303-1323, doi:10.1007/s00382-020-05324-0.
- Scussolini, P., and Coauthors, 2020: Global River Discharge and Floods in the Warmer Climate of the Last Interglacial. Geophysical Research Letters, 47, doi:10.1029/2020gl089375. Serykh, I. V., A. V. Tolstikov, and Iop, 2019: On the climatic changes of the surface air temperature in the White Sea region. All-Russian Conference on Climate Change - Causes, Risks, Consequences, Problems of Adaptation and Management (CLIMATE), Russian Acad Sci, Presidium, Moscow, RUSSIA.
- Shen, S. S. P., J. Pierret, I. Dorado, and S. Ilawe, 2020: 4DVD visualization and delivery of the 20th century reanalysis data: methods and examples. Theoretical and Applied Climatology, 142, 243-254, doi:10.1007/s00704-020-03288-z.
- Sherman, P., E. Tziperman, C. Deser, and M. McElroy, 2020: Historical and Future Roles of Internal Atmospheric Variability in Modulating Summertime Greenland Ice Sheet Melt. Geophysical Research Letters, 47, doi:10.1029/2019gl086913.
- Si, D., D. B. Jiang, A. X. Hu, and X. M. Lang, 2021: Variations in northeast Asian summer precipitation driven by the Atlantic multidecadal oscillation. International Journal of Climatology, 41, 1682-1695, doi:10.1002/joc.6912.
- Si, D., D. B. Jiang, and H. J. Wang, 2020: Intensification of the Atlantic Multidecadal Variability Since 1870: Implications and Possible Causes. Journal of Geophysical Research-Atmospheres, 125, doi:10.1029/2019jd030977.
- Simon, M. H., and Coauthors, 2020: A multi-decadal record of oceanographic changes of the past similar to 165 years (1850-2015 AD) from Northwest of Iceland. Plos One, 15, doi:10.1371/journal.pone.0239373.
- Simpson, I. R., and Coauthors, 2020: An Evaluation of the Large-Scale Atmospheric Circulation and Its Variability in CESM2 and Other CMIP Models. Journal of Geophysical Research-Atmospheres, 125, doi:10.1029/2020jd032835.
- Sippel, S., E. M. Fischer, S. C. Scherrer, N. Meinshausen, and R. Knutti, 2020: Late 1980s abrupt cold season temperature change in Europe consistent with circulation variability and long-term warming. Environmental Research Letters, 15, doi:10.1088/1748-9326/ab86f2.
- Sippel, S., N. Meinshausen, E. M. Fischer, E. Szekely, and R. Knutti, 2020: Climate change now detectable from any single day of weather at global scale. Nature Climate Change, 10, 35-+, doi:10.1038/s41558-019-0666-7.
- Sjolte, J., F. Adolphi, B. M. Vinther, R. Muscheler, C. Sturm, M. Werner, and G. Lohmann, 2020: Seasonal reconstructions coupling ice core data and an isotope-enabled climate model - methodological implications of seasonality, climate modes and selection of proxy data. Climate of the Past, 16, 1737-1758, doi:10.5194/cp-16-1737-2020.
- Stolpe, M. B., K. Cowtan, I. Medhaug, and R. Knutti, 2021: Pacific variability reconciles observed and modelled global mean temperature increase since 1950. Climate Dynamics, 56, 613-634, doi:10.1007/s00382-020-05493-y.
- Strong, C., G. J. McCabe, and A. Weech, 2020: Step Increase in Eastern US Precipitation Linked to Indian Ocean Warming. Geophysical Research Letters, 47, doi:10.1029/2020gl088911.
- Stucki, P., P. Froidevaux, M. Zamuriano, F. A. Isotta, M. Messmer, and A. Martynov, 2020: Simulations of the 2005, 1910, and 1876 Vb cyclones over the Alps - sensitivity to model physics and cyclonic moisture flux. Natural Hazards and Earth System Sciences, 20, 35-57, doi:10.5194/nhess-20-35-2020.
- Sun, C., Y. S. Liu, Z. Q. Gong, F. Kucharski, J. P. Li, Q. Y. Wang, and X. Li, 2020: The Footprint of Atlantic Multidecadal Oscillation on the Intensity of Tropical Cyclones Over the Western North Pacific. Frontiers in Earth Science, 8, doi:10.3389/feart.2020.604807.
- Sung, M. K., C. Yoo, S. W. Yeh, Y. Kosaka, and S. I. An, 2020: Characteristics of the North Pacific Oscillation in CMIP5 Models in Relation to Atmospheric Mean States. J. Clim., 33, 3809-3825, doi:10.1175/jcli-d-19-0446.1.
- Tadesse, M., T. Wahl, and A. Cid, 2020: Data-Driven Modeling of Global Storm Surges. Frontiers in Marine Science, 7, doi:10.3389/fmars.2020.00260.
- Tafasca, S., A. Ducharne, and C. Valentin, 2020: Weak sensitivity of the terrestrial water budget to global soil texture maps in the ORCHIDEE land surface model. Hydrology and Earth System Sciences, 24, 3753-3774, doi:10.5194/hess-24-3753-2020.
- Tamang, S. K., A. M. Ebtehaj, A. F. Prein, and A. J. Heymsfield, 2020: Linking Global Changes of Snowfall and Wet-Bulb Temperature. J. Clim., 33, 39-59, doi:10.1175/jcli-d-19-0254.1.
- Tan, W., Z. X. Wei, Q. Liu, Q. J. Fu, M. Y. Chen, B. T. Li, and J. Li, 2020: Different Influences of Two El Nino Types on Low-Level Atmospheric Circulation over the Subtropical Western North Pacific. J. Clim., 33, 825-846, doi:10.1175/jcli-d-19-0223.1.
- Tedesco, M., and X. Fettweis, 2020: Unprecedented atmospheric conditions (1948-2019) drive the 2019 exceptional melting season over the Greenland ice sheet. Cryosphere, 14, 1209-1223, doi:10.5194/tc-14-1209-2020.
- Thapa, U. K., S. St George, and V. Trouet, 2020: Poleward Excursions by the Himalayan Subtropical Jet Over the Past Four Centuries. Geophysical Research Letters, 47, doi:10.1029/2020gl089631.
- Thatcher, D. L., and Coauthors, 2020: Hydroclimate variability from western Iberia (Portugal) during the Holocene: Insights from a composite stalagmite isotope record. Holocene, 30, 966-981, doi:10.1177/0959683620908648.
- Thomas, N., S. Nigam, and V. Ravi, 2021: Seasonality in the Vertical Structure of Long-Term Temperature Trends Over North America. Atmosphere-Ocean, 59, 29-38, doi:10.1080/07055900.2020.1855409.
- Topal, D., I. G. Hatvani, and Z. Kern, 2020: Refining projected multidecadal hydroclimate uncertainty in East-Central Europe using CMIP5 and single-model large ensemble simulations. Theoretical and Applied Climatology, 142, 1147-1167, doi:10.1007/s00704-020-03361-7.
- Tseng, Y. H., R. Q. Ding, S. Zhao, Y. C. Kuo, and Y. C. Liang, 2020: Could the North Pacific Oscillation Be Modified by the Initiation of the East Asian Winter Monsoon? J. Clim., 33, 2389-2406, doi:10.1175/jcli-d-19-0112.1.
- Tuel, A., and E. A. B. Eltahir, 2020: Why Is the Mediterranean a Climate Change Hot Spot? J. Clim., 33, 5829-5843, doi:10.1175/jcli-d-19-0910.1.
- Vega, I., P. Ribera, and D. Gallego, 2020: Characteristics of the Onset, Withdrawal, and Breaks of the Western North Pacific Summer Monsoon in the 1949-2014 Period. J. Clim., 33, 7371-7389, doi:10.1175/jcli-d-19-0734.1.
- Veiga, S. F., E. Giarolla, P. Nobre, and C. A. Nobre, 2020: Analyzing the Influence of the North Atlantic Ocean Variability on the Atlantic Meridional Mode on Decadal Time Scales. Atmosphere, 11, doi:10.3390/atmos11010003.
- Wahl, E. R., A. Hoell, E. Zorita, E. Gille, and H. F. Diaz, 2020: A 450-Year Perspective on California Precipitation "Flips". J. Clim., 33, 10221-10237, doi:10.1175/jcli-d-19-0828.1.
- Wang, A. H., and X. H. Kong, 2021: Regional climate model simulation of soil moisture and its application in drought reconstruction across China from 1911 to 2010. International Journal of Climatology, 41, E1028-E1044, doi:10.1002/joc.6748.
- Wang, C. G., Y. Y. Hu, X. Y. Wen, C. Zhou, and J. P. Liu, 2020: Inter-model spread of the climatological annual mean Hadley circulation and its relationship with the double ITCZ bias in CMIP5. Climate Dynamics, 55, 2823-2834, doi:10.1007/s00382-020-05414-z.
- Wang, J., J. M. Feng, Z. W. Yan, Y. Qiu, and L. J. Cao, 2020: An analysis of the urbanization contribution to observed terrestrial stilling in the Beijing-Tianjin-Hebei region of China. Environmental Research Letters, 15, doi:10.1088/1748-9326/ab7396.
- Wang, Y., and Coauthors, 2020: Sensitivity of Snow Simulations to Different Atmospheric Forcing Data Sets in the Land Surface Model CAS-LSM. Journal of Geophysical Research-Atmospheres, 125, doi:10.1029/2019jd032001.
- Wang, Z. Y., T. Li, J. Y. Gao, and M. Peng, 2020: Enhanced winter and summer trend difference of Madden-Julian Oscillation intensity since 1871. International Journal of Climatology, 40, 6369-6381, doi:10.1002/joc.6586.
- Weisheimer, A., D. J. Befort, D. MacLeod, T. Palmer, C. O'Reilly, and K. Strommen, 2020: Seasonal Forecasts of the Twentieth Century. Bulletin of the American Meteorological Society, 101, E1413-E1426, doi:10.1175/bams-d-19-0019.1.
- Whiting, J. M., T. P. Wang, Z. Q. Yang, M. H. Huesemann, P. J. Wolfram, T. F. Mumford, and D. Righi, 2020: Simulating the Trajectory and Biomass Growth of Free-Floating Macroalgal Cultivation Platforms along the U.S. West Coast. Journal of Marine Science and Engineering, 8, doi:10.3390/jmse8110938.
- Wohland, J., D. Brayshaw, H. Bloomfield, and M. Wild, 2020: European multidecadal solar variability badly captured in all centennial reanalyses except CERA20C. Environmental Research Letters, 15, doi:10.1088/1748-9326/aba7e6.
- Woodhouse, C. A., D. M. Meko, and E. R. Bigio, 2020: A Long View of Southern California Water Supply: Perfect Droughts Revisited. Journal of the American Water Resources Association, 56, 212-229, doi:10.1111/1752-1688.12822.
- Wu, B. L., X. P. Lin, and L. S. Yu, 2020: Decadal to Multidecadal Variability of the Mixed Layer to the South of the Kuroshio Extension Region. J. Clim., 33, 7697-7714, doi:10.1175/jcli-d-20-0115.1.
- Wu, Y. K., A. Y. Huang, C. K. Wu, C. C. Hong, and C. C. Chang, 2020: Effect of Warm SST in the Subtropical Eastern North Pacific on Triggering the Abrupt Change of the Mei-Yu Rainfall over South China in the Early 1990s. J. Clim., 33, 657-673, doi:10.1175/jcli-d-18-0292.1.
- Xiao, F. A., D. X. Wang, and L. Yang, 2020: Can Tropical Pacific Winds Enhance the Footprint of the Interdecadal Pacific Oscillation on the Upper-Ocean Heat Content in the South China Sea? J. Clim., 33, 4419-4437, doi:10.1175/jcli-d-19-0679.1.
- Xiao, X. C., D. Q. Huang, B. Yang, J. Zhu, P. W. Yan, and Y. C. Zhang, 2020: Contributions of Different Combinations of the IPO and AMO to the Concurrent Variations of Summer East Asian Jets. J. Clim., 33, 7967-7982, doi:10.1175/jcli-d-19-0366.1.
- Xie, M. M., and C. Z. Wang, 2020: Decadal Variability of the Anticyclone in the Western North Pacific. J. Clim., 33, 9031-9043, doi:10.1175/jcli-d-20-0008.1.
- Xing, C., F. Liu, B. Wang, D. L. Chen, J. Liu, and B. Liu, 2020: Boreal Winter Surface Air Temperature Responses to Large Tropical Volcanic Eruptions in CMIP5 Models. J. Clim., 33, 2407-2426, doi:10.1175/jcli-d-19-0186.1.
- Xiong, P., and Coauthors, 2020: Modeling paleogeographic scenarios of the last glacial cycle as a base for source-to-sink studies: An example from the northwestern shelf of the South China Sea. Journal of Asian Earth Sciences, 203, doi:10.1016/j.jseaes.2020.104542.
- Xue, X., W. Chen, and Q. Zhou, 2020: Solar cycle modulation of the connection between boreal winter ENSO and following summer South Asia high. Journal of Atmospheric and Solar-Terrestrial Physics, 211, doi:10.1016/j.jastp.2020.105466.
- Yu, J., T. J. Zhou, and Z. H. Jiang, 2020: Interannual variability of the summer wind energy over China: A comparison of multiple datasets. Wind Energy, 23, 1726-1738, doi:10.1002/we.2512.
- Yu, L. J., S. Y. Zhong, C. J. Sui, and B. Sun, 2020: Revisiting the trend in the occurrences of the "warm Arctic-cold Eurasian continent" temperature pattern. Atmospheric Chemistry and Physics, 20, 13753-13770, doi:10.5194/acp-20-13753-2020.
- Yuan, T. L., H. B. Yu, M. Chin, L. A. Remer, D. McGee, and A. Evan, 2020: Anthropogenic Decline of African Dust: Insights From the Holocene Records and Beyond. Geophysical Research Letters, 47, doi:10.1029/2020gl089711.
- Zhai, F. G., and Y. Z. Gu, 2020: Abyssal Circulation in the Philippine Sea. Journal of Ocean University of China, 19, 249-262, doi:10.1007/s11802-020-4241-7.
- Zhang, G., H. Murakami, T. R. Knutson, R. Mizuta, and K. Yoshida, 2020: Tropical cyclone motion in a changing climate. Science Advances, 6, doi:10.1126/sciadv.aaz7610.
- Zhang, H. Y., C. H. Wu, P. J. F. Yeh, and B. X. Hu, 2020: Global pattern of short-term concurrent hot and dry extremes and its relationship to large-scale climate indices. International Journal of Climatology, 40, 5906-5924, doi:10.1002/joc.6555.
- Zhang, J. E., B. S. Felzer, and T. J. Troy, 2020: Projected changes of carbon balance in mesic grassland ecosystems in response to warming and elevated CO2 using CMIP5 GCM results in the Central Great Plains, USA. Ecol Model, 434, doi:10.1016/j.ecolmodel.2020.109247.
- Zhang, L., B. L. Gan, C. Y. Wang, L. X. Wu, and W. J. Cai, 2021: Decadal coupling between storm tracks and sea surface temperature in the Southern Hemisphere midlatitudes. Climate Dynamics, 56, 783-798, doi:10.1007/s00382-020-05503-z.
- Zhang, L., B. L. Gan, H. Wang, L. X. Wu, and W. J. Cai, 2020: Essential Role of the Midlatitude South Atlantic Variability in Altering the Southern Hemisphere Summer Storm Tracks. Geophysical Research Letters, 47, doi:10.1029/2020gl087910.
- Zhang, L., and W. Q. Han, 2020: Barrier for the Eastward Propagation of Madden-Julian Oscillation Over the Maritime Continent: A Possible New Mechanism. Geophysical Research Letters, 47, doi:10.1029/2020gl090211.
- Zhang, L., W. Lau, W. Tao, and Z. Li, 2020: Large Wildfires in the Western United States Exacerbated by Tropospheric Drying Linked to a Multi-Decadal Trend in the Expansion of the Hadley Circulation. Geophysical Research Letters, 47, doi:10.1029/2020gl087911.
- Zhang, R. J., Y. Y. Guo, Z. P. Wen, and R. G. Wu, 2020: Distinct patterns of sea surface temperature anomaly in the South Indian Ocean during austral autumn. Climate Dynamics, 54, 2663-2682, doi:10.1007/s00382-020-05135-3.
- Zhang, Y., G. X. Mao, C. C. Chen, Z. H. Lu, Z. Luo, and W. T. Zhou, 2020: Population exposure to concurrent daytime and nighttime heatwaves in Huai River Basin, China. Sustainable Cities and Society, 61, doi:10.1016/j.scs.2020.102309.
- Zhang, Y., B. D. Qian, and G. Hong, 2020: A Long-Term, 1-km Resolution Daily Meteorological Dataset for Modeling and Mapping Permafrost in Canada. Atmosphere, 11, doi:10.3390/atmos11121363.
- Zhao, J. W., R. F. Zhan, Y. Q. Wang, S. P. Xie, and Q. Wu, 2020: Untangling impacts of global warming and Interdecadal Pacific Oscillation on long-term variability of North Pacific tropical cyclone track density. Science Advances, 6, doi:10.1126/sciadv.aba6813.
- Zhao, S. Y., T. J. Zhou, and X. L. Chen, 2020: Consistency of extreme temperature changes in China under a historical half-degree warming increment across different reanalysis and observational datasets. Climate Dynamics, 54, 2465-2479, doi:10.1007/s00382-020-05128-2.
- Zhen, Y. C., P. Tandeo, S. Leroux, S. Metref, T. Penduff, and J. Le Sommer, 2020: An Adaptive Optimal Interpolation Based on Analog Forecasting: Application to SSH in the Gulf of Mexico. Journal of Atmospheric and Oceanic Technology, 37, 1697-1711, doi:10.1175/jtech-d-20-0001.1.
- Alexandrov, G. G., 2020: Climatically Driven Minimum of Energy Demand for Heating in Cities at the Center of the European Part of Russia. Izvestiya Atmospheric and Oceanic Physics, 56, 613-617, doi:10.1134/s000143382006002x.
- Allchin, M. I., and S. J. Dery, 2020: The Climatological Context of Trends in the Onset of Northern Hemisphere Seasonal Snow Cover, 1972-2017. Journal of Geophysical Research-Atmospheres, 125, doi:10.1029/2019jd032367.
- Ballinger, T. J., and Coauthors, 2021: The role of blocking circulation and emerging open water feedbacks on Greenland cold-season air temperature variability over the last century. International Journal of Climatology, 41, E2778-E2800, doi:10.1002/joc.6879.
- Bonfils, C. J. W., B. D. Santer, J. C. Fyfe, K. Marvel, T. J. Phillips, and S. R. H. Zimmerman, 2020: Human influence on joint changes in temperature, rainfall and continental aridity. Nature Climate Change, 10, 726-+, doi:10.1038/s41558-020-0821-1.
- Boustead, B. M., M. D. Shulski, and S. D. Hilberg, 2020: The Long Winter of 1880/81. Bulletin of the American Meteorological Society, 101, E797-E813, doi:10.1175/bams-d-19-0014.1.
- Bronnimann, S., 2020: Synthetic weather diaries: concept and application to Swiss weather in 1816. Climate of the Past, 16, 1937-1952, doi:10.5194/cp-16-1937-2020.
- Bronnimann, S., and S. Nichol, 2020: Total column ozone in New Zealand and in the UK in the 1950s. Atmospheric Chemistry and Physics, 20, 14333-14346, doi:10.5194/acp-20-14333-2020.
- Brugnara, Y., L. Pfister, L. Villiger, C. Rohr, F. A. Isotta, and S. Bronnimann, 2020: Early instrumental meteorological observations in Switzerland: 1708-1873. Earth System Science Data, 12, 1179-1190, doi:10.5194/essd-12-1179-2020.
- Camuffo, D., 2020: Key problems in early wine-spirit thermometers and the "true Reaumur" thermometer. Climatic Change, 163, 1083-1102, doi:10.1007/s10584-020-02910-3.
- Capozzi, V., Y. Cotroneo, P. Castagno, C. De Vivo, and G. Budillon, 2020: Rescue and quality control of sub-daily meteorological data collected at Montevergine Observatory (Southern Apennines), 1884-1963. Earth System Science Data, 12, 1467-1487, doi:10.5194/essd-12-1467-2020.
- Cheval, S., and Coauthors, 2021: Enriching the historical meteorological information using Romanian language newspaper reports: A database from 1880 to 1900. International Journal of Climatology, 41, E548-E562, doi:10.1002/joc.6709.
- Craig, P. M., and E. Hawkins, 2020: Digitizing observations from the Met Office Daily Weather Reports for 1900-1910 using citizen scientist volunteers. Geoscience Data Journal, 7, 116-134, doi:10.1002/gdj3.93.
- Dasgupta, P., A. Metya, C. V. Naidu, M. Singh, and M. K. Roxy, 2020: Exploring the long-term changes in the Madden Julian Oscillation using machine learning. Scientific Reports, 10, doi:10.1038/s41598-020-75508-5.
- Dunn, R. J. H., D. M. Stanitski, N. Gobron, and K. M. Willett, 2020: GLOBAL CLIMATE. Bulletin of the American Meteorological Society, 101, S17-S127, doi:Fogt, R. L., C. P. Belak, J. M. Jones, L. C. Slivinski, and G. P. Compo, 2021: An assessment of early 20th century Antarctic pressure reconstructions using historical observations. International Journal of Climatology, 41, E672-E689, doi:10.1002/joc.6718.
- Franke, J., V. Valler, S. Bronnimann, R. Neukom, and F. Jaume-Santero, 2020: The importance of input data quality and quantity in climate field reconstructions - results from the assimilation of various tree-ring collections. Climate of the Past, 16, 1061-1074, doi:10.5194/cp-16-1061-2020.
- Gao, M. X., S. Y. Yang, and T. Li, 2020: The Spatio-Temporal Variation of Pacific Blocking Frequency within Winter Months and Its Relationship with Surface Air Temperature. Atmosphere, 11, doi:10.3390/atmos11090960.
- Gergis, J., L. Ashcroft, and P. Whetton, 2020: A historical perspective on Australian temperature extremes. Climate Dynamics, 55, 843-868, doi:10.1007/s00382-020-05298-z.
- Gos, M., P. Baranowski, J. Krzyszczak, A. Kieliszek, and K. Siwek, 2021: Dynamics of meteorological time series on the base of ground measurements and retrospective data fromMERRA-2 for Poland. International Journal of Climatology, 41, E1531-E1552, doi:10.1002/joc.6787.
- Hernandez, A., and Coauthors, 2020: Modes of climate variability: Synthesis and review of proxy-based reconstructions through the Holocene. Earth-Science Reviews, 209, doi:10.1016/j.earscirev.2020.103286.
- Hobbs, W. R., A. R. Klekociuk, and Y. H. Pan, 2020: Validation of reanalysis Southern Ocean atmosphere trends using sea ice data. Atmospheric Chemistry and Physics, 20, 14757-14768, doi:10.5194/acp-20-14757-2020.
- Ionita, M., V. Nagavciuc, and B. Guan, 2020: Rivers in the sky, flooding on the ground: the role of atmospheric rivers in inland flooding in central Europe. Hydrology and Earth System Sciences, 24, 5125-5147, doi:10.5194/hess-24-5125-2020.
- Ionita, M., V. Nagavciuc, R. Kumar, and O. Rakovec, 2020: On the curious case of the recent decade, mid-spring precipitation deficit in central Europe. Npj Climate and Atmospheric Science, 3, doi:10.1038/s41612-020-00153-8.
- Luo, X., B. Wang, A. G. Frazier, and T. W. Giambelluca, 2020: Distinguishing Variability Regimes of Hawaiian Summer Rainfall: Quasi-Biennial and Interdecadal Oscillations. Geophysical Research Letters, 47, doi:10.1029/2020gl091260.
- Mazzoglio, P., I. Butera, and P. Claps, 2020: I-2-RED: A Massive Update and Quality Control of the Italian Annual Extreme Rainfall Dataset. Water, 12, doi:10.3390/w12123308.
- Merrifield, A. L., L. Brunner, R. Lorenz, I. Medhaug, and R. Knutti, 2020: An investigation of weighting schemes suitable for incorporating large ensembles into multi-model ensembles. Earth System Dynamics, 11, 807-834, doi:10.5194/esd-11-807-2020.
- Murphy, C., and Coauthors, 2020: The forgotten drought of 1765-1768: Reconstructing and re-evaluating historical droughts in the British and Irish Isles. International Journal of Climatology, 40, 5329-5351, doi:10.1002/joc.6521.
- Murray, D., and Coauthors, 2020: Facility for Weather and Climate Assessments (FACTS) A Community Resource for Assessing Weather and Climate Variability. Bulletin of the American Meteorological Society, 101, E1214-E1224, doi:10.1175/bams-d-19-0224.1.
- Noone, S., and Coauthors: Progress towards a holistic land and marine surface meteorological database and a call for additional contributions. Geoscience Data Journal, doi:10.1002/gdj3.109.
- Parsons, L. A., M. K. Brennan, R. C. J. Wills, and C. Proistosescu, 2020: Magnitudes and Spatial Patterns of Interdecadal Temperature Variability in CMIP6. Geophysical Research Letters, 47, doi:10.1029/2019gl086588.
- Pena, J. C., and L. Schulte, 2020: Simulated and reconstructed atmospheric variability and their relation with large Pre-industrial summer floods in the Hasli-Aare catchment (Swiss Alps) since 1300 CE. Global and Planetary Change, 190, doi:10.1016/j.gloplacha.2020.103191.
- Philip, S. Y., S. F. Kew, K. van der Wiel, N. Wanders, and G. J. van Oldenborgh, 2020: Regional differentiation in climate change induced drought trends in the Netherlands. Environmental Research Letters, 15, doi:10.1088/1748-9326/ab97ca.
- Rajesh, P. V., and B. N. Goswami, 2020: Four-dimensional structure and sub-seasonal regulation of the Indian summer monsoon multi-decadal mode. Climate Dynamics, 55, 2645-2666, doi:10.1007/s00382-020-05407-y.
- Rimbu, N., G. Lohmann, M. Ionita, M. Czymzik, and A. Brauer, 2021: Interannual to millennial-scale variability of River Ammer floods and its relationship with solar forcing. International Journal of Climatology, 41, E644-E655, doi:10.1002/joc.6715.
- Robertson, F. R., and Coauthors, 2020: Uncertainties in Ocean Latent Heat Flux Variations over Recent Decades in Satellite-Based Estimates and Reduced Observation Reanalyses. J. Clim., 33, 8415-8437, doi:10.1175/jcli-d-19-0954.1.
- Sandonis, L., J. C. Gonzalez-Hidalgo, D. Pena-Angulo, and S. Begueria, 2020: Mean temperature evolution on the Spanish mainland 1916-2015. Climate Research, 82, 177-189, doi:10.3354/cr01627.
- Shonk, J. K. P., A. G. Turner, A. Chevuturi, L. J. Wilcox, A. J. Dittus, and E. Hawkins, 2020: Uncertainty in aerosol radiative forcing impacts the simulated global monsoon in the 20th century. Atmospheric Chemistry and Physics, 20, 14903-14915, doi:10.5194/acp-20-14903-2020.
- Song, S. Y., S. W. Yeh, and J. H. Park, 2020: Dissimilar characteristics associated with the 1976/1977 and 1998/1999 climate regime shifts in the North Pacific. Theoretical and Applied Climatology, 142, 1463-1470, doi:10.1007/s00704-020-03378-y.
- Tardif, J. C., M. W. Salzer, F. Conciatori, A. G. Bunn, and M. K. Hughes, 2020: Formation, structure and climatic significance of blue rings and frost rings in high elevation bristlecone pine (Pinus longaeva DK Bailey). Quaternary Science Reviews, 244, doi:10.1016/j.quascirev.2020.106516.
- Thapa, U. K., S. St George, and V. Trouet, 2020: Poleward Excursions by the Himalayan Subtropical Jet Over the Past Four Centuries. Geophysical Research Letters, 47, doi:10.1029/2020gl089631.
- Topal, D., I. G. Hatvani, and Z. Kern, 2020: Refining projected multidecadal hydroclimate uncertainty in East-Central Europe using CMIP5 and single-model large ensemble simulations. Theoretical and Applied Climatology, 142, 1147-1167, doi:10.1007/s00704-020-03361-7.
- Valler, V., Y. Brugnara, J. Franke, and S. Bronnimann, 2020: Assimilating monthly precipitation data in a paleoclimate data assimilation framework. Climate of the Past, 16, 1309-1323, doi:10.5194/cp-16-1309-2020.
- Wahl, E. R., A. Hoell, E. Zorita, E. Gille, and H. F. Diaz, 2020: A 450-Year Perspective on California Precipitation "Flips". J. Clim., 33, 10221-10237, doi:10.1175/jcli-d-19-0828.1.
- Wohland, J., D. Brayshaw, H. Bloomfield, and M. Wild, 2020: European multidecadal solar variability badly captured in all centennial reanalyses except CERA20C. Environmental Research Letters, 15, doi:10.1088/1748-9326/aba7e6.
- Zhang, Y., B. D. Qian, and G. Hong, 2020: A Long-Term, 1-km Resolution Daily Meteorological Dataset for Modeling and Mapping Permafrost in Canada. Atmosphere, 11, doi:10.3390/atmos11121363.
2019
- Allen, K. J., and Coauthors, 2019: Tree-ring reconstructions of cool season temperature for far southeastern Australia, 1731-2007. Climate Dynamics, 53, 569-583, doi:10.1007/s00382-018-04602-2.
- Alvarez-Castro, M. C., D. Faranda, T. Noel, and P. Yiou, 2019: Recurrence Spectra of European Temperature in Historical Climate Simulations. Atmosphere, 10, doi:10.3390/atmos10040166.
- Alvarez-Garcia, F. J., M. J. OrtizBevia, W. Cabos, M. Tasambay-Salazar, and A. RuizdeElvira, 2019: Linear and nonlinear links of winter European precipitation to Northern Hemisphere circulation patterns. Climate Dynamics, 52, 6533-6555, doi:10.1007/s00382-018-4531-6.
- Amato, R., H. Steptoe, E. Buonomo, and R. Jones, 2019: High-Resolution History: Downscaling China's Climate from the 20CRv2c Reanalysis. Journal of Applied Meteorology and Climatology, 58, 2141-2157, doi:10.1175/jamc-d-19-0083.1.
- Anchukaitis, K. J., E. R. Cook, B. I. Cook, J. Pearl, R. D'Arrigo, and R. Wilson, 2019: Coupled Modes of North Atlantic Ocean-Atmosphere Variability and the Onset of the Little Ice Age. Geophysical Research Letters, 46, 12417-12426, doi:10.1029/2019gl084350.
- Anderson, B. T.: Empirical Evidence Linking the Pacific Decadal Precession to Kuroshio Extension Variability. Journal of Geophysical Research-Atmospheres, doi:10.1029/2019jd031163.
- Anderson, B. T., 2019: Empirical Evidence Linking the Pacific Decadal Precession to Kuroshio Extension Variability. Journal of Geophysical Research-Atmospheres, 124, 12845-12863, doi:10.1029/2019jd031163.
- Andreoli, R. V., and Coauthors, 2019: Effects of two different La Nina types on the South American rainfall. International Journal of Climatology, 39, 1415-1428, doi:10.1002/joc.5891.
- Antonov, A., G. Lohmann, M. Ionita, M. Dima, and L. Linsen, 2019: An interactive visual analysis tool for investigating teleconnections in climate simulations. Environmental Earth Sciences, 78, doi:10.1007/s12665-019-8295-z.
- Arazny, A., P. Wyszynski, and R. Przybylak, 2019: A comparison of bioclimatic conditions on Franz Josef Land (the Arctic) between the turn of the nineteenth to twentieth century and present day. Theoretical and Applied Climatology, 137, 2623-2638, doi:10.1007/s00704-018-02763-y.
- Ashcroft, L., D. J. Karoly, and A. J. Dowdy, 2019: Historical extreme rainfall events in southeastern Australia. Weather and Climate Extremes, 25, doi:10.1016/j.wace.2019.100210.
- Auger, J. D., P. A. Mayewski, K. A. Maasch, K. C. Schuenemann, A. M. Carleton, S. D. Birkel, and J. E. Saros, 2019: 2000 years of North Atlantic-Arctic climate. Quaternary Science Reviews, 216, 1-17, doi:10.1016/j.quascirev.2019.05.020.
- Babolcsai, G., and T. Hirsch, 2019: Teleconnection between mean sea level pressure in the North Atlantic for September, the AMO phase and mean temperature in Central Europe for December (1896-2015). Meteorological Applications, 26, 267-274, doi:10.1002/met.1760.
- Badaluta, C. A., A. Persoiu, M. Ionita, V. Nagavciuc, and P. I. Bistricean, 2019: Stable H and O isotope-based investigation of moisture sources and their role in river and groundwater recharge in the NE Carpathian Mountains, East-Central Europe. Isotopes in Environmental and Health Studies, 55, doi:10.1080/10256016.2019.1588895.
- Baduru, B., B. Paul, D. S. Banerjee, S. Sanikommu, and A. Paul, 2019: Ensemble based regional ocean data assimilation system for the Indian Ocean: Implementation and evaluation. Ocean Modelling, 143, doi:10.1016/j.ocemod.2019.101470.
- Baek, S. H., J. E. Smerdon, R. Seager, A. P. Williams, and B. I. Cook, 2019: Pacific Ocean Forcing and Atmospheric Variability Are the Dominant Causes of Spatially Widespread Droughts in the Contiguous United States. Journal of Geophysical Research-Atmospheres, 124, 2507-2524, doi:10.1029/2018jd029219.
- Baker, H. S., T. Woollings, C. E. Forest, and M. R. Allen, 2019: The Linear Sensitivity of the North Atlantic Oscillation and Eddy-Driven Jet to SSTs. J. Clim., 32, 6491-6511, doi:10.1175/jcli-d-19-0038.1.
- Ballesteros-Canovas, J. A., and Coauthors, 2019: On the extraordinary winter flood episode over the North Atlantic Basin in 1936. Annals of the New York Academy of Sciences, 1436, 206-216, doi:10.1111/nyas.13911.
- Baudouin, J. P., L. P. Caron, and M. Boudreault, 2019: Impact of reanalysis boundary conditions on downscaled Atlantic hurricane activity. Climate Dynamics, 52, 3709-3727, doi:10.1007/s00382-018-4352-7.
- Benestad, R. E., H. B. Erlandsen, A. Mezghani, and K. M. Parding, 2019: Geographical Distribution of Thermometers Gives the Appearance of Lower Historical Global Warming. Geophysical Research Letters, 46, 7654-7662, doi:10.1029/2019gl083474.
- Beniston, M., 2019: Modulation of extreme temperatures in Europe under extreme values of the North Atlantic Oscillation Index. Annals of the New York Academy of Sciences, 1436, 174-183, doi:10.1111/nyas.13636.
- Bertolacci, M., E. Cripps, O. Rosen, J. W. Lau, and S. Cripps, 2019: CLIMATE INFERENCE ON DAILY RAINFALL ACROSS THE AUSTRALIAN CONTINENT, 1876-2015. Annals of Applied Statistics, 13, 683-712, doi:10.1214/18-aoas1218.
- Bjorck, S., and Coauthors, 2019: A South Atlantic island record uncovers shifts in westerlies and hydroclimate during the last glacial. Climate of the Past, 15, 1939-1958, doi:10.5194/cp-15-1939-2019. Bokuchava, D. D., V. A. Semenov, and V. V. Popova, 2019: Features of the winter atmospheric circulation structure in the Northern Hemisphere from observations and 20th century reanalyses data. 25th International Symposium on Atmospheric and Ocean Optics: Atmospheric Physics, G. G. Matvienko, and O. A. Romanovskii, Eds.
- Bolles, K., M. Sweeney, and S. Forman, 2019: Meteorological catalysts of dust events and particle source dynamics of affected soils during the 1930s Dust Bowl drought, Southern High Plains, USA. Anthropocene, 27, doi:10.1016/j.ancene.2019.100216.
- Borchert, L. F., A. Duesterhus, S. Brune, W. A. Mueller, and J. Baehr, 2019: Forecast-Oriented Assessment of Decadal Hindcast Skill for North Atlantic SST. Geophysical Research Letters, 46, 11444-11454, doi:10.1029/2019gl084758.
- Borchert, L. F., A. Dusterhus, S. Brune, W. A. Muller, and J. Baehr, 2019: Forecast-Oriented Assessment of Decadal Hindcast Skill for North Atlantic SST. Geophysical Research Letters, 46, 11444-11454, doi:10.1029/2019gl084758.
- Bridgman, H., L. Ashcroft, K. Thornton, G. Di Gravio, and W. Oates, 2019: Meteorological observations for Eversleigh Station, near Armidale, New South Wales, Australia: 1877-1922. Geoscience Data Journal, 6, 174-188, doi:10.1002/gdj3.80.
- Bronnimann, S., and Coauthors, 2019: Unlocking Pre-1850 Instrumental Meteorological Records: A Global Inventory. Bulletin of the American Meteorological Society, 100, ES389-ES413, doi:10.1175/bams-d-19-0040.1.
- Bronnimann, S., and Coauthors, 2019: Last phase of the Little Ice Age forced by volcanic eruptions. Nature Geoscience, 12, 650-+, doi:10.1038/s41561-019-0402-y.
- Bronnimann, S., L. Frigerio, M. Schwander, M. Rohrer, P. Stucki, and J. Franke, 2019: Causes of increased flood frequency in central Europe in the 19th century. Climate of the Past, 15, 1395-1409, doi:10.5194/cp-15-1395-2019.
- Bronnimann, S., O. Martius, C. Rohr, D. N. Bresch, and K. H. E. Lin, 2019: Historical weather data for climate risk assessment. Annals of the New York Academy of Sciences, 1436, 121-137, doi:10.1111/nyas.13966.
- Bronnimann, S., and J. Wintzer, 2019: Climate data empathy. Wiley Interdisciplinary Reviews-Climate Change, 10, doi:10.1002/wcc.559.
- Bryan, S. P., K. A. Hughen, K. B. Karnauskas, and J. T. Farrar, 2019: Two Hundred Fifty Years of Reconstructed South Asian Summer Monsoon Intensity and Decadal-Scale Variability. Geophysical Research Letters, 46, 3927-3935, doi:10.1029/2018gl081593.
- Buckley, B. M., C. C. Ummenhofer, R. D. D'Arrigo, K. G. Hansen, L. H. Truong, C. N. Le, and D. K. Stahle, 2019: Interdecadal Pacific Oscillation reconstructed from trans-Pacific tree rings: 1350-2004 CE. Climate Dynamics, 53, 3181-3196, doi:10.1007/s00382-019-04694-4.
- Burgdorf, A. M., S. Bronnimann, and J. Franke, 2019: Two types of North American droughts related to different atmospheric circulation patterns. Climate of the Past, 15, 2053-2065, doi:10.5194/cp-15-2053-2019.
- Cagigal, L., and Coauthors, 2020: Historical and future storm surge around New Zealand: From the 19th century to the end of the 21st century. International Journal of Climatology, 40, 1512-1525, doi:10.1002/joc.6283.
- Cai, J. X., J. J. Xu, Z. Y. Guan, and A. M. Powell, 2019: Interdecadal variability of El Nino onset and its impact on monsoon systems over areas encircling the Pacific Ocean. Climate Dynamics, 52, 7173-7188, doi:10.1007/s00382-016-3377-z.
- Caillouet, L., J. P. Vidal, E. Sauquet, B. Graff, and J. M. Soubeyroux, 2019: SCOPE Climate: a 142-year daily high-resolution ensemble meteorological reconstruction dataset over France. Earth System Science Data, 11, 241-260, doi:10.5194/essd-11-241-2019.
- Camargo, S. J., and Coauthors, 2019: TROPICAL CYCLONE PREDICTION ON SUBSEASONAL TIME-SCALES. Tropical Cyclone Research and Review, 8, 150-165, doi:10.6057/2019tcrr03.04.
- Cao, D. D., Q. G. Wu, A. X. Hu, Y. H. Yao, S. Z. Liu, S. R. Schroeder, and F. C. Yang, 2019: Linear and nonlinear winter atmospheric responses to extreme phases of low frequency Pacific sea surface temperature variability. Climate Dynamics, 52, 49-68, doi:10.1007/s00382-018-4127-1.
- Castruccio, F. S., Y. Ruprich-Robert, S. G. Yeager, G. Danabasoglu, R. Msadek, and T. L. Delworth, 2019: Modulation of Arctic Sea Ice Loss by Atmospheric Teleconnections from Atlantic Multidecadal Variability. J. Clim., 32, 1419-1441, doi:10.1175/jcli-d-18-0307.1.
- Cauquoin, A., C. Risi, and E. Vignon, 2019: Importance of the advection scheme for the simulation of water isotopes over Antarctica by atmospheric general circulation models: A case study for present-day and Last Glacial Maximum with LMDZ-iso. Earth and Planetary Science Letters, 524, doi:10.1016/j.epsl.2019.115731.
- Cavanaugh, K. C., and Coauthors, 2019: Climate-driven regime shifts in a mangrove-salt marsh ecotone over the past 250 years. Proceedings of the National Academy of Sciences of the United States of America, 116, 21602-21608, doi:10.1073/pnas.1902181116.
- Centurioni, L. R., and Coauthors, 2019: Global in situ Observations of Essential Climate and Ocean Variables at the Air-Sea Interface. Frontiers in Marine Science, 6, doi:10.3389/fmars.2019.00419.
- Chafik, L., J. E. O. Nilsen, S. Dangendorf, G. Reverdin, and T. Frederikse, 2019: North Atlantic Ocean Circulation and Decadal Sea Level Change During the Altimetry Era. Scientific Reports, 9, doi:10.1038/s41598-018-37603-6.
- Champagne, O., M. A. Arain, and P. Coulibaly, 2019: Atmospheric circulation amplifies shift of winter streamflow in southern Ontario. Journal of Hydrology, 578, doi:10.1016/j.jhydrol.2019.124051.
- Champagne, O., B. Pohl, S. McKenzie, J. F. Buoncristiani, E. Bernard, D. Joly, and F. Tolle, 2019: Atmospheric circulation modulates the spatial variability of temperature in the Atlantic-Arctic region. International Journal of Climatology, 39, 3619-3638, doi:10.1002/joc.6044.
- Chan, D., E. C. Kent, D. I. Berry, and P. Huybers, 2019: Correcting datasets leads to more homogeneous early-twentieth-century sea surface warming. Nature, 571, 393-+, doi:10.1038/s41586-019-1349-2.
- Chang, K. Y., W. J. Riley, E. L. Brodie, C. K. McCalley, P. M. Crill, and R. F. Grant, 2019: Methane Production Pathway Regulated Proximally by Substrate Availability and Distally by Temperature in a High-Latitude Mire Complex. Journal of Geophysical Research-Biogeosciences, 124, 3057-3074, doi:10.1029/2019jg005355.
- Chang, K. Y., W. J. Riley, P. M. Crill, R. F. Grant, V. I. Rich, and S. R. Saleska, 2019: Large carbon cycle sensitivities to climate across a permafrost thaw gradient in subarctic Sweden. Cryosphere, 13, 647-663, doi:10.5194/tc-13-647-2019.
- Changnon, D., and V. A. Gensini, 2019: Changing Spatiotemporal Patterns of 5-and 10-Day Illinois Heavy Precipitation Amounts, 1900-2018. Journal of Applied Meteorology and Climatology, 58, 1523-1533, doi:10.1175/jamc-d-18-0335.1.
- Chatterjee, N., 2020: Soil erosion assessment in a humid, Eastern Himalayan watershed undergoing rapid land use changes, using RUSLE, GIS and high-resolution satellite imagery. Modeling Earth Systems and Environment, 6, 533-543, doi:10.1007/s40808-019-00700-0.
- Chen, Y. J., Y. T. Hwang, M. D. Zelinka, and C. Zhou, 2019: Distinct Patterns of Cloud Changes Associated with Decadal Variability and Their Contribution to Observed Cloud Cover Trends. J. Clim., 32, 7281-7301, doi:10.1175/jcli-d-18-0443.1. Cherenkova, E. A., and E. A. Dolgova, 2019: Multidecadal climate variability in the north of the Eastern European Plain and the tree-ring growth response. 25th International Symposium on Atmospheric and Ocean Optics: Atmospheric Physics, G. G. Matvienko, and O. A. Romanovskii, Eds.
- Chiodo, G., J. Oehrlein, L. M. Polvani, J. C. Fyfe, and A. K. Smith, 2019: Insignificant influence of the 11-year solar cycle on the North Atlantic Oscillation. Nature Geoscience, 12, 94-+, doi:10.1038/s41561-018-0293-3.
- Choudhary, A., A. P. Dimri, and H. Paeth, 2019: Added value of CORDEX-SA experiments in simulating summer monsoon precipitation over India. International Journal of Climatology, 39, 2156-2172, doi:10.1002/joc.5942.
- Chung, C. T. Y., S. B. Power, A. Sullivan, and F. Delage, 2019: The role of the South Pacific in modulating Tropical Pacific variability. Scientific Reports, 9, doi:10.1038/s41598-019-52805-2.
- Chung, E. S., A. Timmermann, B. J. Soden, K. J. Ha, L. Shi, and V. O. John, 2019: Reconciling opposing Walker circulation trends in observations and model projections. Nature Climate Change, 9, 405-+, doi:10.1038/s41558-019-0446-4.
- Churakov, M., C. J. Villabona-Arenas, M. U. G. Kraemer, H. Salje, and S. Cauchemez, 2019: Spatio-temporal dynamics of dengue in Brazil: Seasonal travelling waves and determinants of regional synchrony. Plos Neglected Tropical Diseases, 13, doi:10.1371/journal.pntd.0007012.
- Clark, L., and R. L. Fogt, 2019: Southern Hemisphere Pressure Relationships during the 20th Century-Implications for Climate Reconstructions and Model Evaluation. Geosciences, 9, doi:10.3390/geosciences9100413.
- Clifford, H. M., and Coauthors: A 2000 Year Saharan Dust Event Proxy Record from an Ice Core in the European Alps. Journal of Geophysical Research-Atmospheres, doi:10.1029/2019jd030725.
- Clifford, H. M., and Coauthors, 2019: A 2000 Year Saharan Dust Event Proxy Record from an Ice Core in the European Alps. Journal of Geophysical Research-Atmospheres, 124, 12882-12900, doi:10.1029/2019jd030725.
- Coburn, J. J., 2019: Assessing Wind Data from Reanalyses for the Upper Midwest. Journal of Applied Meteorology and Climatology, 58, 429-446, doi:10.1175/jamc-d-18-0164.1.
- Cordeira, J. M., J. Stock, M. D. Dettinger, A. M. Young, J. F. Kalansky, and F. M. Ralph, 2019: A 142-Year Climatology of Northern California Landslides and Atmospheric Rivers. Bulletin of the American Meteorological Society, 100, 1499-1509, doi:10.1175/bams-d-18-0158.1.
- Cronin, M. F., and Coauthors, 2019: Air-Sea Fluxes With a Focus on Heat and Momentum. Frontiers in Marine Science, 6, doi:10.3389/fmars.2019.00430.
- Cui, J. X., L. Wang, T. Li, and B. Wu, 2020: Can reanalysis products with only surface variables assimilated capture Madden-Julian oscillation characteristics? International Journal of Climatology, 40, 1279-1293, doi:10.1002/joc.6270.
- Dandi, R. A., J. S. Chowdary, P. A. Pillai, N. S. S. Sidhan, K. Koteswararao, and S. Ramakrishna, 2020: Impact of El Nino Modoki on Indian summer monsoon rainfall: Role of western north Pacific circulation in observations and CMIP5 models. International Journal of Climatology, 40, 2117-2133, doi:10.1002/joc.6322.
- Dangendorf, S., C. Hay, F. M. Calafat, M. Marcos, C. G. Piecuch, K. Berk, and J. Jensen, 2019: Persistent acceleration in global sea-level rise since the 1960s. Nature Climate Change, 9, 705-+, doi:10.1038/s41558-019-0531-8.
- de Lima, I. P., and S. Lovejoy, 2019: Analysis of fluctuations in precipitation in macrotime. Ribagua-Revista Iberoamericana Del Agua, 6, 101-110, doi:10.1080/23863781.2019.1642602.
- De Luca, P., C. Harpham, R. L. Wilby, J. K. Hillier, C. L. E. Franzke, and G. C. Leckebusch, 2019: Past and Projected Weather Pattern Persistence with Associated Multi-Hazards in the British Isles. Atmosphere, 10, doi:10.3390/atmos10100577.
- Delaygue, G., S. Bronnimann, P. D. Jones, J. Blanchet, and M. Schwander, 2019: Reconstruction of Lamb weather type series back to the eighteenth century. Climate Dynamics, 52, 6131-6148, doi:10.1007/s00382-018-4506-7.
- Devers, A., J. P. Vidal, C. Lauvernet, B. Graff, and O. Vannier, 2020: A framework for high-resolution meteorological surface reanalysis through offline data assimilation in an ensemble of downscaled reconstructions. Quarterly Journal of the Royal Meteorological Society, 146, 153-173, doi:10.1002/qj.3663.
- Dieppois, B., and Coauthors, 2019: Southern African summer-rainfall variability, and its teleconnections, on interannual to interdecadal timescales in CMIP5 models. Climate Dynamics, 53, 3505-3527, doi:10.1007/s00382-019-04720-5.
- Dimri, A. P., 2019: Comparison of regional and seasonal changes and trends in daily surface temperature extremes over India and its subregions. Theoretical and Applied Climatology, 136, 265-286, doi:10.1007/s00704-018-2486-5.
- Dinis, L., C. Begin, M. M. Savard, J. Marion, P. Brigode, and C. Alvarez, 2019: Tree-ring stable isotopes for regional discharge reconstruction in eastern Labrador and teleconnection with the Arctic Oscillation. Climate Dynamics, 53, 3625-3640, doi:10.1007/s00382-019-04731-2.
- Domeisen, D. I. V., 2019: Estimating the Frequency of Sudden Stratospheric Warming Events From Surface Observations of the North Atlantic Oscillation. Journal of Geophysical Research-Atmospheres, 124, 3180-3194, doi:10.1029/2018jd030077.
- Douville, H., A. Ribes, and S. Tyteca, 2019: Breakdown of NAO reproducibility into internal versus externally-forced components: a two-tier pilot study. Climate Dynamics, 52, 29-48, doi:10.1007/s00382-018-4141-3.
- Driver, P., B. Abiodun, and C. J. C. Reason, 2019: Modelling the precipitation response over southern Africa to the 2009-2010 El Nino using a stretched grid global atmospheric model. Climate Dynamics, 52, 3929-3949, doi:10.1007/s00382-018-4362-5.
- Duan, J., Y. L. Li, F. Wang, and Z. H. Chen, 2019: Decadal Variations of the Mindanao Current During 1960-2010. Journal of Geophysical Research-Oceans, 124, 2660-2678, doi:10.1029/2019jc014975.
- Etourneau, J., and Coauthors, 2019: Ocean temperature impact on ice shelf extent in the eastern Antarctic Peninsula. Nature Communications, 10, doi:10.1038/s41467-018-08195-6. Evgeniev, R., and K. Malcheva, 2019: Long-Term Air Temperature Variations in Some Urban Areas of Sofia Valley in the Context of Climate Change. 10th Jubilee Conference of the Balkan Physical Union, T. M. Mishonov, and A. M. Varonov, Eds.
- Fang, M., and X. Li, 2019: An Artificial Neural Networks-Based Tree Ring Width Proxy System Model for Paleoclimate Data Assimilation. Journal of Advances in Modeling Earth Systems, 11, 892-904, doi:10.1029/2018ms001525.
- Faranda, D., M. C. Alvarez-Castro, G. Messori, D. Rodrigues, and P. Yiou, 2019: The hammam effect or how a warm ocean enhances large scale atmospheric predictability. Nature Communications, 10, doi:10.1038/s41467-019-09305-8.
- Feng, J., J. P. Li, J. L. Zhu, Y. Li, and F. Li, 2019: The contrasting response of Hadley circulation to different meridional structure of sea surface temperature in CMIP5. Theoretical and Applied Climatology, 135, 633-647, doi:10.1007/s00704-018-2393-9.
- Foley, A. M., 2019: Long-term trends in large-scale circulation behaviour and wind storms for North Atlantic islands: a multi-data analysis using ERA-20C and meteorological station data. Climatic Change, 155, 323-338, doi:10.1007/s10584-019-02467-w.
- Freeman, E., and Coauthors, 2019: The International Comprehensive Ocean-Atmosphere Data Set - Meeting Users Needs and Future Priorities. Frontiers in Marine Science, 6, doi:10.3389/fmars.2019.00435.
- Gampe, D., J. Schmid, and R. Ludwig, 2019: Impact of Reference Dataset Selection on RCM Evaluation, Bias Correction, and Resulting Climate Change Signals of Precipitation. Journal of Hydrometeorology, 20, 1813-1828, doi:10.1175/jhm-d-18-0108.1.
- Gao, M. N., J. Yang, D. Y. Gong, P. J. Shi, Z. G. Han, and S. J. Kim, 2019: Footprints of Atlantic Multidecadal Oscillation in the Low-Frequency Variation of Extreme High Temperature in the Northern Hemisphere. J. Clim., 32, 791-802, doi:10.1175/jcli-d-18-0446.1.
- Geng, T., W. J. Cai, L. X. Wu, and Y. Yang, 2019: Atmospheric Convection Dominates Genesis of ENSO Asymmetry. Geophysical Research Letters, 46, 8387-8396, doi:10.1029/2019gl083213.
- Geng, T., Y. Yang, and L. X. Wu, 2019: On the Mechanisms of Pacific Decadal Oscillation Modulation in a Warming Climate. J. Clim., 32, 1443-1459, doi:10.1175/jcli-d-18-0337.1.
- Ghiggi, G., V. Humphrey, S. I. Seneviratne, and L. Gudmundsson, 2019: GRUN: an observation-based global gridded runoff dataset from 1902 to 2014. Earth System Science Data, 11, 1655-1674, doi:10.5194/essd-11-1655-2019.
- Ghosh, R., W. A. Muller, A. Eichhorn, J. Baehr, and J. Bader, 2019: Atmospheric pathway between Atlantic multidecadal variability and European summer temperature in the atmospheric general circulation model ECHAM6. Climate Dynamics, 53, 209-224, doi:10.1007/s00382-018-4578-4.
- Gil-Guirado, S., and A. Perez-Morales, 2019: Climatic variability and temperature and rainfall patterns in Murcia (1863-2017). Climate analysis techniques in the context of global change. Investigaciones Geograficas-Spain, 27-54, doi:10.14198/ingeo2019.71.02.
- Gomez-Delgado, F. D., D. Gallego, C. Pena-Ortiz, I. Vega, P. Ribera, and R. Garcia-Herrera, 2019: Long term variability of the northerly winds over the Eastern Mediterranean as seen from historical wind observations. Global and Planetary Change, 172, 355-364, doi:10.1016/j.gloplacha.2018.10.008.
- Graf, M., S. C. Scherrer, C. Schwierz, M. Begert, O. Martius, C. C. Raible, and S. Bronnimann, 2019: Near-surface mean wind in Switzerland: Climatology, climate model evaluation and future scenarios. International Journal of Climatology, 39, 4798-4810, doi:10.1002/joc.6108.
- Graham, E., and J. D. C. Webb, 2019: The very deep cold pool of 27 February-1 March 2018-historical precedents and perspective. Weather, 74, 85-91, doi:10.1002/wea.3471.
- Grossiord, C., and Coauthors, 2019: Precipitation mediates sap flux sensitivity to evaporative demand in the neotropics. Oecologia, 191, 519-530, doi:10.1007/s00442-019-04513-x.
- Gudlaugsdottir, H., J. Sjolte, A. E. Sveinbjornsdottir, M. Werner, and H. C. Steen-Larsen, 2019: North Atlantic weather regimes in delta O-18 of winter precipitation: isotopic fingerprint of the response in the atmospheric circulation after volcanic eruptions. Tellus Series B-Chemical and Physical Meteorology, 71, doi:10.1080/16000889.2019.1633848.
- Guo, R. X., C. Deser, L. Terray, and F. Lehner, 2019: Human Influence on Winter Precipitation Trends (1921-2015) over North America and Eurasia Revealed by Dynamical Adjustment. Geophysical Research Letters, 46, 3426-3434, doi:10.1029/2018gl081316.
- Harrington, L. J., F. E. L. Otto, T. Cowan, and G. C. Hegerl, 2019: Circulation analogues and uncertainty in the time-evolution of extreme event probabilities: evidence from the 1947 Central European heatwave. Climate Dynamics, 53, 2229-2247, doi:10.1007/s00382-019-04820-2.
- Hartten, L. M., P. E. Johnston, V. M. R. Castro, and P. S. E. Perez, 2019: Postdeployment Calibration of a Tropical UHF Profiling Radar via Surface- and Satellite-Based Methods. Journal of Atmospheric and Oceanic Technology, 36, 1729-1751, doi:10.1175/jtech-d-18-0020.1.
- Harvey, T., J. A. Renwick, A. M. Lorrey, and A. Ngari, 2019: The Representation of the South Pacific Convergence Zone in the Twentieth Century Reanalysis. Monthly Weather Review, 147, 841-851, doi:10.1175/mwr-d-18-0237.1.
- Haslinger, K., M. Hofstatter, C. Kroisleitner, W. Schoner, G. Laaha, F. Holawe, and G. Bloschl: Disentangling Drivers of Meteorological Droughts in the European Greater Alpine Region During the Last Two Centuries. Journal of Geophysical Research-Atmospheres, doi:10.1029/2018jd029527.
- Haslinger, K., M. Hofstatter, C. Kroisleitner, W. Schoner, G. Laaha, F. Holawe, and G. Bloschl, 2019: Disentangling Drivers of Meteorological Droughts in the European Greater Alpine Region During the Last Two Centuries. Journal of Geophysical Research-Atmospheres, 124, 12404-12425, doi:10.1029/2018jd029527.
- Hawkins, E., S. Burt, P. Brohan, M. Lockwood, H. Richardson, M. Roy, and S. Thomas, 2019: Hourly weather observations from the Scottish Highlands (1883-1904) rescued by volunteer citizen scientists. Geoscience Data Journal, 6, 160-173, doi:10.1002/gdj3.79.
- Hawkins, E., S. Burt, P. Brohan, M. Lockwood, H. Richardson, M. Roy, and S. Thomas, 2019: Hourly weather observations from the Scottish Highlands (1883-1904) rescued by volunteer citizen scientists. Geoscience Data Journal, 6, 160-173, doi:10.1002/gdj3.79.
- He, J., and Coauthors, 2019: Development and Evaluation of an Ensemble-Based Data Assimilation System for Regional Reanalysis Over the Tibetan Plateau and Surrounding Regions. Journal of Advances in Modeling Earth Systems, 11, 2503-2522, doi:10.1029/2019ms001665.
- Hegerl, G. C., and Coauthors, 2019: Causes of climate change over the historical record. Environmental Research Letters, 14, doi:10.1088/1748-9326/ab4557.
- Hendry, A., and Coauthors, 2019: Assessing the characteristics and drivers of compound flooding events around the UK coast. Hydrology and Earth System Sciences, 23, 3117-3139, doi:10.5194/hess-23-3117-2019.
- Henneman, L. R. F., C. Choirat, C. Ivey, K. Cummiskey, and C. M. Zigler, 2019: Characterizing population exposure to coal emissions sources in the United States using the HyADS model. Atmospheric Environment, 203, 271-280, doi:10.1016/j.atmosenv.2019.01.043.
- Henneman, L. R. F., L. J. Mickley, and C. M. Zigler, 2019: Air pollution accountability of energy transitions: the relative importance of point source emissions and wind fields in exposure changes. Environmental Research Letters, 14, doi:10.1088/1748-9326/ab4861.
- Hidalgo, P., and D. Gallego, 2019: A historical climatology of the easterly winds in the strait of Gibraltar. Atmosfera, 32, 181-195, doi:10.20937/atm.2019.32.03.02.
- Hinrichs, I., and Coauthors, 2019: The Baltic and North Seas Climatology (BNSC) - A Comprehensive, Observation-Based Data Product of Atmospheric and Hydrographic Parameters. Frontiers in Earth Science, 7, doi:10.3389/feart.2019.00158.
- Hitchcock, P., 2019: On the value of reanalyses prior to 1979 for dynamical studies of stratosphere-troposphere coupling. Atmospheric Chemistry and Physics, 19, 2749-2764, doi:10.5194/acp-19-2749-2019.
- Horton, P., and S. Bronnimann, 2019: Impact of global atmospheric reanalyses on statistical precipitation downscaling. Climate Dynamics, 52, 5189-5211, doi:10.1007/s00382-018-4442-6.
- Howard, I. M., D. W. Stahle, and S. Feng, 2019: Separate tree-ring reconstructions of spring and summer moisture in the northern and southern Great Plains. Climate Dynamics, 52, 5877-5897, doi:10.1007/s00382-018-4485-8.
- Hua, T., E. Zorita, X. M. Wang, N. L. Wang, and C. X. Zhang, 2019: Precipitation variability in the north fringe of East Asian Summer Monsoon during the past millennium and its possible driving factors. Climate Dynamics, 53, 2587-2602, doi:10.1007/s00382-019-04643-1.
- Hua, W. J., L. M. Zhou, S. E. Nicholson, H. S. Chen, and M. H. Qin, 2019: Assessing reanalysis data for understanding rainfall climatology and variability over Central Equatorial Africa. Climate Dynamics, 53, 651-669, doi:10.1007/s00382-018-04604-0.
- Huai, B. J., Y. T. Wang, M. H. Ding, J. L. Zhang, and X. Dong, 2019: An assessment of recent global atmospheric reanalyses for Antarctic near surface air temperature. Atmospheric Research, 226, 181-191, doi:10.1016/j.atmosres.2019.04.029.
- Huang, D. Q., A. Dai, B. Yang, P. W. Yan, J. Zhu, and Y. C. Zhang, 2019: Contributions of Different Combinations of the IPO and AMO to Recent Changes in Winter East Asian Jets. J. Clim., 32, 1607-1626, doi:10.1175/jcli-d-18-0218.1.
- Huang, R. P., S. F. Chen, W. Chen, P. Hu, and B. Yu, 2019: Recent Strengthening of the Regional Hadley Circulation over the Western Pacific during Boreal Spring. Advances in Atmospheric Sciences, 36, 1251-1264, doi:10.1007/s00376-019-9004-2.
- Huang, X., T. J. Zhou, W. X. Zhang, J. Jiang, P. X. Li, and Y. Zhao, 2019: Northern Hemisphere land monsoon precipitation changes in the twentieth century revealed by multiple reanalysis datasets. Climate Dynamics, 53, 7131-7149, doi:10.1007/s00382-019-04982-z.
- Huang, Y., T. Li, and B. Wu, 2019: Why SST trend in North Pacific is peculiarly negative against warming trend elsewhere since 1958. Climate Dynamics, 52, 4447-4461, doi:10.1007/s00382-018-4389-7.
- Huang, Y., B. Wu, T. Li, T. J. Zhou, and B. Liu, 2019: Interdecadal Indian Ocean Basin Mode Driven by Interdecadal Pacific Oscillation: A Season-Dependent Growth Mechanism. J. Clim., 32, 2057-2073, doi:10.1175/jcli-d-18-0452.1.
- Hudson, A. R., R. Alfaro-Sanchez, F. Babst, S. Belmecheri, D. J. P. Moore, and V. Trouet, 2019: Seasonal and synoptic climatic drivers of tree growth in the Bighorn Mountains, WY, USA (1654-1983 CE). Dendrochronologia, 58, doi:10.1016/j.dendro.2019.125633.
- Humphrey, V., and L. Gudmundsson, 2019: GRACE-REC: a reconstruction of climate-driven water storage changes over the last century. Earth System Science Data, 11, 1153-1170, doi:10.5194/essd-11-1153-2019.
- Hwang, S. O., J. Park, and H. M. Kim, 2019: Effect of hydrometeor species on very-short-range simulations of precipitation using ERAS. Atmospheric Research, 218, 245-256, doi:10.1016/j.atmosres.2018.12.008.
- Imfeld, N., and Coauthors, 2019: Summertime precipitation deficits in the southern Peruvian highlands since 1964. International Journal of Climatology, 39, 4497-4513, doi:10.1002/joc.6087.
- Ito, T., M. C. Long, C. Deutsch, S. Minobe, and D. X. Sun, 2019: Mechanisms of Low-Frequency Oxygen Variability in the North Pacific. Global Biogeochemical Cycles, 33, 110-124, doi:10.1029/2018gb005987.
- Izumo, T., M. Lengaigne, J. Vialard, I. Suresh, and Y. Planton, 2019: On the physical interpretation of the lead relation between Warm Water Volume and the El Nino Southern Oscillation. Climate Dynamics, 52, 2923-2942, doi:10.1007/s00382-018-4313-1.
- Jiang, J., and T. J. Zhou, 2019: Global Monsoon Responses to Decadal Sea Surface Temperature Variations during the Twentieth Century: Evidence from AGCM Simulations. J. Clim., 32, 7675-7695, doi:10.1175/jcli-d-18-0890.1.
- Jin, C. H., B. Wang, J. Liu, L. Ning, and M. Yan, 2019: Decadal variability of northern Asian winter monsoon shaped by the 11-year solar cycle. Climate Dynamics, 53, 6559-6568, doi:10.1007/s00382-019-04945-4.
- Joshi, M. K., and K. J. Ha, 2019: Fidelity of CMIP5-simulated teleconnection between Atlantic multidecadal oscillation and Indian summer monsoon rainfall. Climate Dynamics, 52, 4157-4176, doi:10.1007/s00382-018-4376-z.
- Joyce, T. M., Y. O. Kwon, H. Seo, and C. C. Ummenhofer, 2019: Meridional Gulf Stream Shifts Can Influence Wintertime Variability in the North Atlantic Storm Track and Greenland Blocking. Geophysical Research Letters, 46, 1702-1708, doi:10.1029/2018gl081087.
- Kamarainen, M., P. Uotila, A. Y. Karpechko, O. Hyvarinen, I. Lehtonen, and J. Raisanen, 2019: Statistical Learning Methods as a Basis for Skillful Seasonal Temperature Forecasts in Europe. J. Clim., 32, 5363-5379, doi:10.1175/jcli-d-18-0765.1.
- Karmalkar, A. V., D. M. H. Sexton, J. M. Murphy, B. B. Booth, J. W. Rostron, and D. J. McNeall, 2019: Finding plausible and diverse variants of a climate model. Part II: development and validation of methodology. Climate Dynamics, 53, 847-877, doi:10.1007/s00382-019-04617-3.
- Kayano, M. T., R. V. Andreoli, and R. A. F. de Souza, 2019: El Nino-Southern Oscillation related teleconnections over South America under distinct Atlantic Multidecadal Oscillation and Pacific Interdecadal Oscillation backgrounds: La Nina. International Journal of Climatology, 39, 1359-1372, doi:10.1002/joc.5886.
- Kayano, M. T., R. V. Andreoli, and R. A. F. de Souza, 2020: Pacific and Atlantic multidecadal variability relations to the El Nino events and their effects on the South American rainfall. International Journal of Climatology, 40, 2183-2200, doi:10.1002/joc.6326.
- Kelemen, F. D., C. Primo, H. Feldmann, and B. Ahrens, 2019: Added Value of Atmosphere-Ocean Coupling in a Century-Long Regional Climate Simulation. Atmosphere, 10, doi:10.3390/atmos10090537.
- Kelley, J. D., D. M. Schultz, R. S. Schumacher, and D. R. Durran, 2019: Can Mountain Waves Contribute to Damaging Winds Far Away from the Lee Slope? Weather Forecast, 34, 2045-2065, doi:10.1175/waf-d-18-0207.1.
- Kennedy, A., A. Trellinger, T. Grafenauer, and G. Gust, 2019: A Climatology of Atmospheric Patterns Associated with Red River Valley Blizzards. Climate, 7, doi:10.3390/cli7050066.
- Kennedy, J. J., N. A. Rayner, C. P. Atkinson, and R. E. Killick, 2019: An Ensemble Data Set of Sea Surface Temperature Change From 1850: The Met Office Hadley Centre HadSST.4.0.0.0 Data Set. Journal of Geophysical Research-Atmospheres, 124, 7719-7763, doi:10.1029/2018jd029867.
- Kikuchi, K., 2020: Extension of the bimodal intraseasonal oscillation index using JRA-55 reanalysis. Climate Dynamics, 54, 919-933, doi:10.1007/s00382-019-05037-z.
- Kim, D. I., and D. W. Han, 2019: Comparative study on long term climate data sources over South Korea. Journal of Water and Climate Change, 10, 504-523, doi:10.2166/wcc.2018.032.
- Kim, D. I., and D. W. Han, 2019: Evaluation of ERA-20cm reanalysis dataset over South Korea. Journal of Hydro-Environment Research, 23, 10-24, doi:10.1016/j.jher.2019.01.004.
- Kim, D. I., H. H. Kwon, and D. W. Han, 2019: Bias correction of daily precipitation over South Korea from the long-term reanalysis using a composite Gamma-Pareto distribution approach. Hydrology Research, 50, 1138-1161, doi:10.2166/nh.2019.127.
- King, A. D., A. H. Butler, M. Jucker, N. O. Earl, and I. Rudeva, 2019: Observed Relationships Between Sudden Stratospheric Warmings and European Climate Extremes. Journal of Geophysical Research-Atmospheres, 124, 13943-13961, doi:10.1029/2019jd030480.
- King, A. T., and A. D. Kennedy, 2019: North American Supercell Environments in Atmospheric Reanalyses and RUC-2. Journal of Applied Meteorology and Climatology, 58, 71-92, doi:10.1175/jamc-d-18-0015.1.
- Klotzbach, P., S. Abhik, H. H. Hendon, M. Bell, C. Lucas, A. G. Marshall, and E. C. J. Oliver, 2019: On the emerging relationship between the stratospheric Quasi-Biennial oscillation and the Madden-Julian oscillation. Scientific Reports, 9, doi:10.1038/s41598-019-40034-6.
- Knighton, J., G. Pleiss, E. Carter, S. Lyon, M. T. Walter, and S. Steinschneider, 2019: Potential Predictability of Regional Precipitation and Discharge Extremes Using Synoptic-Scale Climate Information via Machine Learning: An Evaluation for the Eastern Continental United States. Journal of Hydrometeorology, 20, 883-900, doi:10.1175/jhm-d-18-0196.1.
- Kolstad, E. W., and J. A. Screen, 2019: Nonstationary Relationship Between Autumn Arctic Sea Ice and the Winter North Atlantic Oscillation. Geophysical Research Letters, 46, 7583-7591, doi:10.1029/2019gl083059.
- Krakauer, N. Y., T. Lakhankar, and G. H. Dars, 2019: Precipitation Trends over the Indus Basin. Climate, 7, doi:10.3390/cli7100116.
- Krueger, O., F. Feser, and R. Weisse, 2019: Northeast Atlantic Storm Activity and Its Uncertainty from the Late Nineteenth to the Twenty-First Century. J. Clim., 32, 1919-1931, doi:10.1175/jcli-d-18-0505.1.
- L?bbecke, J. F., D. Rudloff, and L. Stramma, 2019: Stand-Alone Eastern Pacific Coastal Warming Events. Geophysical Research Letters, 46, 12360-12367, doi:10.1029/2019gl084479.
- Labbe, T., C. Pfister, S. Bronnimann, D. Rousseau, J. Franke, and B. Bois, 2019: The longest homogeneous series of grape harvest dates, Beaune 1354-2018. and its significance for the understanding of past and present climate. Climate of the Past, 15, 1485-1501, doi:10.5194/cp-15-1485-2019.
- Lague, M. M., G. B. Bonan, and A. L. S. Swann, 2019: Separating the Impact of Individual Land Surface Properties on the Terrestrial Surface Energy Budget in both the Coupled and Uncoupled Land-Atmosphere System. J. Clim., 32, 5725-5744, doi:10.1175/jcli-d-18-0812.1.
- Lawal, K. A., B. J. Abiodun, D. A. Stone, E. Olaniyan, and M. F. Wehner, 2019: Capability of CAM5.1 in simulating maximum air temperature patterns over West Africa during boreal spring. Modeling Earth Systems and Environment, 5, 1815-1838, doi:10.1007/s40808-019-00639-2.
- Lawrence, D. M., and Coauthors, 2019: The Community Land Model Version 5: Description of New Features, Benchmarking, and Impact of Forcing Uncertainty. Journal of Advances in Modeling Earth Systems, 11, 4245-4287, doi:10.1029/2018ms001583.
- Lee, J., K. R. Sperber, P. J. Gleckler, C. J. W. Bonfils, and K. E. Taylor, 2019: Quantifying the agreement between observed and simulated extratropical modes of interannual variability. Climate Dynamics, 52, 4057-4089, doi:10.1007/s00382-018-4355-4.
- Levizzani, V., and E. Cattani, 2019: Satellite Remote Sensing of Precipitation and the Terrestrial Water Cycle in a Changing Climate. Remote Sensing, 11, doi:10.3390/rs11192301.
- Li, J., R. Q. Ding, Z. W. Wu, Q. J. Zhong, B. S. Li, and J. P. Li, 2019: Inter-decadal change in potential predictability of the East Asian summer monsoon. Theoretical and Applied Climatology, 136, 403-415, doi:10.1007/s00704-018-2482-9.
- Li, Q., T. Yang, F. Y. Zhang, Z. M. Qi, and L. H. Li, 2019: Snow depth reconstruction over last century: Trend and distribution in the Tianshan Mountains, China. Global and Planetary Change, 173, 73-82, doi:10.1016/j.gloplacha.2018.12.008.
- Li, S. H., and Coauthors, 2019: Reducing climate model biases by exploring parameter space with large ensembles of climate model simulations and statistical emulation. Geoscientific Model Development, 12, 3017-3043, doi:10.5194/gmd-12-3017-2019.
- Li, Y., and Coauthors, 2019: Long-Term Trend of the Tropical Pacific Trade Winds Under Global Warming and Its Causes. Journal of Geophysical Research-Oceans, 124, 2626-2640, doi:10.1029/2018jc014603.
- Lima, L. N., L. P. Pezzi, S. G. Penny, and C. A. S. Tanajura, 2019: An Investigation of Ocean Model Uncertainties Through Ensemble Forecast Experiments in the Southwest Atlantic Ocean. Journal of Geophysical Research-Oceans, 124, 432-452, doi:10.1029/2018jc013919.
- Lin, J. L., and T. T. Qian, 2019: Switch Between El Nino and La Nina is Caused by Subsurface Ocean Waves Likely Driven by Lunar Tidal Forcing. Scientific Reports, 9, doi:10.1038/s41598-019-49678-w.
- Liu, J. P., H. L. Ren, W. J. Li, and J. Q. Zuo, 2019: Diagnosing the leading mode of interdecadal covariability between the Indian Ocean sea surface temperature and summer precipitation in southern China. Theoretical and Applied Climatology, 135, 1295-1306, doi:10.1007/s00704-018-2430-8.
- Liu, Y., C. X. Fang, Q. Li, H. M. Song, W. Y. Ta, G. J. Zhao, and C. F. Sun, 2019: Tree-ring delta O-18 based PDSI reconstruction in the Mt. Tianmu region since 1618 AD and its connection to the East Asian summer monsoon. Ecological Indicators, 104, 636-647, doi:10.1016/j.ecolind.2019.05.043.
- Liu, Y. Z., T. B. Shao, S. Hua, Q. Z. Zhu, and R. Luo: Association of anthropogenic aerosols with subtropical drought in East Asia. International Journal of Climatology, doi:10.1002/joc.6410.
- Loughran, T. F., A. J. Pitman, and S. E. Perkins-Kirkpatrick, 2019: The El Nino-Southern Oscillation's effect on summer heatwave development mechanisms in Australia. Climate Dynamics, 52, 6279-6300, doi:10.1007/s00382-018-4511-x.
- Lucio-Eceiza, E. E., J. F. Gonzalez-Rouco, E. Garcia-Bustamante, J. Navarro, and H. Beltrami, 2019: Multidecadal to centennial surface wintertime wind variability over Northeastern North America via statistical downscaling. Climate Dynamics, 53, 41-66, doi:10.1007/s00382-018-4569-5.
- Luo, M., J. M. Feng, Z. F. Xu, Y. L. Wang, and L. Dan, 2019: Evaluating the performance of five twentieth-century reanalysis datasets in reproducing the severe drought in northern China during the 1920s-1930s. Theoretical and Applied Climatology, 137, 187-199, doi:10.1007/s00704-018-2591-5.
- Magee, A. D., and D. C. Verdon-Kidd, 2019: Historical Variability of Southwest Pacific Tropical Cyclone Counts Since 1855. Geophysical Research Letters, 46, 6936-6945, doi:10.1029/2019gl082900.
- Mao, G. Q., and J. G. Liu, 2019: WAYS v1: a hydrological model for root zone water storage simulation on a global scale. Geoscientific Model Development, 12, 5267-5289, doi:10.5194/gmd-12-5267-2019.
- McCabe, G. J., and D. M. Wolock, 2019: Hydroclimatology of the Mississippi River Basin. Journal of the American Water Resources Association, 55, 1053-1064, doi:10.1111/1752-1688.12749.
- Medvedev, I., and E. Kulikov, 2019: Low-Frequency Baltic Sea Level Spectrum. Frontiers in Earth Science, 7, doi:10.3389/feart.2019.00284.
- Mellado-Cano, J., D. Barriopedro, R. Garcia-Herrera, and R. M. Trigo, 2020: New observational insights into the atmospheric circulation over the Euro-Atlantic sector since 1685. Climate Dynamics, 54, 823-841, doi:10.1007/s00382-019-05029-z.
- Menard, C. B., and Coauthors, 2019: Meteorological and evaluation datasets for snow modelling at 10 reference sites: description of in situ and bias-corrected reanalysis data. Earth System Science Data, 11, 865-880, doi:10.5194/essd-11-865-2019.
- Menezes, V. V., and M. L. Vianna, 2019: Quasi-biennial Rossby and Kelvin waves in the South Indian Ocean: Tropical and subtropical modes and the Indian Ocean Dipole. Deep-Sea Research Part Ii-Topical Studies in Oceanography, 166, 43-63, doi:10.1016/j.dsr2.2019.05.002.
- Meng, X. Y., X. S. Zhang, M. X. Yang, H. Wang, J. Chen, Z. H. Pan, and Y. P. Wu, 2019: Application and Evaluation of the China Meteorological Assimilation Driving Datasets for the SWAT Model (CMADS) in Poorly Gauged Regions in Western China. Water, 11, doi:10.3390/w11102171.
- Messori, G., P. Davini, M. C. Alvarez-Castro, F. S. R. Pausata, P. Yiou, and R. Caballero, 2019: On the low-frequency variability of wintertime Euro-Atlantic planetary wave-breaking. Climate Dynamics, 52, 2431-2450, doi:10.1007/s00382-018-4373-2.
- Miller, D. K., C. F. Miniat, R. M. Wooten, and A. P. Barros, 2019: An Expanded Investigation of Atmospheric Rivers in the Southern Appalachian Mountains and Their Connection to Landslides. Atmosphere, 10, doi:10.3390/atmos10020071.
- Mittaz, J., C. J. Merchant, and E. R. Woolliams, 2019: Applying principles of metrology to historical Earth observations from satellites. Metrologia, 56, doi:10.1088/1681-7575/ab1705.
- Muller, C., and Coauthors, 2019: The Global Gridded Crop Model Intercomparison phase 1 simulation dataset. Scientific Data, 6, doi:10.1038/s41597-019-0023-8.
- Nagavciuc, V., M. Ionita, A. Persoiu, I. Popa, N. J. Loader, and D. McCarroll, 2019: Stable oxygen isotopes in Romanian oak tree rings record summer droughts and associated large-scale circulation patterns over Europe. Climate Dynamics, 52, 6557-6568, doi:10.1007/s00382-018-4530-7.
- Nagavciuc, V., Z. Kern, M. Ionita, C. Hartl, O. Konter, J. Esper, and I. Popa, 2020: Climate signals in carbon and oxygen isotope ratios of Pinus cembra tree-ring cellulose from the Calimani Mountains, Romania. International Journal of Climatology, 40, 2539-2556, doi:10.1002/joc.6349.
- Nikiel, C. A., and E. A. B. Eltahir, 2019: Summer Climate Change in the Midwest and Great Plains due to Agricultural Development during the Twentieth Century. J. Clim., 32, 5583-5599, doi:10.1175/jcli-d-19-0096.1.
- Nogueira, M., 2019: The multi-scale structure of atmospheric energetic constraints on globally averaged precipitation. Earth System Dynamics, 10, 219-232, doi:10.5194/esd-10-219-2019.
- Nogueira, M., 2019: The sensitivity of the atmospheric branch of the global water cycle to temperature fluctuations at synoptic to decadal time-scales in different satellite- and model-based products. Climate Dynamics, 52, 617-636, doi:10.1007/s00382-018-4153-z.
- O'Brien, J. P., T. A. O'Brien, C. M. Patricola, and S. Y. S. Wang, 2019: Metrics for understanding large-scale controls of multivariate temperature and precipitation variability. Climate Dynamics, 53, 3805-3823, doi:10.1007/s00382-019-04749-6.
- O'Reilly, C. H., T. Woollings, L. Zanna, and A. Weisheimer, 2019: An Interdecadal Shift of the Extratropical Teleconnection From the Tropical Pacific During Boreal Summer. Geophysical Research Letters, 46, 13379-13388, doi:10.1029/2019gl084079.
- Okazaki, A., and K. Yoshimura, 2019: Global Evaluation of Proxy System Models for Stable Water Isotopes With Realistic Atmospheric Forcing. Journal of Geophysical Research-Atmospheres, 124, 8972-8993, doi:10.1029/2018jd029463.
- Paeth, H., J. M. Li, F. Pollinger, W. A. Muller, H. Pohlmann, H. Feldmann, and H. J. Panitz, 2019: An effective drift correction for dynamical downscaling of decadal global climate predictions. Climate Dynamics, 52, 1343-1357, doi:10.1007/s00382-018-4195-2.
- Park, J. H., and T. Li, 2019: Interdecadal modulation of El Nino-tropical North Atlantic teleconnection by the Atlantic multi-decadal oscillation. Climate Dynamics, 52, 5345-5360, doi:10.1007/s00382-018-4452-4.
- Parker, T., T. Woollings, A. Weisheimer, C. O'Reilly, L. Baker, and L. Shaffrey, 2019: Seasonal Predictability of the Winter North Atlantic Oscillation From a Jet Stream Perspective. Geophysical Research Letters, 46, 10159-10167, doi:10.1029/2019gl084402.
- Parsons, L. A., and S. Coats, 2019: Ocean-Atmosphere Trajectories of Extended Drought in Southwestern North America. Journal of Geophysical Research-Atmospheres, 124, 8953-8971, doi:10.1029/2019jd030424.
- Parsons, L. A., and G. J. Hakim, 2019: Local Regions Associated With Interdecadal Global Temperature Variability in the Last Millennium Reanalysis and CMIP5 Models. Journal of Geophysical Research-Atmospheres, 124, 9905-9917, doi:10.1029/2019jd030426.
- Penny, S. G., and Coauthors, 2019: Observational Needs for Improving Ocean and Coupled Reanalysis, S2S Prediction, and Decadal Prediction. Frontiers in Marine Science, 6, doi:10.3389/fmars.2019.00391.
- Pepler, A., A. Dowdy, and P. Hope, 2019: A global climatology of surface anticyclones, their variability, associated drivers and long-term trends. Climate Dynamics, 52, 5397-5412, doi:10.1007/s00382-018-4451-5.
- Pepler, A., P. Hope, and A. Dowdy, 2019: Long-term changes in southern Australian anticyclones and their impacts. Climate Dynamics, 53, 4701-4714, doi:10.1007/s00382-019-04819-9.
- Pfister, L., and Coauthors, 2019: Early instrumental meteorological measurements in Switzerland. Climate of the Past, 15, 1345-1361, doi:10.5194/cp-15-1345-2019.
- Picas, J., S. Grab, and R. Allan, 2019: A 19th century daily surface pressure series for the Southwestern Cape region of South Africa: 1834-1899. International Journal of Climatology, 39, 1404-1414, doi:10.1002/joc.5890.
- Piecuch, C. G., F. M. Calafat, S. Dangendorf, and G. Jord, 2019: The Ability of Barotropic Models to Simulate Historical Mean Sea Level Changes from Coastal Tide Gauge Data. Surv Geophys, 40, 1399-1435, doi:10.1007/s10712-019-09537-9.
- Piecuch, C. G., S. Dangendorf, G. G. Gawarkiewicz, C. M. Little, R. M. Ponte, and J. Y. Yang, 2019: How is New England Coastal Sea Level Related to the Atlantic Meridional Overturning Circulation at 26 degrees N? Geophysical Research Letters, 46, 5351-5360, doi:10.1029/2019gl083073.
- Porter, S. E., E. Mosley-Thompson, and L. G. Thompson, 2019: Ice Core delta O-18 Record Linked to Western Arctic Sea Ice Variability. Journal of Geophysical Research-Atmospheres, 124, 10784-10801, doi:10.1029/2019jd031023.
- Pourasghar, F., E. C. J. Oliver, and N. J. Holbrook, 2019: Modulation of wet-season rainfall over Iran by the Madden-Julian Oscillation, Indian Ocean Dipole and El Nino-Southern Oscillation. International Journal of Climatology, 39, 4029-4040, doi:10.1002/joc.6057.
- Previdi, M., and A. M. Fiore, 2019: The Importance of Sampling Variability in Assessments of ENSO-PM2.5 Relationships: A Case Study for the South Central United States. Geophysical Research Letters, 46, 6878-6884, doi:10.1029/2019gl082250.
- Primo, C., F. D. Kelemen, H. Feldmann, N. Akhtar, and B. Ahrens, 2019: A regional atmosphere-ocean climate system model (CCLMv5.0clm7-NEMOv3.3-NEMOv3.6) over Europe including three marginal seas: on its stability and performance. Geoscientific Model Development, 12, 5077-5095, doi:10.5194/gmd-12-5077-2019.
- Qin, M. H., A. G. Dai, D. L. Li, and W. J. Hua, 2020: Understanding the inter-decadal variability of autumn precipitation over North Central China using model simulations. International Journal of Climatology, 40, 874-886, doi:10.1002/joc.6245.
- Rao, J., Y. Y. Yu, D. Guo, C. H. Shi, D. Chen, and D. Z. Hu, 2019: Evaluating the Brewer-Dobson circulation and its responses to ENSO, QBO, and the solar cycle in different reanalyses. Earth and Planetary Physics, 3, 166-181, doi:10.26464/epp2019012.
- Reason, C. J. C., 2019: Low-frequency variability in the Botswana High and southern African regional climate. Theoretical and Applied Climatology, 137, 1321-1334, doi:10.1007/s00704-018-2661-8.
- Renard, B., and M. Thyer, 2019: Revealing Hidden Climate Indices from the Occurrence of Hydrologic Extremes. Water Resources Research, 55, 7662-7681, doi:10.1029/2019wr024951.
- Rodriguez-Diaz, L., I. Alvarez, M. Gomez-Gesteira, and F. Santos, 2019: Changes in the probability of larvae crossing the North Atlantic during the 20th century. Marine and Freshwater Research, 70, 1150-1168, doi:10.1071/mf18046.
- Rohrer, M., S. Bronnimann, O. Martius, C. C. Raible, and M. Wild, 2019: Decadal variations of blocking and storm tracks in centennial reanalyses. Tellus Series a-Dynamic Meteorology and Oceanography, 71, doi:10.1080/16000870.2019.1586236.
- Rueda, A., L. Cagigal, J. A. A. Antolinez, J. C. Albuquerque, S. Castanedo, G. Coco, and F. J. Mendez, 2019: Marine climate variability based on weather patterns for a complicated island setting: The New Zealand case. International Journal of Climatology, 39, 1777-1786, doi:10.1002/joc.5912.
- Rustemeier, E., M. Ziese, A. Meyer-Christoffer, U. Schneider, P. Finger, and A. Becker, 2019: Uncertainty Assessment of the ERA-20C Reanalysis Based on the Monthly In Situ Precipitation Analysis of the Global Precipitation Climatology Centre. Journal of Hydrometeorology, 20, 231-250, doi:10.1175/jhm-d-17-0239.1.
- Sachindra, D. A., K. Ahmed, M. M. Rashid, V. Sehgal, S. Shahid, and B. J. C. Perera, 2019: Pros and cons of using wavelets in conjunction with genetic programming and generalised linear models in statistical downscaling of precipitation. Theoretical and Applied Climatology, 138, 617-638, doi:10.1007/s00704-019-02848-2.
- Sanchez-Garcia, C., L. Schulte, F. Carvalho, and J. C. Pena, 2019: A 500-year flood history of the arid environments of southeastern Spain. The case of the Almanzora River. Global and Planetary Change, 181, doi:10.1016/j.gloplacha.2019.102987.
- Sanikommu, S., D. S. Banerjee, B. Baduru, B. Paul, A. Paul, K. Chakraborty, and I. Hoteit, 2019: Impact of dynamical representational errors on an Indian Ocean ensemble data assimilation system. Quarterly Journal of the Royal Meteorological Society, 145, 3680-3691, doi:10.1002/qj.3649.
- Scher, S., and G. Messori, 2019: Weather and climate forecasting with neural networks: using general circulation models (GCMs) with different complexity as a study ground. Geoscientific Model Development, 12, 2797-2809, doi:10.5194/gmd-12-2797-2019.
- Scherrer, S. C., and M. Begert, 2019: Effects of large-scale atmospheric flow and sunshine duration on the evolution of minimum and maximum temperature in Switzerland. Theoretical and Applied Climatology, 138, 227-235, doi:10.1007/s00704-019-02823-x.
- Schlef, K. E., H. Moradkhani, and U. Lall, 2019: Atmospheric Circulation Patterns Associated with Extreme United States Floods Identified via Machine Learning. Scientific Reports, 9, doi:10.1038/s41598-019-43496-w.
- Schneider, L., and Coauthors, 2019: The impact of proxy selection strategies on a millennium-long ensemble of hydroclimatic records in Monsoon Asia. Quaternary Science Reviews, 223, doi:10.1016/j.quascirev.2019.105917.
- Schulte, J. A., and S. Lee, 2019: Long Island Sound temperature variability and its associations with the ridge-trough dipole and tropical modes of sea surface temperature variability. Ocean Science, 15, 161-178, doi:10.5194/os-15-161-2019.
- Schulte, L., and Coauthors, 2019: Integration of multi-archive datasets for the development of a four-dimensional paleoflood model of alpine catchments. Global and Planetary Change, 180, 66-88, doi:10.1016/j.gloplacha.2019.05.011.
- Schweiger, A. J., K. R. Wood, and J. L. Zhang, 2019: Arctic Sea Ice Volume Variability over 1901-2010: A Model-Based Reconstruction. J. Clim., 32, 4731-4752, doi:10.1175/jcli-d-19-0008.1.
- Seager, R., M. Cane, N. Henderson, D. E. Lee, R. Abernathey, and H. H. Zhang, 2019: Strengthening tropical Pacific zonal sea surface temperature gradient consistent with rising greenhouse gases. Nature Climate Change, 9, 517-+, doi:10.1038/s41558-019-0505-x.
- Serykh, I. V., and D. M. Sonechkin, 2019: Nonchaotic and globally synchronized short-term climatic variations and their origin. Theoretical and Applied Climatology, 137, 2639-2656, doi:10.1007/s00704-018-02761-0.
- Serykh, I. V., D. M. Sonechkin, V. I. Byshev, V. G. Neiman, and Y. A. Romanov, 2019: Global Atmospheric Oscillation: An Integrity of ENSO and Extratropical Teleconnections. Pure and Applied Geophysics, 176, 3737-3755, doi:10.1007/s00024-019-02182-8. Serykh, I. V., D. M. Sonechkin, N. V. Vakulenko, and Iop, 2019: Interannual globally synchronized variations in the climate system and their predictability. Turbulence, Atmosphere and Climate Dynamics.
- Shi, C. M., and Coauthors, 2019: Summer Temperature over the Tibetan Plateau Modulated by Atlantic Multidecadal Variability. J. Clim., 32, 4055-4067, doi:10.1175/jcli-d-17-0858.1.
- Sidibe, M., and Coauthors, 2019: Interannual to Multi-decadal streamflow variability in West and Central Africa: Interactions with catchment properties and large-scale climate variability. Global and Planetary Change, 177, 141-156, doi:10.1016/j.gloplacha.2019.04.003.
- Sieber, R., and V. Slonosky, 2019: Developing a Flexible Platform for Crowdsourcing Historical Weather Records. Historical Methods, 52, 164-177, doi:10.1080/01615440.2018.1558138.
- Sim, T. G., G. T. Swindles, P. J. Morris, M. Galka, D. Mullan, and J. M. Galloway, 2019: Pathways for Ecological Change in Canadian High Arctic Wetlands Under Rapid Twentieth Century Warming. Geophysical Research Letters, 46, 4726-4737, doi:10.1029/2019gl082611.
- Sinclair, H. D., F. M. Stuart, S. M. Mudd, L. McCann, and Z. Tao, 2019: Detrital cosmogenic Ne-21 records decoupling of source-to-sink signals by sediment storage and recycling in Miocene to present rivers of the Great Plains, Nebraska, USA. Geology, 47, 3-6, doi:10.1130/g45391.1.
- Slivinski, L. C., and Coauthors, 2019: Towards a more reliable historical reanalysis: Improvements for version 3 of the Twentieth Century Reanalysis system. Quarterly Journal of the Royal Meteorological Society, 145, 2876-2908, doi:10.1002/qj.3598.
- Smith, K. A., and Coauthors, 2019: A multi-objective ensemble approach to hydrological modelling in the UK: an application to historic drought reconstruction. Hydrology and Earth System Sciences, 23, 3247-3268, doi:10.5194/hess-23-3247-2019.
- Smith, S. R., and Coauthors, 2019: Ship-Based Contributions to Global Ocean, Weather, and Climate Observing Systems. Frontiers in Marine Science, 6, doi:10.3389/fmars.2019.00434.
- Song, B., X. F. Zhi, M. T. Pan, M. Y. Hou, C. F. He, and K. Fraedrich, 2019: Turbulent Heat Flux Reconstruction in the North Pacific from 1921 to 2014. Journal of the Meteorological Society of Japan, 97, 893-911, doi:10.2151/jmsj.2019-050.
- Soulard, N., H. Lin, and B. Yu, 2019: The changing relationship between ENSO and its extratropical response patterns. Scientific Reports, 9, doi:10.1038/s41598-019-42922-3.
- Srinivas, G., J. S. Chowdary, C. Gnanaseelan, A. Parekh, R. Dandi, K. Prasad, and C. V. Naidu, 2019: Impact of differences in the decaying phase of El Nino on South and East Asia summer monsoon in CMIP5 models. International Journal of Climatology, 39, 5503-5521, doi:10.1002/joc.6168.
- Stone, D. A., and Coauthors, 2019: Experiment design of the International CLIVAR C20C+ Detection and Attribution project. Weather and Climate Extremes, 24, doi:10.1016/j.wace.2019.100206.
- Storto, A., and Coauthors, 2019: Ocean Reanalyses: Recent Advances and Unsolved Challenges. Frontiers in Marine Science, 6, doi:10.3389/fmars.2019.00418.
- Strock, K. E., J. E. Saros, S. McGowan, M. B. Edlund, and D. R. Engstrom, 2019: Response of boreal lakes to changing wind strength: Coherent physical changes across two large lakes but varying effects on primary producers over the 20(th) century. Limnology and Oceanography, 64, 2237-2251, doi:10.1002/lno.11181.
- Stryhal, J., and R. Huth, 2019: Classifications of winter atmospheric circulation patterns: validation of CMIP5 GCMs over Europe and the North Atlantic. Climate Dynamics, 52, 3575-3598, doi:10.1007/s00382-018-4344-7.
- Stryhal, J., and R. Huth, 2019: Trends in winter circulation over the British Isles and central Europe in twenty-first century projections by 25 CMIP5 GCMs. Climate Dynamics, 52, 1063-1075, doi:10.1007/s00382-018-4178-3.
- Sun, C., and Coauthors, 2019: Spring Aleutian Low Weakening and Surface Cooling Trend in Northwest North America During Recent Decades. Journal of Geophysical Research-Atmospheres, 124, 12078-12092, doi:10.1029/2019jd031405.
- Sun, C., and Coauthors, 2019: Recent Acceleration of Arabian Sea Warming Induced by the Atlantic-Western Pacific Trans-basin Multidecadal Variability. Geophysical Research Letters, 46, 1662-1671, doi:10.1029/2018gl081175.
- Sung, M. K., H. Y. Jang, B. M. Kim, S. W. Yeh, Y. S. Choi, and C. Yoo, 2019: Tropical influence on the North Pacific Oscillation drives winter extremes in North America. Nature Climate Change, 9, 413-+, doi:10.1038/s41558-019-0461-5.
- Swenson, S. C., M. Clark, Y. Fan, D. M. Lawrence, and J. Perket, 2019: Representing Intrahillslope Lateral Subsurface Flow in the Community Land Model. Journal of Advances in Modeling Earth Systems, 11, 4044-4065, doi:10.1029/2019ms001833.
- Swindles, G. T., and Coauthors, 2019: Widespread drying of European peatlands in recent centuries. Nature Geoscience, 12, 922-+, doi:10.1038/s41561-019-0462-z. Tabari, H., and P. Willems, 2019: Anomalous Extreme Rainfall Variability Over Europe - Interaction Between Climate Variability and Climate Change. New Trends in Urban Drainage Modelling, Udm 2018, G. Mannina, Ed., 375-379.
- Takahashi, K., and A. G. Martinez, 2019: The very strong coastal El Nino in 1925 in the far-eastern Pacific. Climate Dynamics, 52, 7389-7415, doi:10.1007/s00382-017-3702-1.
- Tan, X. Z., S. Chen, T. Y. Gan, B. J. Liu, and X. H. Chen, 2019: Dynamic and thermodynamic changes conducive to the increased occurrence of extreme spring fire weather over western Canada under possible anthropogenic climate change. Agricultural and Forest Meteorology, 265, 269-279, doi:10.1016/j.agrformet.2018.11.026.
- Tardif, R., and Coauthors, 2019: Last Millennium Reanalysis with an expanded proxy database and seasonal proxy modeling. Climate of the Past, 15, 1251-1273, doi:10.5194/cp-15-1251-2019.
- Tian, Z. P., and D. B. Jiang, 2020: Weakening and eastward shift of the tropical Pacific Walker circulation during the Last Glacial Maximum. Boreas, 49, 200-210, doi:10.1111/bor.12417.
- Tokinaga, H., I. Richter, and Y. Kosaka, 2019: ENSO Influence on the Atlantic Nino, Revisited: Multi-Year versus Single-Year ENSO Events. J. Clim., 32, 4585-4600, doi:10.1175/jcli-d-18-0683.1.
- Toreti, A., and Coauthors, 2019: Using reanalysis in crop monitoring and forecasting systems. Agricultural Systems, 168, 144-153, doi:10.1016/j.agsy.2018.07.001.
- Toride, K., Y. Iseri, A. Duren, J. F. England, and M. L. Kavvas, 2019: Evaluation of physical parameterizations for atmospheric river induced precipitation and application to long-term reconstruction based on three reanalysis datasets in Western Oregon. Science of the Total Environment, 658, 570-581, doi:10.1016/j.scitotenv.2018.12.214.
- Varino, F., P. Arbogast, B. Joly, G. Riviere, M. L. Fandeur, H. Bovy, and J. B. Granier, 2019: Northern Hemisphere extratropical winter cyclones variability over the 20th century derived from ERA-20C reanalysis. Climate Dynamics, 52, 1027-1048, doi:10.1007/s00382-018-4176-5.
- Veerman, M. A., and C. C. van Heerwaarden, 2019: Trends in and closure of the atmospheric angular momentum budget in the 20th century in ERA-20C. Quarterly Journal of the Royal Meteorological Society, 145, 2990-3003, doi:10.1002/qj.3600.
- Veiga, S. F., and Coauthors, 2019: The Brazilian Earth System Model ocean-atmosphere (BESM-OA) version 2.5: evaluation of its CMIP5 historical simulation. Geoscientific Model Development, 12, 1613-1642, doi:10.5194/gmd-12-1613-2019.
- Vera, C. S., L. B. Diaz, and R. I. Saurral, 2019: Influence of Anthropogenically-Forced Global Warming and Natural Climate Variability in the Rainfall Changes Observed Over the South American Altiplano. Frontiers in Environmental Science, 7, doi:10.3389/fenvs.2019.00087.
- Wahl, E. R., E. Zorita, V. Trouet, and A. H. Taylor, 2019: Jet stream dynamics, hydroclimate, and fire in California from 1600 CE to present. Proceedings of the National Academy of Sciences of the United States of America, 116, 5393-5398, doi:10.1073/pnas.1815292116.
- Wanamaker, A. D., and Coauthors, 2019: Pacific climate influences on ocean conditions and extreme shell growth events in the Northwestern Atlantic (Gulf of Maine). Climate Dynamics, 52, 6339-6356, doi:10.1007/s00382-018-4513-8.
- Wang, L. H., and Coauthors, 2019: Contributions of climate change and groundwater extraction to soil moisture trends. Earth System Dynamics, 10, 599-615, doi:10.5194/esd-10-599-2019.
- Wang, X., C. Y. Guan, R. X. Huang, W. Tan, and L. Wang, 2019: The roles of tropical and subtropical wind stress anomalies in the El Nino Modoki onset. Climate Dynamics, 52, 6585-6597, doi:10.1007/s00382-018-4534-3.
- Wang, Y. H., C. He, and T. Li, 2019: Decadal change in the relationship between East Asian spring circulation and ENSO: Is it modulated by Pacific Decadal Oscillation? International Journal of Climatology, 39, 172-187, doi:10.1002/joc.5793.
- Wang, Y. T., S. G. Hou, M. H. Ding, and W. J. Sun, 2020: On the performance of twentieth century reanalysis products for Antarctic snow accumulation. Climate Dynamics, 54, 435-455, doi:10.1007/s00382-019-05008-4.
- Wang, Z. L., L. Lin, M. L. Yang, and Z. Guo, 2019: The Role of Anthropogenic Aerosol Forcing in Interdecadal Variations of Summertime Upper-Tropospheric Temperature Over East Asia. Earths Future, 7, 136-150, doi:10.1029/2018ef001052.
- Wen, C. H., A. Kumar, and Y. Xue, 2019: Uncertainties in reanalysis surface wind stress and their relationship with observing systems. Climate Dynamics, 52, 3061-3078, doi:10.1007/s00382-018-4310-4.
- Werner, A. T., M. A. Schnorbus, R. R. Shrestha, A. J. Cannon, F. W. Zwiers, G. Dayon, and F. Anslow, 2019: A long-term, temporally consistent, gridded daily meteorological dataset for northwestern North America. Scientific Data, 6, doi:10.1038/sdata.2018.299.
- Wills, R. C. J., K. C. Armour, D. S. Battisti, and D. L. Hartmann, 2019: Ocean-Atmosphere Dynamical Coupling Fundamental to the Atlantic Multidecadal Oscillation. J. Clim., 32, 251-272, doi:10.1175/jcli-d-18-0269.1.
- Wohland, J., N. E. Omrani, N. Keenlyside, and D. Witthaut, 2019: Significant multidecadal variability in German wind energy generation. Wind Energy Science, 4, 515-526, doi:10.5194/wes-4-515-2019.
- Wohland, J., N. E. Omrani, D. Witthaut, and N. S. Keenlyside, 2019: Inconsistent Wind Speed Trends in Current Twentieth Century Reanalyses. Journal of Geophysical Research-Atmospheres, 124, 1931-1940, doi:10.1029/2018jd030083.
- Wongchuig, S. C., R. C. D. de Paiva, V. Siqueira, and W. Collischonn, 2019: Hydrological reanalysis across the 20th century: A case study of the Amazon Basin. Journal of Hydrology, 570, 755-773, doi:10.1016/j.jhydrol.2019.01.025.
- Woodworth, P. L., and Coauthors, 2019: Forcing Factors Affecting Sea Level Changes at the Coast. Surv Geophys, 40, 1351-1397, doi:10.1007/s10712-019-09531-1.
- Wu, B., T. J. Zhou, C. Li, W. A. Muller, and J. S. Lin, 2019: Improved decadal prediction of Northern-Hemisphere summer land temperature. Climate Dynamics, 53, 1357-1369, doi:10.1007/s00382-019-04658-8.
- Wu, R. G., T. You, and K. M. Hu, 2019: What Formed the North-South Contrasting Pattern of Summer Rainfall Changes over Eastern China? Current Climate Change Reports, 5, 47-62, doi:10.1007/s40641-019-00124-z.
- Wu, X., Y. M. Okumura, and P. N. DiNezio, 2019: What Controls the Duration of El Nino and La Nina Events? J. Clim., 32, 5941-5965, doi:10.1175/jcli-d-18-0681.1.
- Xia, Y. L., and Coauthors, 2019: Regional and Global Land Data Assimilation Systems: Innovations, Challenges, and Prospects. Journal of Meteorological Research, 33, 159-189, doi:10.1007/s13351-019-8172-4.
- Xiao, F. A., D. X. Wang, L. L. Zeng, Q. Y. Liu, and W. Zhou, 2019: Contrasting changes in the sea surface temperature and upper ocean heat content in the South China Sea during recent decades. Climate Dynamics, 53, 1597-1612, doi:10.1007/s00382-019-04697-1.
- Xie, T. J., J. P. Li, C. Sun, R. Q. Ding, K. C. Wang, C. F. Zhao, and J. Feng, 2019: NAO implicated as a predictor of the surface air temperature multidecadal variability over East Asia. Climate Dynamics, 53, 895-905, doi:10.1007/s00382-019-04624-4.
- Xie, W., G. Z. Fan, R. Q. Ding, J. P. Li, B. S. Li, J. H. Qin, and X. J. Zhou, 2019: Interdecadal change in the lagged relationship between the Victoria mode and ENSO. Atmospheric and Oceanic Science Letters, 12, 294-301, doi:10.1080/16742834.2019.1620081.
- Yang, C. X., A. Storto, and S. Masina, 2019: Quantifying the effects of observational constraints and uncertainty in atmospheric forcing on historical ocean reanalyses. Climate Dynamics, 52, 3321-3342, doi:10.1007/s00382-018-4331-z.
- Yang, E. G., and H. M. Kim, 2019: Evaluation of Short-Range Precipitation Reforecasts from East Asia Regional Reanalysis. Journal of Hydrometeorology, 20, 319-337, doi:10.1175/jhm-d-18-0068.1.
- Yang, M. H., R. T. Zuo, L. Q. Wang, F. L. Hu, C. Wang, and W. Ge, 2019: An experiment to improve the capability of the regional climate model RegCM4.5 to simulate the land surface climate in dense vegetation areas. Journal of Earth System Science, 128, doi:10.1007/s12040-019-1211-9.
- Yang, R. W., and J. Wang, 2019: Interannual variability of the seesaw mode of the interface between the Indian and East Asian summer monsoons. Climate Dynamics, 53, 2683-2695, doi:10.1007/s00382-019-04650-2.
- Yang, Y., T. Y. Gan, and X. Z. Tan, 2019: Spatiotemporal Changes in Precipitation Extremes over Canada and Their Teleconnections to Large-Scale Climate Patterns. Journal of Hydrometeorology, 20, 275-296, doi:10.1175/jhm-d-18-0004.1.
- Yu, B., and H. Lin, 2019: Modification of the wintertime Pacific-North American pattern related North American climate anomalies by the Asian-Bering-North American teleconnection. Climate Dynamics, 53, 313-328, doi:10.1007/s00382-018-4586-4.
- Yu, B., H. Lin, and N. Soulard, 2019: A Comparison of North American Surface Temperature and Temperature Extreme Anomalies in Association with Various Atmospheric Teleconnection Patterns. Atmosphere, 10, doi:10.3390/atmos10040172.
- Yu, J., T. J. Zhou, Z. H. Jiang, and L. W. Zou, 2019: Evaluation of Near-Surface Wind Speed Changes during 1979 to 2011 over China Based on Five Reanalysis Datasets. Atmosphere, 10, doi:10.3390/atmos10120804. Yu, L. S., 2019: Global Air-Sea Fluxes of Heat, Fresh Water, and Momentum: Energy Budget Closure and Unanswered Questions. Annual Review of Marine Science, Vol 11, C. A. Carlson, and S. J. Giovannoni, Eds., 227-248.
- Zanchettin, D., T. Toniazzo, C. Taricco, S. Rubinetti, A. Rubino, and N. Tartaglione, 2019: Atlantic origin of asynchronous European interdecadal hydroclimate variability. Scientific Reports, 9, doi:10.1038/s41598-019-47428-6.
- Zhang, L., W. Q. Han, K. B. Karnauskas, G. A. Meehl, A. X. Hu, N. Rosenbloom, and T. Shinoda, 2019: Indian Ocean Warming Trend Reduces Pacific Warming Response to Anthropogenic Greenhouse Gases: An Interbasin Thermostat Mechanism. Geophysical Research Letters, 46, 10882-10890, doi:10.1029/2019gl084088.
- Zhang, L. P., T. L. Delworth, W. Cooke, and X. S. Yang, 2019: Natural variability of Southern Ocean convection as a driver of observed climate trends. Nature Climate Change, 9, 59-+, doi:10.1038/s41558-018-0350-3.
- Zhang, S. Q., G. Y. Ren, Y. Y. Ren, and X. B. Sun, 2019: Comparison of Surface Air Temperature between Observation and Reanalysis Data over Eastern China for the Last 100 Years. Journal of the Meteorological Society of Japan, 97, 89-103, doi:10.2151/jmsj.2019-004.
- Zhang, T. W., and Coauthors, 2020: A 256-year-long precipitation reconstruction for northern Kyrgyzstan based on tree-ring width. International Journal of Climatology, 40, 1477-1491, doi:10.1002/joc.6280.
- Zhang, W., and B. Kirtman, 2019: Understanding the Signal-to-Noise Paradox with a Simple Markov Model. Geophysical Research Letters, 46, 13308-13317, doi:10.1029/2019gl085159.
- Zhang, W. J., X. B. Mei, X. Geng, A. G. Turner, and F. F. Jin, 2019: A Nonstationary ENSO-NAO Relationship Due to AMO Modulation. J. Clim., 32, 33-43, doi:10.1175/jcli-d-18-0365.1.
- Zhao, Y. S., and Coauthors, 2019: Early summer hydroclimatic signals are captured well by tree-ring earlywood width in the eastern Qinling Mountains, central China. Climate of the Past, 15, 1113-1131, doi:10.5194/cp-15-1113-2019.
- Zhao, Z. J., E. C. J. Oliver, D. Ballestero, J. M. Vargas-Hernandez, and N. J. Holbrook, 2019: Influence of the Madden-Julian oscillation on Costa Rican mid-summer drought timing. International Journal of Climatology, 39, 292-301, doi:10.1002/joc.5806.
- Zhou, C. L., K. C. Wang, D. Qi, and J. G. Tan, 2019: ATTRIBUTION OF A RECORD-BREAKING HEATWAVE EVENT IN SUMMER 2017 OVER THE YANGTZE RIVER DELTA. Bulletin of the American Meteorological Society, 100, S97-S103, doi:10.1175/bams-d-18-0134.1.
- Zhou, X. Y., F. Liu, B. Wang, B. Q. Xiang, C. Xing, and H. Wang, 2019: Different responses of East Asian summer rainfall to El Nino decays. Climate Dynamics, 53, 1497-1515, doi:10.1007/s00382-019-04684-6.
2018
- Abish, B., A. Cherchi, and S. B. Ratna, 2018: ENSO and the recent warming of the Indian Ocean. International Journal of Climatology, 38, 203-214, doi:10.1002/joc.5170.
- Al-Khalidi, J., M. Dima, and S. Stefan, 2018: Large-scale modes impact on Iraq climate variability. Theoretical and Applied Climatology, 133, 179-190, doi:10.1007/s00704-017-2180-z.
- Alfaro-Sanchez, R., and Coauthors, 2018: Climatic and volcanic forcing of tropical belt northern boundary over the past 800 years. Nature Geoscience, 11, 933-+, doi:10.1038/s41561-018-0242-1.
- Allen, K. J., and Coauthors, 2018: A comparison of some simple methods used to detect unstable temperature responses in tree-ring chronologies. Dendrochronologia, 48, 52-73, doi:10.1016/j.dendro.2018.02.002.
- Alvarez-Castro, M. C., D. Faranda, and P. Yiou, 2018: Atmospheric Dynamics Leading to West European Summer Hot Temperatures Since 1851. Complexity, doi:10.1155/2018/2494509.
- Amador, J. A., M. J. Anderson, B. Calderon, and K. Pribyl, 2018: The October 1891 Cartago (Costa Rica) floods from documentary sources and 20CR data. International Journal of Climatology, 38, 4830-4845, doi:10.1002/joc.5701.
- Antolinez, J. A. A., A. B. Murray, F. J. Mendez, L. J. Moore, G. Farley, and J. Wood, 2018: Downscaling Changing Coastlines in a Changing Climate: The Hybrid Approach. Journal of Geophysical Research-Earth Surface, 123, 229-251, doi:10.1002/2017jf004367.
- Ashcroft, L., and Coauthors, 2018: A rescued dataset of sub-daily meteorological observations for Europe and the southern Mediterranean region, 1877-2012. Earth System Science Data, 10, 1613-1635, doi:10.5194/essd-10-1613-2018.
- Aubry, T. J., and A. M. Jellinek, 2018: New insights on entrainment and condensation in volcanic plumes: Constraints from independent observations of explosive eruptions and implications for assessing their impacts. Earth and Planetary Science Letters, 490, 132-142, doi:10.1016/j.epsl.2018.03.028.
- Baatz, R., and Coauthors, 2018: Steering operational synergies in terrestrial observation networks: opportunity for advancing Earth system dynamics modelling. Earth System Dynamics, 9, 593-609, doi:10.5194/esd-9-593-2018.
- Badur, J., and W. Cieslikiewicz, 2018: Spatial variability of long-term trends in significant wave height over the Gulf of Gdansk using System Identification techniques. Oceanological and Hydrobiological Studies, 47, 190-201, doi:10.1515/ohs-2018-0018.
- Barcikowska, M. J., S. B. Kapnick, and F. Feser, 2018: Impact of large-scale circulation changes in the North Atlantic sector on the current and future Mediterranean winter hydroclimate. Climate Dynamics, 50, 2039-2059, doi:10.1007/s00382-017-3735-5.
- Barichivich, J., E. Gloor, P. Peylin, R. J. W. Brienen, J. Schongart, J. C. Espinoza, and K. C. Pattnayak, 2018: Recent intensification of Amazon flooding extremes driven by strengthened Walker circulation. Science Advances, 4, doi:10.1126/sciadv.aat8785.
- Bartoszek, K., 2018: Long-term relationships between air flow indices and air temperature over Southeast Poland. Idojaras, 122, 101-118, doi:10.28974/idojaras.2018.2.1.
- Basharin, D., and G. Stankunavicius, 2018: The long-term 20th century re-analysis features over the North Atlantic-Eurasia region. Boreal Environment Research, 23, 139-148, doi:Bathiany, S., V. Dakos, M. Scheffer, and T. M. Lenton, 2018: Climate models predict increasing temperature variability in poor countries. Science Advances, 4, doi:10.1126/sciadv.aar5809.
- Begert, M., and C. Frei, 2018: Long-term area-mean temperature series for SwitzerlandCombining homogenized station data and high resolution grid data. International Journal of Climatology, 38, 2792-2807, doi:10.1002/joc.5460.
- Berntell, E., Q. Zhang, L. Chafik, and H. Kornich, 2018: Representation of Multidecadal Sahel Rainfall Variability in 20th Century Reanalyses. Scientific Reports, 8, doi:10.1038/s41598-018-29217-9.
- Birkel, S. D., P. A. Mayewski, K. A. Maasch, A. V. Kurbatov, and B. Lyon, 2018: Evidence for a volcanic underpinning of the Atlantic multidecadal oscillation. Npj Climate and Atmospheric Science, 1, doi:10.1038/s41612-018-0036-6.
- Bloomfield, H. C., L. C. Shaffrey, K. I. Hodges, and P. L. Vidale, 2018: A critical assessment of the long-term changes in the wintertime surface Arctic Oscillation and Northern Hemisphere storminess in the ERA20C reanalysis. Environmental Research Letters, 13, doi:10.1088/1748-9326/aad5c5.
- Boisier, J. P., and Coauthors, 2018: Anthropogenic drying in central-southern Chile evidenced by long-term observations and climate model simulations. Elementa-Science of the Anthropocene, 6, doi:10.1525/elementa.328. Bokuchava, D. D., and V. A. Semenov, 2018: Surface air temperature and pressure anomalies in the Northern Hemisphere during the 20th century: observations and reanalyses. 24th International Symposium on Atmospheric and Ocean Optics: Atmospheric Physics, G. G. Matvienko, and O. A. Romanovskii, Eds.
- Borchert, L. F., W. A. Muller, and J. Baehr, 2018: Atlantic Ocean Heat Transport Influences Interannual-to-Decadal Surface Temperature Predictability in the North Atlantic Region. J. Clim., 31, 6763-6782, doi:10.1175/jcli-d-17-0734.1.
- Brazdil, R., and Coauthors, 2018: The second most disastrous windstorm of the nineteenth century in the Czech Lands, 26-27 October 1870. Theoretical and Applied Climatology, 132, 1201-1216, doi:10.1007/s00704-017-2146-1.
- Brazdil, R., and Coauthors, 2018: Windstorms and forest disturbances in the Czech Lands: 1801-2015. Agricultural and Forest Meteorology, 250, 47-63, doi:10.1016/j.agrformet.2017.11.036.
- Brierley, C., and I. Wainer, 2018: Inter-annual variability in the tropical Atlantic from the Last Glacial Maximum into future climate projections simulated by CMIP5/PMIP3. Climate of the Past, 14, 1377-1390, doi:10.5194/cp-14-1377-2018.
- Bronnimann, S., and Coauthors, 2018: OBSERVATIONS FOR REANALYSES. Bulletin of the American Meteorological Society, 99, 1851-1866, doi:10.1175/bams-d-17-0229.1.
- Bronnimann, S., and Coauthors, 2018: A roadmap to climate data rescue services. Geoscience Data Journal, 5, 28-39, doi:10.1002/gdj3.56.
- Bronnimann, S., J. Rajczak, E. M. Fischer, C. C. Raible, M. Rohrer, and C. Schar, 2018: Changing seasonality of moderate and extreme precipitation events in the Alps. Natural Hazards and Earth System Sciences, 18, 2047-2056, doi:10.5194/nhess-18-2047-2018.
- Buizza, R., and Coauthors, 2018: THE EU-FP7 ERA-CLIM2 PROJECT CONTRIBUTION TO ADVANCING SCIENCE AND PRODUCTION OF EARTH SYSTEM CLIMATE REANALYSES. Bulletin of the American Meteorological Society, 99, 1003-1014, doi:10.1175/bams-d-17-0199.1.
- Burt, T. P., C. F. Miniat, S. H. Laseter, and W. T. Swank, 2018: Changing patterns of daily precipitation totals at the Coweeta Hydrologic Laboratory, North Carolina, USA. International Journal of Climatology, 38, 94-104, doi:10.1002/joc.5163.
- Cai, L., V. A. Alexeev, J. E. Walsh, and U. S. Bhatt, 2018: Patterns, Impacts, and Future Projections of Summer Variability in the Arctic from CMIP5 Models. J. Clim., 31, 9815-9833, doi:10.1175/jcli-d-18-0119.1.
- Calafat, F. M., T. Wahl, F. Lindsten, J. Williams, and E. Frajka-Williams, 2018: Coherent modulation of the sea-level annual cycle in the United States by Atlantic Rossby waves. Nature Communications, 9, doi:10.1038/s41467-018-04898-y.
- Carton, J. A., G. A. Chepurin, and L. G. Chen, 2018: SODA3: A New Ocean Climate Reanalysis. J. Clim., 31, 6967-6983, doi:10.1175/jcli-d-18-0149.1.
- Changnon, D., 2018: A Spatial and Temporal Analysis of 30-Day Heavy Snowfall Amounts in the Eastern United States, 1900-2016. Journal of Applied Meteorology and Climatology, 57, 319-331, doi:10.1175/jamc-d-17-0217.1.
- Chaste, E., M. P. Girardin, J. O. Kaplan, J. Portier, Y. Bergeron, and C. Hely, 2018: The pyrogeography of eastern boreal Canada from 1901 to 2012 simulated with the LPJ-LMfire model. Biogeosciences, 15, 1273-1292, doi:10.5194/bg-15-1273-2018.
- Chen, D., H. J. Wang, J. Q. Sun, and Y. Gao, 2018: Pacific multi-decadal oscillation modulates the effect of Arctic oscillation and El Nino southern oscillation on the East Asian winter monsoon. International Journal of Climatology, 38, 2808-2818, doi:10.1002/joc.5461.
- Chen, L. L., J. Francis, and E. Hanna, 2018: The "Warm-Arctic/Cold-continents" pattern during 1901-2010. International Journal of Climatology, 38, 5245-5254, doi:10.1002/joc.5725.
- Chen, X., X. Liu, X. Li, M. Liu, and M. Yang, 2018: Activity Characteristics of the East Asian Trough in CMIP5 Models. Atmosphere, 9, doi:10.3390/atmos9020067.
- Chen, Z., B. L. Gan, and L. X. Wu, 2018: Response of the North Pacific Oscillation to global warming in the models of the Intergovernmental Panel on Climate Change Fourth Assessment Report. Journal of Oceanology and Limnology, 36, 601-611, doi:10.1007/s00343-018-7022-z.
- Chen, Z., B. L. Gan, L. X. Wu, and F. Jia, 2018: Pacific-North American teleconnection and North Pacific Oscillation: historical simulation and future projection in CMIP5 models. Climate Dynamics, 50, 4379-4403, doi:10.1007/s00382-017-3881-9.
- Cheng, Y. C., Q. Xu, and X. F. Li, 2018: Spatio-Temporal Variability of Annual Sea Level Cycle in the Baltic Sea. Remote Sensing, 10, doi:10.3390/rs10040528.
- Cheng, Z. G., Y. T. Qiao, M. Q. Jian, and S. T. Siems, 2018: Inter-decadal change of leading pattern of spring rainfall over southern China during 1901-2010. International Journal of Climatology, 38, 3494-3512, doi:10.1002/joc.5511.
- Cheon, S. H., B. D. Hamlington, and K. D. Suh, 2018: Reconstruction of sea level around the Korean Peninsula using cyclostationary empirical orthogonal functions. Ocean Science, 14, 959-970, doi:10.5194/os-14-959-2018.
- Cherchi, A., and Coauthors, 2018: EVALUATION OF AMIP-TYPE ATMOSPHERIC FIELDS AS FORCING FOR MEDITERRANEAN SEA AND GLOBAL OCEAN REANALYSES. Annals of Geophysics, 61, doi:10.4401/ag-7793.
- Choi, B. H., K. O. Kim, J. H. Yuk, and H. S. Lee, 2018: Simulation of the 1953 storm surge in the North Sea. Ocean Dynamics, 68, 1759-1777, doi:10.1007/s10236-018-1223-z.
- Cid, A., T. Wahl, D. P. Chambers, and S. Muis, 2018: Storm Surge Reconstruction and Return Water Level Estimation in Southeast Asia for the 20th Century. Journal of Geophysical Research-Oceans, 123, 437-451, doi:10.1002/2017jc013143.
- Cieslikiewicz, W., A. Dudkowska, G. Gic-Grusza, and J. Jedrasik, 2018: Assessment of the potential for dredged material dispersal from dumping sites in the Gulf of Gdask. Journal of Soils and Sediments, 18, 3437-3447, doi:10.1007/s11368-018-2066-4.
- Coats, S., and K. B. Karnauskas, 2018: A Role for the Equatorial Undercurrent in the Ocean Dynamical Thermostat. J. Clim., 31, 6245-6261, doi:10.1175/jcli-d-17-0513.1.
- Codilean, A. T., H. Munack, T. J. Cohen, W. M. Saktura, A. Gray, and S. M. Mudd, 2018: OCTOPUS: an open cosmogenic isotope and luminescence database. Earth System Science Data, 10, 2123-2139, doi:10.5194/essd-10-2123-2018.
- Comas-Bru, L., and A. Hernandez, 2018: Reconciling North Atlantic climate modes: revised monthly indices for the East Atlantic and the Scandinavian patterns beyond the 20th century. Earth System Science Data, 10, 2329-2344, doi:10.5194/essd-10-2329-2018.
- Cook, B. I., A. P. Williams, J. S. Mankin, R. Seager, J. E. Smerdon, and D. Singh, 2018: Revisiting the Leading Drivers of Pacific Coastal Drought Variability in the Contiguous United States. J. Clim., 31, 25-43, doi:10.1175/jcli-d-17-0172.1.
- Cradden, L. C., and F. McDermott, 2018: A weather regime characterisation of Irish wind generation and electricity demand in winters 2009-11. Environmental Research Letters, 13, doi:10.1088/1748-9326/aabd40.
- Cretat, J., P. Terray, S. Masson, and K. P. Sooraj, 2018: Intrinsic precursors and timescale of the tropical Indian Ocean Dipole: insights from partially decoupled numerical experiment. Climate Dynamics, 51, 1311-1332, doi:10.1007/s00382-017-3956-7.
- Crosta, X., and Coauthors, 2018: Ocean as the main driver of Antarctic ice sheet retreat during the Holocene. Global and Planetary Change, 166, 62-74, doi:10.1016/j.gloplacha.2018.04.007.
- Dafka, S., A. Toreti, J. Luterbacher, P. Zanis, E. Tyrlis, and E. Xoplaki, 2018: On the ability of RCMs to capture the circulation pattern of Etesians. Climate Dynamics, 51, 1687-1706, doi:10.1007/s00382-017-3977-2.
- Dai, X. G., and P. Wang, 2018: Identifying the early 2000s hiatus associated with internal climate variability. Scientific Reports, 8, doi:10.1038/s41598-018-31862-z.
- Danco, J. F., and E. R. Martin, 2018: Understanding the influence of ENSO on the Great Plains low-level jet in CMIP5 models. Climate Dynamics, 51, 1537-1558, doi:10.1007/s00382-017-3970-9.
- Datwyler, C., and Coauthors, 2018: Teleconnection stationarity, variability and trends of the Southern Annular Mode (SAM) during the last millennium. Climate Dynamics, 51, 2321-2339, doi:10.1007/s00382-017-4015-0.
- Davy, R., L. L. Chen, and E. Hanna, 2018: Arctic amplification metrics. International Journal of Climatology, 38, 4384-4394, doi:10.1002/joc.5675.
- de Boisseson, E., M. Balmaseda, and M. Mayer, 2018: Ocean heat content variability in an ensemble of twentieth century ocean reanalyses. Climate Dynamics, 50, 3783-3798, doi:10.1007/s00382-017-3845-0.
- Deser, C., I. R. Simpson, A. S. Phillips, and K. A. McKinnon, 2018: How Well Do We Know ENSO's Climate Impacts over North America, and How Do We Evaluate Models Accordingly? J. Clim., 31, 4991-5014, doi:10.1175/jcli-d-17-0783.1.
- Dessler, A. E., and P. M. Forster, 2018: An Estimate of Equilibrium Climate Sensitivity From Interannual variability. Journal of Geophysical Research-Atmospheres, 123, 8634-8645, doi:10.1029/2018jd028481.
- Dettinger, M. D., F. M. Ralph, and J. J. Rutz, 2018: Empirical Return Periods of the Most Intense Vapor Transports during Historical Atmospheric River Landfalls on the US West Coast. Journal of Hydrometeorology, 19, 1363-1377, doi:10.1175/jhm-d-17-0247.1.
- Diasso, U., and B. J. Abiodun, 2018: Future impacts of global warming and reforestation on drought patterns over West Africa. Theoretical and Applied Climatology, 133, 647-662, doi:10.1007/s00704-017-2209-3.
- Dobrica, V., R. Pirloaga, C. Stefan, and C. Demetrescu, 2018: Inferring geoeffective solar variability signature in stratospheric and tropospheric Northern Hemisphere temperatures. Journal of Atmospheric and Solar-Terrestrial Physics, 180, 137-147, doi:10.1016/j.jastp.2017.05.001.
- Dogar, M. M., 2018: Impact of tropical volcanic eruptions on Hadley circulation using a high-resolution AGCM. Current Science, 114, 1284-1294, doi:10.18520/cs/v114/i06/1284-1294.
- Domeisen, D. I. V., G. Badin, and I. M. Koszalka, 2018: How Predictable Are the Arctic and North Atlantic Oscillations? Exploring the Variability and Predictability of the Northern Hemisphere. J. Clim., 31, 997-1014, doi:10.1175/jcli-d-17-0226.1.
- Dong, B., A. G. Dai, M. Vuille, and O. E. Timm, 2018: Asymmetric Modulation of ENSO Teleconnections by the Interdecadal Pacific Oscillation. J. Clim., 31, 7337-7361, doi:10.1175/jcli-d-17-0663.1.
- Dong, T. Y., W. J. Dong, Y. Guo, J. M. Chou, S. L. Yang, D. Tian, and D. D. Yan, 2018: Future temperature changes over the critical Belt and Road region based on CMIP5 models. Advances in Climate Change Research, 9, 57-65, doi:10.1016/j.accre.2018.01.003.
- Dos Santos, E. P., M. C. Carcedo, C. Zotelo, and S. M. Fiori, 2018: Effects of erosion-accretion processes on a community dominated by Brachidontes rodriguezii (Mollusca: Mytilidae) on a rocky outcrop of the South Atlantic coast. Journal of Marine Systems, 187, 146-155, doi:10.1016/j.jmarsys.2018.07.006.
- Du, J. Z., K. C. Wang, J. K. Wang, S. J. Jiang, and C. L. Zhou, 2018: Diurnal Cycle of Surface Air Temperature within China in Current Reanalyses: Evaluation and Diagnostics. J. Clim., 31, 4585-4603, doi:10.1175/jcli-d-17-0773.1.
- Dubinkina, S., 2018: Relevance of conservative numerical schemes for an Ensemble Kalman Filter. Quarterly Journal of the Royal Meteorological Society, 144, 468-477, doi:10.1002/qj.3219.
- Emery, C. M., A. Paris, S. Biancamaria, A. Boone, S. Calmant, P. A. Garambois, and J. S. da Silva, 2018: Large-scale hydrological model river storage and discharge correction using a satellite altimetry-based discharge product. Hydrology and Earth System Sciences, 22, 2135-2162, doi:10.5194/hess-22-2135-2018.
- Felis, T., M. Ionita, N. Rimbu, G. Lohmann, and M. Kolling, 2018: Mild and Arid Climate in the Eastern Sahara-Arabian Desert During the Late Little Ice Age. Geophysical Research Letters, 45, 7112-7119, doi:10.1029/2018gl078617.
- Feng, F., and K. C. Wang, 2018: Merging Satellite Retrievals and Reanalyses to Produce Global Long-Term and Consistent Surface Incident Solar Radiation Datasets. Remote Sensing, 10, doi:10.3390/rs10010115.
- Feng, X. B., K. Haines, and E. de Boisseson, 2018: Coupling of surface air and sea surface temperatures in the CERA-20C reanalysis. Quarterly Journal of the Royal Meteorological Society, 144, 195-207, doi:10.1002/qj.3194.
- Feng, X. B., K. Haines, C. L. Liu, E. de Boisseson, and I. Polo, 2018: Improved SST-Precipitation Intraseasonal Relationships in the ECMWF Coupled Climate Reanalysis. Geophysical Research Letters, 45, 3664-3672, doi:10.1029/2018gl077138.
- Flanagan, P. X., J. B. Basara, J. C. Furtado, and X. M. Xiao, 2018: Primary Atmospheric Drivers of Pluvial Years in the United States Great Plains. Journal of Hydrometeorology, 19, 643-658, doi:10.1175/jhm-d-17-0148.1.
- Fogt, R. L., L. N. Clark, and J. P. Nicolas, 2018: A New Monthly Pressure Dataset Poleward of 60 degrees S since 1957. J. Clim., 31, 3865-3874, doi:10.1175/jcli-d-17-0879.1.
- Folland, C. K., O. Boucher, A. Colman, and D. E. Parker, 2018: Causes of irregularities in trends of global mean surface temperature since the late 19th century. Science Advances, 4, doi:10.1126/sciadv.aao5297.
- Fourre, E., A. Landais, A. Cauquoin, P. Jean-Baptiste, V. Lipenkov, and J. R. Petit, 2018: Tritium Records to Trace Stratospheric Moisture Inputs in Antarctica. Journal of Geophysical Research-Atmospheres, 123, 3009-3018, doi:10.1002/2018jd028304.
- Frederikse, T., and T. Gerkema, 2018: Multi-decadal variability in seasonal mean sea level along the North Sea coast. Ocean Science, 14, 1491-1501, doi:10.5194/os-14-1491-2018.
- Frederikse, T., S. Jevrejeva, R. E. M. Riva, and S. Dangendorf, 2018: A Consistent Sea-Level Reconstruction and Its Budget on Basin and Global Scales over 1958-2014. J. Clim., 31, 1267-1280, doi:10.1175/jcli-d-17-0502.1.
- Frederiksen, C. S., K. R. Ying, S. Grainger, and X. G. Zheng, 2018: Modes of interannual variability in northern hemisphere winter atmospheric circulation in CMIP5 models: evaluation, projection and role of external forcing. Climate Dynamics, 50, 2845-2865, doi:10.1007/s00382-017-3776-9.
- Fuentes, M., and Coauthors, 2018: A 970-year-long summer temperature reconstruction from Rogen, west-central Sweden, based on blue intensity from tree rings. Holocene, 28, 254-266, doi:10.1177/0959683617721322.
- Fukui, S., T. Iwasaki, K. Saito, H. Seko, and M. Kunii, 2018: A Feasibility Study on the High-Resolution Regional Reanalysis over Japan Assimilating Only Conventional Observations as an Alternative to the Dynamical Downscaling. Journal of the Meteorological Society of Japan, 96, 565-585, doi:10.2151/jmsj.2018-056.
- Galabov, V., and H. Chervenkov, 2018: Study of the Western Black Sea Storms with a Focus on the Storms Caused by Cyclones of North African Origin. Pure and Applied Geophysics, 175, 3779-3799, doi:10.1007/s00024-018-1844-7.
- Garcia-Herrera, R., D. Barriopedro, D. Gallego, J. Mellado-Cano, D. Wheeler, and C. Wilkinson, 2018: Understanding weather and climate of the last 300 years from ships' logbooks. Wiley Interdisciplinary Reviews-Climate Change, 9, doi:10.1002/wcc.544.
- Gerber, E. P., and P. Martineau, 2018: Quantifying the variability of the annular modes: reanalysis uncertainty vs. sampling uncertainty. Atmospheric Chemistry and Physics, 18, 17099-17117, doi:10.5194/acp-18-17099-2018.
- Giannakis, D., and J. Slawinska, 2018: Indo-Pacific Variability on Seasonal to Multidecadal Time Scales. Part II: Multiscale Atmosphere-Ocean Linkages. J. Clim., 31, 693-725, doi:10.1175/jcli-d-17-0031.1.
- Gilabert, J., and M. C. Llasat, 2018: Circulation weather types associated with extreme flood events in Northwestern Mediterranean. International Journal of Climatology, 38, 1864-1876, doi:10.1002/joc.5301.
- Gong, H. N., L. Wang, W. Chen, and D. Nath, 2018: Multidecadal Fluctuation of the Wintertime Arctic Oscillation Pattern and Its Implication. J. Clim., 31, 5595-5608, doi:10.1175/jcli-d-17-0530.1.
- Gowda, K., S. Iams, and M. Silber, 2018: Signatures of human impact on self-organized vegetation in the Horn of Africa. Scientific Reports, 8, doi:10.1038/s41598-018-22075-5.
- Graeter, K. A., and Coauthors, 2018: Ice Core Records of West Greenland Melt and Climate Forcing. Geophysical Research Letters, 45, 3164-3172, doi:10.1002/2017gl076641.
- Grise, K. M., S. M. Davis, P. W. Staten, and O. Adam, 2018: Regional and Seasonal Characteristics of the Recent Expansion of the Tropics. J. Clim., 31, 6839-6856, doi:10.1175/jcli-d-18-0060.1.
- Gross, M. H., M. G. Donat, L. V. Alexander, and S. A. Sisson, 2018: The Sensitivity of Daily Temperature Variability and Extremes to Dataset Choice. J. Clim., 31, 1337-1359, doi:10.1175/jcli-d-17-0243.1.
- Grotjahn, R., and J. Huynh, 2018: Contiguous US summer maximum temperature and heat stress trends in CRU and NOAA Climate Division data plus comparisons to reanalyses. Scientific Reports, 8, doi:10.1038/s41598-018-29286-w.
- Gu, X. F., F. W. Bao, T. H. Cheng, H. Chen, Y. Wang, and H. Guo, 2018: The impacts of regional transport and meteorological factors on aerosol optical depth over Beijing, 1980-2014. Scientific Reports, 8, doi:10.1038/s41598-018-22803-x.
- Guimberteau, M., and Coauthors, 2018: ORCHIDEE-MICT (v8.4.1), a land surface model for the high latitudes: model description and validation. Geoscientific Model Development, 11, 121-163, doi:10.5194/gmd-11-121-2018.
- Guo, B. B., and Coauthors, 2018: Applicability Assessment and Uncertainty Analysis of Multi-Precipitation Datasets for the Simulation of Hydrologic Models. Water, 10, doi:10.3390/w10111611.
- Guo, R. X., X. D. Guan, Y. L. He, Z. W. Gan, and H. C. Jin, 2018: Different roles of dynamic and thermodynamic effects in enhanced semi-arid warming. International Journal of Climatology, 38, 13-22, doi:10.1002/joc.5155.
- Guo, Y. P., and Z. M. Tan, 2018: The Hadley Circulation Regime Change: Combined Effect of the Western Pacific Warming and Increased ENSO Amplitude. J. Clim., 31, 9739-9751, doi:10.1175/jcli-d-18-0306.1.
- Hall, R. J., and E. Hanna, 2018: North Atlantic circulation indices: links with summer and winter UK temperature and precipitation and implications for seasonal forecasting. International Journal of Climatology, 38, E660-E677, doi:10.1002/joc.5398.
- Hamilton, D. S., and Coauthors, 2018: Reassessment of pre-industrial fire emissions strongly affects anthropogenic aerosol forcing. Nature Communications, 9, doi:10.1038/s41467-018-05592-9.
- Hanna, E., X. Fettweis, and R. J. Hall, 2018: Brief communication: Recent changes in summer Greenland blocking captured by none of the CMIP5 models. Cryosphere, 12, 3287-3292, doi:10.5194/tc-12-3287-2018.
- Hanna, E., R. J. Hall, T. E. Cropper, T. J. Ballinger, L. Wake, T. Mote, and J. Cappelen, 2018: Greenland blocking index daily series 1851-2015: Analysis of changes in extremes and links with North Atlantic and UK climate variability and change. International Journal of Climatology, 38, 3546-3564, doi:10.1002/joc.5516.
- Harlass, J., M. Latif, and W. Park, 2018: Alleviating tropical Atlantic sector biases in the Kiel climate model by enhancing horizontal and vertical atmosphere model resolution: climatology and interannual variability. Climate Dynamics, 50, 2605-2635, doi:10.1007/s00382-017-3760-4.
- Haro-Monteagudo, D., A. Daccache, and J. Knox, 2018: Exploring the utility of drought indicators to assess climate risks to agricultural productivity in a humid climate. Hydrology Research, 49, 539-551, doi:10.2166/nh.2017.010.
- Hegerl, G. C., S. Bronnimann, A. Schurer, and T. Cowan, 2018: The early 20th century warming: Anomalies, causes, and consequences. Wiley Interdisciplinary Reviews-Climate Change, 9, doi:10.1002/wcc.522.
- Hempelmann, N., and Coauthors, 2018: Web processing service for climate impact and extreme weather event analyses. Flyingpigeon (Version 1.0). Computers & Geosciences, 110, 65-72, doi:10.1016/j.cageo.2017.10.004.
- Hessl, A. E., and Coauthors, 2018: Past and future drought in Mongolia. Science Advances, 4, doi:10.1126/sciadv.1701832.
- Hirons, L., and A. Turner, 2018: The Impact of Indian Ocean Mean-State Biases in Climate Models on the Representation of the East African Short Rains. J. Clim., 31, 6611-6631, doi:10.1175/jcli-d-17-0804.1.
- Hu, Z. H., S. T. Michaletz, D. J. Johnson, N. G. McDowell, Z. Q. Huang, X. H. Zhou, and C. G. Xu, 2018: Traits drive global wood decomposition rates more than climate. Global Change Biology, 24, 5259-5269, doi:10.1111/gcb.14357.
- Hu, Z. Y., and Coauthors, 2018: Evaluation of three global gridded precipitation data sets in central Asia based on rain gauge observations. International Journal of Climatology, 38, 3475-3493, doi:10.1002/joc.5510.
- Huang, B., U. Cubasch, and Y. Li, 2018: East Asian Summer Monsoon Representation in Re-Analysis Datasets. Atmosphere, 9, doi:10.3390/atmos9060235.
- Huang, R. P., S. F. Chen, W. Chen, and P. Hu, 2018: Has the regional Hadley circulation over western Pacific during boreal winter been strengthening in recent decades? Atmospheric and Oceanic Science Letters, 11, 454-463, doi:10.1080/16742834.2018.1507412.
- Huang, W. R., S. Y. S. Wang, and B. T. Guan, 2018: Decadal fluctuations in the western Pacific recorded by long precipitation records in Taiwan. Climate Dynamics, 50, 1597-1608, doi:10.1007/s00382-017-3707-9.
- Huang, Z. W., and Coauthors, 2018: Reconstruction of global gridded monthly sectoral water withdrawals for 1971-2010 and analysis of their spatiotemporal patterns. Hydrology and Earth System Sciences, 22, 2117-2133, doi:10.5194/hess-22-2117-2018.
- Ionita, M., C. A. Badaluta, P. Scholz, and S. Chelcea, 2018: Vanishing river ice cover in the lower part of the Danube basin - signs of a changing climate. Scientific Reports, 8, doi:10.1038/s41598-018-26357-w.
- Jaffres, J. B. D., C. Cuff, C. Rasmussen, and A. S. Hesson, 2018: Teleconnection of atmospheric and oceanic climate anomalies with Australian weather patterns: a review of data availability. Earth-Science Reviews, 176, 117-146, doi:10.1016/j.earscirev.2017.08.010.
- Jezequel, A., P. Yiou, and S. Radanovics, 2018: Role of circulation in European heatwaves using flow analogues. Climate Dynamics, 50, 1145-1159, doi:10.1007/s00382-017-3667-0.
- Jimenez, G., J. E. Cole, D. M. Thompson, and A. W. Tudhope, 2018: Northern Galapagos Corals Reveal Twentieth Century Warming in the Eastern Tropical Pacific. Geophysical Research Letters, 45, 1981-1988, doi:10.1002/2017gl075323.
- Jin, X. L., and Coauthors, 2018: Influences of Pacific Climate Variability on Decadal Subsurface Ocean Heat Content Variations in the Indian Ocean. J. Clim., 31, 4157-4174, doi:10.1175/jcli-d-17-0654.1. Josey, S. A., J. J. M. Hirschi, B. Sinha, A. Duchez, J. P. Grist, and R. Marsh, 2018: The Recent Atlantic Cold Anomaly: Causes, Consequences, and Related Phenomena. Annual Review of Marine Science, Vol 10, C. A. Carlson, and S. J. Giovannoni, Eds., 475-501.
- Kajtar, J. B., A. Santoso, S. McGregor, M. H. England, and Z. Baillie, 2018: Model under-representation of decadal Pacific trade wind trends and its link to tropical Atlantic bias. Climate Dynamics, 50, 1471-1484, doi:10.1007/s00382-017-3699-5.
- Karspeck, A. R., and Coauthors, 2018: A global coupled ensemble data assimilation system using the Community Earth System Model and the Data Assimilation Research Testbed. Quarterly Journal of the Royal Meteorological Society, 144, 2404-2430, doi:10.1002/qj.3308.
- Kay, A. L., V. A. Bell, B. P. Guillod, R. G. Jones, and A. C. Rudd, 2018: National-scale analysis of low flow frequency: historical trends and potential future changes. Climatic Change, 147, 585-599, doi:10.1007/s10584-018-2145-y.
- Kayano, M. T., R. V. Andreoli, S. R. Garcia, and R. A. F. de Souza, 2018: How the two nodes of the tropical Atlantic sea surface temperature dipole relate the climate of the surrounding regions during austral autumn. International Journal of Climatology, 38, 3927-3941, doi:10.1002/joc.5545.
- Kayano, M. T., and A. W. Setzer, 2018: Nearly Synchronous Multidecadal Oscillations of Surface Air Temperature in Punta Arenas and the Atlantic Multidecadal Oscillation Index. J. Clim., 31, 7237-7248, doi:10.1175/jcli-d-17-0793.1.
- Kenigson, J. S., W. Q. Han, B. Rajagopalan, Yanto, and M. Jasinski, 2018: Decadal Shift of NAO-Linked Interannual Sea Level Variability along the US Northeast Coast. J. Clim., 31, 4981-4989, doi:10.1175/jcli-d-17-0403.1.
- Kim, W. M., S. Yeager, P. Chang, and G. Danabasoglu, 2018: Low-Frequency North Atlantic Climate Variability in the Community Earth System Model Large Ensemble. J. Clim., 31, 787-813, doi:10.1175/jcli-d-17-0193.1.
- Kim, W. M., S. G. Yeager, and G. Danabasoglu, 2018: Key Role of Internal Ocean Dynamics in Atlantic Multidecadal Variability During the Last Half Century. Geophysical Research Letters, 45, 13449-13457, doi:10.1029/2018gl080474.
- King, A. D., and C. L. Vincent, 2018: Using Global and Regional Model Simulations to Understand Maritime Continent Wet-Season Rainfall Variability. Geophysical Research Letters, 45, 12534-12543, doi:10.1029/2018gl080201.
- King, M. P., I. Herceg-Bulic, F. Kucharski, and N. Keenlyside, 2018: Interannual tropical Pacific sea surface temperature anomalies teleconnection to Northern Hemisphere atmosphere in November. Climate Dynamics, 50, 1881-1899, doi:10.1007/s00382-017-3727-5.
- Kirk, J. P., and G. A. Cromley, 2018: Assimilating Weather Data into a Digital Event Gazetteer of Airborne Parachute Operations during the French Indochina War. Weather Climate and Society, 10, 19-34, doi:10.1175/wcas-d-17-0016.1.
- Klaus, D., P. Wyszynski, K. Dethloff, R. Przybytak, and A. Rinke, 2018: Evaluation of 20CR reanalysis data and model results based on historical (1930-1940) observations from Franz Josef Land. Polish Polar Research, 39, 225-254, doi:10.24425/118747.
- Knox, J. W., D. Haro-Monteagudo, T. M. Hess, and J. Morris, 2018: Identifying Trade-Offs and Reconciling Competing Demands for Water: Integrating Agriculture Into a Robust Decision-Making Framework. Earths Future, 6, 1457-1470, doi:10.1002/2017ef000741.
- Koide, D., and A. Ito, 2018: Temporal changes in the relationship between tree-ring growth and net primary production in northern Japan: a novel approach to the estimation of seasonal photosynthate allocation to the stem. Ecological Research, 33, 1275-1287, doi:10.1007/s11284-018-1639-4.
- Kosaka, Y., 2018: Slow warming and the ocean see-saw. Nature Geoscience, 11, 12-13, doi:10.1038/s41561-017-0038-8.
- Kravtsov, S., C. Grimm, and S. Gu, 2018: Global-scale multidecadal variability missing in state-of-the-art climate models. Npj Climate and Atmospheric Science, 1, doi:10.1038/s41612-018-0044-6.
- Kudamatsu, M., 2018: GIS for Credible Identification Strategies in Economics Research. Cesifo Economic Studies, 64, 327-338, doi:10.1093/cesifo/ifx026.
- Kwon, Y. O., A. Camacho, C. Martinez, and H. Seo, 2018: North Atlantic winter eddy-driven jet and atmospheric blocking variability in the Community Earth System Model version 1 Large Ensemble simulations. Climate Dynamics, 51, 3275-3289, doi:10.1007/s00382-018-4078-6.
- Lai, A. W. C., M. Herzog, and H. F. Graf, 2018: ENSO Forecasts near the Spring Predictability Barrier and Possible Reasons for the Recently Reduced Predictability. J. Clim., 31, 815-838, doi:10.1175/jcli-d-17-0180.1.
- Laloyaux, P., and Coauthors, 2018: CERA-20C: A Coupled Reanalysis of the Twentieth Century. Journal of Advances in Modeling Earth Systems, 10, 1172-1195, doi:10.1029/2018ms001273.
- Lehner, F., C. Deser, I. R. Simpson, and L. Terray, 2018: Attributing the US Southwest's Recent Shift Into Drier Conditions. Geophysical Research Letters, 45, 6251-6261, doi:10.1029/2018gl078312.
- Levine, A. F. Z., D. M. W. Frierson, and M. J. McPhaden, 2018: AMO Forcing of Multidecadal Pacific ITCZ Variability. J. Clim., 31, 5749-5764, doi:10.1175/jcli-d-17-0810.1.
- Lewis, E., and Coauthors, 2018: A rule based quality control method for hourly rainfall data and a 1 km resolution gridded hourly rainfall dataset for Great Britain: CEH-GEAR1hr. Journal of Hydrology, 564, 930-943, doi:10.1016/j.jhydrol.2018.07.034.
- Lhotka, O., and A. Farda, 2018: Links between Temperature Biases and Flow Anomalies in an Ensemble of CNRM-CM5.1 Global Climate Model Historical Simulations. Advances in Meteorology, doi:10.1155/2018/4984827.
- Li, D. W., R. Zhang, and T. Knutson, 2018: Comparison of Mechanisms for Low-Frequency Variability of Summer Arctic Sea Ice in Three Coupled Models. J. Clim., 31, 1205-1226, doi:10.1175/jcli-d-16-0617.1.
- Li, G., J. P. Chen, X. Wang, and Y. K. Tan, 2018: Influence of the South Pacific decadal variability on Southeast China rainfall during boreal autumn. International Journal of Climatology, 38, E209-E223, doi:10.1002/joc.5363.
- Li, J., and B. Wang, 2018: Origins of the Decadal Predictability of East Asian Land Summer Monsoon Rainfall. J. Clim., 31, 6229-6243, doi:10.1175/jcli-d-17-0790.1.
- Li, R. X., and J. Q. Sun, 2018: Interdecadal variability of the large-scale extreme hot event frequency over the middle and lower reaches of the Yangtze River basin and its related atmospheric patterns. Atmospheric and Oceanic Science Letters, 11, 63-70, doi:10.1080/16742834.2017.1335580.
- Li, Y., B. Tinz, H. von Storch, Q. Y. Wang, Q. L. Zhou, and Y. N. Zhu, 2018: Construction of a surface air temperature series for Qingdao in China for the period 1899 to 2014. Earth System Science Data, 10, 643-652, doi:10.5194/essd-10-643-2018.
- Li, Y. L., W. Q. Han, A. X. Hu, G. A. Meehl, and F. Wang, 2018: Multidecadal Changes of the Upper Indian Ocean Heat Content during 1965-2016. J. Clim., 31, 7863-7884, doi:10.1175/jcli-d-18-0116.1.
- Lian, T., Z. Q. Shen, J. Ying, Y. M. Tang, J. D. Li, and Z. Ling, 2018: Investigating the Uncertainty in Global SST Trends Due to Internal Variations Using an Improved Trend Estimator. Journal of Geophysical Research-Oceans, 123, 1877-1895, doi:10.1002/2017jc013410.
- Lin, Y. H., and S. Y. S. Wang, 2018: Multidecadal Variability in the Subseasonal Peak of Low-Level Convergence over the Pacific Warm Pool. Atmosphere, 9, doi:10.3390/atmos9050158.
- Lionello, P., and L. Scarascia, 2018: The relation between climate change in the Mediterranean region and global warming. Regional Environmental Change, 18, 1481-1493, doi:10.1007/s10113-018-1290-1.
- Liu, B., G. Huang, K. M. Hu, R. G. Wu, H. N. Gong, P. F. Wang, and G. J. Zhao, 2018: The multidecadal variations of the interannual relationship between the East Asian summer monsoon and ENSO in a coupled model. Climate Dynamics, 51, 1671-1686, doi:10.1007/s00382-017-3976-3.
- Liu, C. L., and R. P. Allan, 2018: Unrealistic Increases in Wind Speed Explain Reduced Eastern Pacific Heat Flux in Reanalyses. J. Clim., 31, 2981-2993, doi:10.1175/jcli-d-17-0642.1.
- Liu, J. P., H. L. Ren, W. J. Li, and J. Q. Zuo, 2018: Remarkable Impacts of Indian Ocean Sea Surface Temperature on Interdecadal Variability of Summer Rainfall in Southwestern China. Atmosphere, 9, doi:10.3390/atmos9030103.
- Lovejoy, S., 2018: Spectra, intermittency, and extremes of weather, macroweather and climate. Scientific Reports, 8, doi:10.1038/s41598-018-30829-4.
- Lubken, F. J., U. Berger, and G. Baumgarten, 2018: On the Anthropogenic Impact on Long-Term Evolution of Noctilucent Clouds. Geophysical Research Letters, 45, 6681-6689, doi:10.1029/2018gl077719.
- Luo, F. F., S. L. Li, and T. Furevik, 2018: Weaker connection between the Atlantic Multidecadal Oscillation and Indian summer rainfall since the mid-1990s. Atmospheric and Oceanic Science Letters, 11, 37-43, doi:10.1080/16742834.2018.1394779.
- Luo, F. F., S. L. Li, Y. Q. Gao, N. Keenlyside, L. Svendsen, and T. Furevik, 2018: The connection between the Atlantic multidecadal oscillation and the Indian summer monsoon in CMIP5 models. Climate Dynamics, 51, 3023-3039, doi:10.1007/s00382-017-4062-6.
- Ma, T. J., W. Chen, D. Nath, H. F. Graf, L. Wang, and J. L. Huangfu, 2018: East Asian Winter Monsoon Impacts the ENSO-related Teleconnections and North American Seasonal Air Temperature Prediction. Scientific Reports, 8, doi:10.1038/s41598-018-24552-3.
- Magee, A. D., and D. C. Verdon-Kidd, 2018: On the relationship between Indian Ocean sea surface temperature variability and tropical cyclogenesis in the southwest Pacific. International Journal of Climatology, 38, E774-E795, doi:10.1002/joc.5406.
- Malik, A., and S. Bronnimann, 2018: Factors affecting the inter-annual to centennial timescale variability of Indian summer monsoon rainfall. Climate Dynamics, 50, 4347-4364, doi:10.1007/s00382-017-3879-3.
- Mamalakis, A., and E. Foufoula-Georgiou, 2018: A Multivariate Probabilistic Framework for Tracking the Intertropical Convergence Zone: Analysis of Recent Climatology and Past Trends. Geophysical Research Letters, 45, 13080-13089, doi:10.1029/2018gl079865.
- Mamalakis, A., J. Y. Yu, J. T. Randerson, A. AghaKouchak, and E. Foufoula-Georgiou, 2018: A new interhemispheric teleconnection increases predictability of winter precipitation in southwestern US. Nature Communications, 9, doi:10.1038/s41467-018-04722-7.
- Manney, G. L., and M. I. Hegglin, 2018: Seasonal and Regional Variations of Long-Term Changes in Upper-Tropospheric Jets from Reanalyses. J. Clim., 31, 423-448, doi:10.1175/jcli-d-17-0303.1.
- Martineau, P., S. W. Son, M. Taguchi, and A. H. Butler, 2018: A comparison of the momentum budget in reanalysis datasets during sudden stratospheric warming events. Atmospheric Chemistry and Physics, 18, 7169-7187, doi:10.5194/acp-18-7169-2018.
- Martineau, P., J. S. Wright, N. L. Zhu, and M. Fujiwara, 2018: Zonal-mean data set of global atmospheric reanalyses on pressure levels. Earth System Science Data, 10, 1925-1941, doi:10.5194/essd-10-1925-2018.
- Masaki, Y., N. Hanasaki, K. Takahashi, and Y. Hijioka, 2018: Consequences of implementing a reservoir operation algorithm in a global hydrological model under multiple meteorological forcing. Hydrological Sciences Journal-Journal Des Sciences Hydrologiques, 63, 1047-1061, doi:10.1080/02626667.2018.1473872.
- May, J. H., and Coauthors, 2018: Evolution of sandstone peak-forest landscapes - insights from quantifying erosional processes with cosmogenic nuclides. Earth Surface Processes and Landforms, 43, 639-653, doi:10.1002/esp.4273.
- McGraw, M. C., and E. A. Barnes, 2018: Memory Matters: A Case for Granger Causality in Climate Variability Studies. J. Clim., 31, 3289-3300, doi:10.1175/jcli-d-17-0334.1.
- McGregor, S., M. F. Stuecker, J. B. Kajtar, M. H. England, and M. Collins, 2018: Model tropical Atlantic biases underpin diminished Pacific decadal variability. Nature Climate Change, 8, 493-+, doi:10.1038/s41558-018-0163-4.
- McKinnon, K. A., and C. Deser, 2018: Internal Variability and Regional Climate Trends in an Observational Large Ensemble. J. Clim., 31, 6783-6802, doi:10.1175/jcli-d-17-0901.1.
- Mellado-Cano, J., D. Barriopedro, R. Garcia-Herrera, R. M. Trigo, and M. C. Alvarez-Castro, 2018: Euro-Atlantic Atmospheric Circulation during the Late Maunder Minimum. J. Clim., 31, 3849-3863, doi:10.1175/jcli-d-17-0261.1.
- Menary, M. B., and Coauthors, 2018: Preindustrial Control Simulations With HadGEM3-GC3.1 for CMIP6. Journal of Advances in Modeling Earth Systems, 10, 3049-3075, doi:10.1029/2018ms001495.
- Miao, J. P., T. Wang, H. J. Wang, and J. Q. Sun, 2018: Interannual Weakening of the Tropical Pacific Walker Circulation Due to Strong Tropical Volcanism. Advances in Atmospheric Sciences, 35, 645-658, doi:10.1007/s00376-017-7134-y.
- Misra, U., A. Deshamukhya, S. Sharma, and S. Pal, 2018: Simulation of Daily Rainfall from Concurrent Meteorological Parameters over Core Monsoon Region of India: A Novel Approach. Advances in Meteorology, doi:10.1155/2018/3053640.
- Mo, K. C., and D. P. Lettenmaier, 2018: Drought Variability and Trends over the Central United States in the Instrumental Record. Journal of Hydrometeorology, 19, 1149-1166, doi:10.1175/jhm-d-17-0225.1.
- Moller, M., and J. Kohler, 2018: Differing Climatic Mass Balance Evolution Across Svalbard Glacier Regions Over 1900-2010. Frontiers in Earth Science, 6, doi:10.3389/feart.2018.00128.
- Muilwijk, M., L. H. Smedsrud, M. Ilicak, and H. Drange, 2018: Atlantic Water Heat Transport Variability in the 20th Century Arctic Ocean From a Global Ocean Model and Observations. Journal of Geophysical Research-Oceans, 123, 8159-8179, doi:10.1029/2018jc014327.
- Nagaraju, C., K. Ashok, T. M. B. Nair, Z. Y. Guan, and W. J. Cai, 2018: Potential influence of the Atlantic Multi-decadal Oscillation in modulating the biennial relationship between Indian and Australian summer monsoons. International Journal of Climatology, 38, 5220-5230, doi:10.1002/joc.5722.
- Nangombe, S., T. J. Zhou, W. X. Zhang, B. Wu, S. Hu, L. W. Zou, and D. H. Li, 2018: Record-breaking climate extremes in Africa under stabilized 1.5 degrees C and 2 degrees C global warming scenarios. Nature Climate Change, 8, 375-+, doi:10.1038/s41558-018-0145-6.
- O'Reilly, C. H., 2018: Interdecadal variability of the ENSO teleconnection to the wintertime North Pacific. Climate Dynamics, 51, 3333-3350, doi:10.1007/s00382-018-4081-y.
- O'Reilly, C. H., and L. Zanna, 2018: The Signature of Oceanic Processes in Decadal Extratropical SST Anomalies. Geophysical Research Letters, 45, 7719-7730, doi:10.1029/2018gl079077.
- Ols, C., M. P. Girardin, A. Hofgaard, Y. Bergeron, and I. Drobyshev, 2018: Monitoring Climate Sensitivity Shifts in Tree-Rings of Eastern Boreal North America Using Model-Data Comparison. Ecosystems, 21, 1042-1057, doi:10.1007/s10021-017-0203-3.
- Oshima, K., K. Ogata, H. Park, and Y. Tachibana, 2018: Influence of atmospheric internal variability on the long-term Siberian water cycle during the past 2 centuries. Earth System Dynamics, 9, 497-506, doi:10.5194/esd-9-497-2018.
- Ozturk, U., N. Marwan, S. von Specht, O. Korup, and J. Jensen, 2018: A New Centennial Sea-Level Record for Antalya, Eastern Mediterranean. Journal of Geophysical Research-Oceans, 123, 4503-4517, doi:10.1029/2018jc013906.
- Panyushkina, I. P., and Coauthors, 2018: Runoff variations in Lake Balkhash Basin, Central Asia, 1779-2015, inferred from tree rings. Climate Dynamics, 51, 3161-3177, doi:10.1007/s00382-018-4072-z.
- Paprotny, D., A. Sebastian, O. Morales-Napoles, and S. N. Jonkman, 2018: Trends in flood losses in Europe over the past 150 years. Nature Communications, 9, doi:10.1038/s41467-018-04253-1.
- Parsons, L. A., S. Coats, and J. T. Overpeck, 2018: The Continuum of Drought in Southwestern North America. J. Clim., 31, 8627-8643, doi:10.1175/jcli-d-18-0010.1.
- Partridge, T. F., J. M. Winter, E. C. Osterberg, D. W. Hyndman, A. D. Kendall, and F. J. Magilligan, 2018: Spatially Distinct Seasonal Patterns and Forcings of the US Warming Hole. Geophysical Research Letters, 45, 2055-2063, doi:10.1002/2017gl076463.
- Pasternack, A., J. Bhend, M. A. Liniger, H. W. Rust, W. A. Muller, and U. Ulbrich, 2018: Parametric decadal climate forecast recalibration (DeFoReSt 1.0). Geoscientific Model Development, 11, 351-368, doi:10.5194/gmd-11-351-2018.
- Pei, L., and Z. W. Yan, 2018: Diminishing clear winter skies in Beijing towards a possible future. Environmental Research Letters, 13, doi:10.1088/1748-9326/aaf032.
- Pei, L., Z. W. Yan, Z. B. Sun, S. G. Miao, and Y. Yao, 2018: Increasing persistent haze in Beijing: potential impacts of weakening East Asian winter monsoons associated with northwestern Pacific sea surface temperature trends. Atmospheric Chemistry and Physics, 18, 3173-3183, doi:10.5194/acp-18-3173-2018.
- Pereira, S., A. M. Ramos, L. Rebelo, R. M. Trigo, and J. L. Zezere, 2018: A centennial catalogue of hydro-geomorphological events and their atmospheric forcing. Advances in Water Resources, 122, 98-112, doi:10.1016/j.advwatres.2018.10.001.
- Perez-Zanon, N., M. C. Casas-Castillo, J. C. Pena, M. Aran, R. Rodriguez-Sola, A. Redano, and G. Sole, 2018: Analysis of synoptic patterns in relationship with severe rainfall events in the Ebre Observatory (Catalonia). Acta Geophysica, 66, 405-414, doi:10.1007/s11600-018-0126-1.
- Pillar, H. R., H. L. Johnson, D. P. Marshall, P. Heimbach, and S. Takao, 2018: Impacts of Atmospheric Reanalysis Uncertainty on Atlantic Overturning Estimates at 25 degrees N. J. Clim., 31, 8719-8744, doi:10.1175/JCLI-D-18-0241.s1.
- Pingree-Shippee, K. A., F. W. Zwiers, and D. E. Atkinson, 2018: Representation of mid-latitude North American coastal storm activity by six global reanalyses. International Journal of Climatology, 38, 1041-1059, doi:10.1002/joc.5235.
- Pohl, B., B. Dieppois, J. Cretat, D. Lawler, and M. Rouault, 2018: From Synoptic to Interdecadal Variability in Southern African Rainfall: Toward a Unified View across Time Scales. J. Clim., 31, 5845-5872, doi:10.1175/jcli-d-17-0405.1.
- Polashenski, D. J., and Coauthors, 2018: Denali Ice Core Methanesulfonic Acid Records North Pacific Marine Primary Production. Journal of Geophysical Research-Atmospheres, 123, 4642-4653, doi:10.1029/2017jd028123.
- Poli, P., and P. Brunel, 2018: Assessing reanalysis quality with early sounders Nimbus-4 IRIS (1970) and Nimbus-6 HIRS (1975). Advances in Space Research, 62, 245-264, doi:10.1016/j.asr.2018.04.022.
- Potter, G. L., L. Carriere, J. Hertz, M. Bosilovich, D. Duffy, T. Lee, and D. N. Williams, 2018: Enabling Reanalysis Research Using the Collaborative Reanalysis Technical Environment (CREATE). Bulletin of the American Meteorological Society, 99, 677-687, doi:10.1175/bams-d-17-0174.1.
- Qin, M. H., D. L. Li, A. G. Dai, W. J. Hua, and H. D. Ma, 2018: The influence of the Pacific Decadal Oscillation on North Central China precipitation during boreal autumn. International Journal of Climatology, 38, E821-E831, doi:10.1002/joc.5410.
- Ramu, D. A., J. S. Chowdary, S. Ramakrishna, and O. Kumar, 2018: Diversity in the representation of large-scale circulation associated with ENSO-Indian summer monsoon teleconnections in CMIP5 models. Theoretical and Applied Climatology, 132, 465-478, doi:10.1007/s00704-017-2092-y.
- Ray, S., A. T. Wittenberg, S. M. Griffies, and F. R. Zeng, 2018: Understanding the Equatorial Pacific Cold Tongue Time-Mean Heat Budget. Part I: Diagnostic Framework. J. Clim., 31, 9965-9985, doi:10.1175/jcli-d-18-0152.1.
- Rikus, L., 2018: A simple climatology of westerly jet streams in global reanalysis datasets part 1: mid-latitude upper tropospheric jets. Climate Dynamics, 50, 2285-2310, doi:10.1007/s00382-015-2560-y.
- Rodrigues, D., M. C. Alvarez-Castro, G. Messori, P. Yiou, Y. Robin, and D. Faranda, 2018: Dynamical Properties of the North Atlantic Atmospheric Circulation in the Past 150 Years in CMIP5 Models and the 20CRv2c Reanalysis. J. Clim., 31, 6097-6111, doi:10.1175/jcli-d-17-0176.1.
- Rohrer, M., S. Bronnimann, O. Martius, C. C. Raible, M. Wild, and G. P. Compo, 2018: Representation of Extratropical Cyclones, Blocking Anticyclones, and Alpine Circulation Types in Multiple Reanalyses and Model Simulations. J. Clim., 31, 3009-3031, doi:10.1175/jcli-d-17-0350.1.
- Romps, D. M., A. B. Charn, R. H. Holzworth, W. E. Lawrence, J. Molinari, and D. Vollaro, 2018: CAPE Times P Explains Lightning Over Land But Not the Land-Ocean Contrast. Geophysical Research Letters, 45, 12623-12630, doi:10.1029/2018gl080267.
- Roy, I., 2018: Addressing on Abrupt Global Warming, Warming Trend Slowdown and Related Features in Recent Decades. Frontiers in Earth Science, 6, doi:10.3389/feart.2018.00136.
- Ruprich-Robert, Y., T. Delworth, R. Msadek, F. Castruccio, S. Yeager, and G. Danabasoglu, 2018: Impacts of the Atlantic Multidecadal Variability on North American Summer Climate and Heat Waves. J. Clim., 31, 3679-3700, doi:10.1175/jcli-d-17-0270.1.
- Sachindra, D. A., K. Ahmed, M. M. Rashid, S. Shahid, and B. J. C. Perera, 2018: Statistical downscaling of precipitation using machine learning techniques. Atmospheric Research, 212, 240-258, doi:10.1016/j.atmosres.2018.05.022.
- Sadikni, R., and Coauthors, 2018: The KLIWAS North Sea Climatology. Part I: Processing of the Atmospheric Data. Journal of Atmospheric and Oceanic Technology, 35, 111-126, doi:10.1175/jtech-d-17-0044.1.
- Salvatteci, R., and Coauthors, 2018: Multifarious anchovy and sardine regimes in the Humboldt Current System during the last 150 years. Global Change Biology, 24, 1055-1068, doi:10.1111/gcb.13991.
- Santamaria-Aguilar, S., and A. T. Vafeidis, 2018: Are Extreme Skew Surges Independent of High Water Levels in a Mixed Semidiurnal Tidal Regime? Journal of Geophysical Research-Oceans, 123, 8877-8886, doi:10.1029/2018jc014282.
- Santos, M., M. Fragoso, and J. A. Santos, 2018: Damaging flood severity assessment in Northern Portugal over more than 150 years (1865-2016). Natural Hazards, 91, 983-1002, doi:10.1007/s11069-017-3166-y.
- Saurral, R. I., F. J. Doblas-Reyes, and J. Garcia-Serrano, 2018: Observed modes of sea surface temperature variability in the South Pacific region. Climate Dynamics, 50, 1129-1143, doi:10.1007/s00382-017-3666-1.
- Schade, N. H., R. Sadikni, A. Jahnke-Bornemann, I. Hinrichs, L. Gates, B. Tinz, and D. Stammer, 2018: The KLIWAS North Sea Climatology. Part II: Assessment against Global Reanalyses. Journal of Atmospheric and Oceanic Technology, 35, 127-145, doi:10.1175/jtech-d-17-0045.1.
- Schneider, D. P., and R. L. Fogt, 2018: Artifacts in Century-Length Atmospheric and Coupled Reanalyses Over Antarctica Due To Historical Data Availability. Geophysical Research Letters, 45, 964-973, doi:10.1002/2017gl076226.
- Seim, A., and Coauthors, 2018: Evaluation of Tree Growth Relevant Atmospheric Circulation Patterns for Geopotential Height Field Reconstructions for Asia. J. Clim., 31, 4391-4401, doi:10.1175/jcli-d-17-0164.1.
- Sherin, V. R., F. Durand, V. V. Gopalkrishna, S. Anuvinda, A. V. S. Chaitanya, R. Bourdalle-Badie, and F. Papa, 2018: Signature of Indian Ocean Dipole on the western boundary current of the Bay of Bengal. Deep-Sea Research Part I-Oceanographic Research Papers, 136, 91-106, doi:10.1016/j.dsr.2018.04.002.
- Shields, C. A., and Coauthors, 2018: Atmospheric River Tracking Method Intercomparison Project (ARTMIP): project goals and experimental design. Geoscientific Model Development, 11, 2455-2474, doi:10.5194/gmd-11-2455-2018.
- Shin, S. J., and S. I. An, 2018: Interdecadal Change in the Relationship Between the North Pacific Oscillation and the Pacific Meridional Mode and Its Impact on ENSO. Asia-Pacific Journal of Atmospheric Sciences, 54, 63-76, doi:10.1007/s13143-017-0060-1.
- Shu, Q., F. L. Qiao, Z. Y. Song, and Y. J. Song, 2018: Link between the Barents Oscillation and recent boreal winter cooling over the Asian midlatitudes. Advances in Atmospheric Sciences, 35, 127-132, doi:10.1007/s00376-017-7021-6.
- Simpson, I. R., C. Deser, K. A. McKinnon, and E. A. Barnes, 2018: Modeled and Observed Multidecadal Variability in the North Atlantic Jet Stream and Its Connection to Sea Surface Temperatures. J. Clim., 31, 8313-8338, doi:10.1175/jcli-d-18-0168.1.
- Sjolte, J., C. Sturm, F. Adolphi, B. M. Vinther, M. Werner, G. Lohmann, and R. Muscheler, 2018: Solar and volcanic forcing of North Atlantic climate inferred from a process-based reconstruction. Climate of the Past, 14, 1179-1194, doi:10.5194/cp-14-1179-2018.
- Skliris, N., J. D. Zika, L. Herold, S. A. Josey, and R. Marsh, 2018: Mediterranean sea water budget long-term trend inferred from salinity observations. Climate Dynamics, 51, 2857-2876, doi:10.1007/s00382-017-4053-7.
- Slivinski, L. C., 2018: Historical Reanalysis: What, How, and Why? Journal of Advances in Modeling Earth Systems, 10, 1736-1739, doi:10.1029/2018ms001434.
- Song, X. S., Y. M. Tang, and D. K. Chen, 2018: Decadal Variation in IOD Predictability During 1881-2016. Geophysical Research Letters, 45, 12948-12956, doi:10.1029/2018gl080221.
- Soon, W. W. H., and Coauthors, 2018: Comparing the current and early 20th century warm periods in China. Earth-Science Reviews, 185, 80-101, doi:10.1016/j.earscirev.2018.05.013.
- Srinivas, G., J. S. Chowdary, Y. Kosaka, C. Gnanaseelan, A. Parekh, and K. Prasad, 2018: Influence of the Pacific-Japan Pattern on Indian Summer Monsoon Rainfall. J. Clim., 31, 3943-3958, doi:10.1175/jcli-d-17-0408.1.
- Staehelin, J., P. Viatte, R. Stubi, F. Tummon, and T. Peter, 2018: Stratospheric ozone measurements at Arosa (Switzerland): history and scientific relevance. Atmospheric Chemistry and Physics, 18, 6567-6584, doi:10.5194/acp-18-6567-2018.
- Steinig, S., J. Harlass, W. Park, and M. Latif, 2018: Sahel rainfall strength and onset improvements due to more realistic Atlantic cold tongue development in a climate model. Scientific Reports, 8, doi:10.1038/s41598-018-20904-1.
- Steinschneider, S., M. Ho, A. P. Williams, E. R. Cook, and U. Lall, 2018: A 500-Year Tree Ring-Based Reconstruction of Extreme Cold-Season Precipitation and Number of Atmospheric River Landfalls Across the Southwestern United States. Geophysical Research Letters, 45, 5672-5680, doi:10.1029/2018gl078089.
- Stopa, J. E., 2018: Wind forcing calibration and wave hindcast comparison using multiple reanalysis and merged satellite wind datasets. Ocean Modelling, 127, 55-69, doi:10.1016/j.ocemod.2018.04.008.
- Stucki, P., and Coauthors, 2018: Reconstruction and simulation of an extreme flood event in the Lago Maggiore catchment in 1868. Natural Hazards and Earth System Sciences, 18, 2717-2739, doi:10.5194/nhess-18-2717-2018.
- Sun, Q. H., C. Y. Miao, Q. Y. Duan, H. Ashouri, S. Sorooshian, and K. L. Hsu, 2018: A Review of Global Precipitation Data Sets: Data Sources, Estimation, and Intercomparisons. Reviews of Geophysics, 56, 79-107, doi:10.1002/2017rg000574.
- Sung, M. K., S. H. Kim, B. M. Kim, and Y. S. Choi, 2018: Interdecadal Variability of the Warm Arctic and Cold Eurasia Pattern and Its North Atlantic Origin. J. Clim., 31, 5793-5810, doi:10.1175/jcli-d-17-0562.1.
- Svarva, H. L., T. Thun, A. J. Kirchhefer, and A. Nesje, 2018: Little Ice Age summer temperatures in western Norway from a 700-year tree-ring chronology. Holocene, 28, 1609-1622, doi:10.1177/0959683618782611.
- Svendsen, L., N. Keenlyside, I. Bethke, Y. Q. Gao, and N. E. Omrani, 2018: Pacific contribution to the early twentieth-century warming in the Arctic. Nature Climate Change, 8, 793-+, doi:10.1038/s41558-018-0247-1.
- Tabari, H., and P. Willems, 2018: Lagged influence of Atlantic and Pacific climate patterns on European extreme precipitation. Scientific Reports, 8, doi:10.1038/s41598-018-24069-9.
- Tahir, Z. R., and M. Asim, 2018: Surface measured solar radiation data and solar energy resource assessment of Pakistan: A review. Renewable & Sustainable Energy Reviews, 81, 2839-2861, doi:10.1016/j.rser.2017.06.090. Tahir, Z. U., and Coauthors, 2018: Comparison of Reanalysis, Analysis and Forecast datasets with measured wind data for a Wind Power Project in Jhimpir, Pakistan. Windeurope Conference 2018 within the Global Wind Summit, M. Muskulus, and C. L. Bottasso, Eds.
- Thomas, Z., and Coauthors, 2018: A New Daily Observational Record from Grytviken, South Georgia: Exploring Twentieth-Century Extremes in the South Atlantic. J. Clim., 31, 1743-1755, doi:10.1175/jcli-d-17-0353.1.
- Tian, Z. P., T. Li, and D. B. Jiang, 2018: Strengthening and Westward Shift of the Tropical Pacific Walker Circulation during the Mid-Holocene: PMIP Simulation Results. J. Clim., 31, 2283-2298, doi:10.1175/jcli-d-16-0744.1.
- Tifafi, M., B. Guenet, and C. Hatte, 2018: Large Differences in Global and Regional Total Soil Carbon Stock Estimates Based on SoilGrids, HWSD, and NCSCD: Intercomparison and Evaluation Based on Field Data From USA, England, Wales, and France. Global Biogeochemical Cycles, 32, 42-56, doi:10.1002/2017gb005678.
- Toride, K., D. L. Cawthorne, K. Ishida, M. L. Kavvas, and M. L. Anderson, 2018: Long-term trend analysis on total and extreme precipitation over Shasta Dam watershed. Science of the Total Environment, 626, 244-254, doi:10.1016/j.scitotenv.2018.01.004.
- Troccoli, A., and Coauthors, 2018: Creating a proof-of-concept climate service to assess future renewable energy mixes in Europe: An overview of the C3S ECEM project. Advances in Science and Research, 15, 191-205, doi:10.5194/asr-15-191-2018.
- Trouet, V., F. Babst, and M. Meko, 2018: Recent enhanced high-summer North Atlantic Jet variability emerges from three-century context. Nature Communications, 9, doi:10.1038/s41467-017-02699-3.
- Tsujino, H., and Coauthors, 2018: JRA-55 based surface dataset for driving ocean-sea-ice models (JRA55-do). Ocean Modelling, 130, 79-139, doi:10.1016/j.ocemod.2018.07.002.
- Tuovinen, J. P., P. Jokinen, and D. M. Schultz, 2018: Historical hail cases in Finland: 1776-1910. Boreal Environment Research, 23, 29-57, doi:Turkes, M., and E. Erlat, 2018: Variability and trends in record air temperature events of Turkey and their associations with atmospheric oscillations and anomalous circulation patterns. International Journal of Climatology, 38, 5182-5204, doi:10.1002/joc.5720.
- Ulazia, A., M. Penalba, A. Rabanal, G. Ibarra-Berastegi, J. Ringwood, and J. Saenz, 2018: Historical Evolution of the Wave Resource and Energy Production off the Chilean Coast over the 20th Century. Energies, 11, doi:10.3390/en11092289.
- Ummenhofer, C. C., M. Kuluke, and J. E. Tierney, 2018: Extremes in East African hydroclimate and links to Indo-Pacific variability on interannual to decadal timescales. Climate Dynamics, 50, 2971-2991, doi:10.1007/s00382-017-3786-7.
- Undorf, S., D. Polson, M. A. Bollasina, Y. Ming, A. Schurer, and G. C. Hegerl, 2018: Detectable Impact of Local and Remote Anthropogenic Aerosols on the 20th Century Changes of West African and South Asian Monsoon Precipitation. Journal of Geophysical Research-Atmospheres, 123, 4871-4889, doi:10.1029/2017jd027711.
- Vega, I., D. Gallego, P. Ribera, F. D. Gomez-Delgado, R. Garcia-Herrera, and C. Pena-Ortiz, 2018: Reconstructing the Western North Pacific Summer Monsoon since the Late Nineteenth Century. J. Clim., 31, 355-368, doi:10.1175/jcli-d-17-0336.1.
- Verdon-Kidd, D. C., 2018: On the classification of different flavours of Indian Ocean Dipole events. International Journal of Climatology, 38, 4924-4937, doi:10.1002/joc.5707.
- Villamayor, J., T. Ambrizzi, and E. Mohino, 2018: Influence of decadal sea surface temperature variability on northern Brazil rainfall in CMIP5 simulations. Climate Dynamics, 51, 563-579, doi:10.1007/s00382-017-3941-1.
- Walker, A. P., and Coauthors, 2018: The multi-assumption architecture and testbed (MAAT v1.0): R code for generating ensembles with dynamic model structure and analysis of epistemic uncertainty from multiple sources. Geoscientific Model Development, 11, 3159-3185, doi:10.5194/gmd-11-3159-2018.
- Walz, M. A., D. J. Befort, N. O. Kirchner-Bossi, U. Ulbrich, and G. C. Leckebusch, 2018: Modelling serial clustering and inter-annual variability of European winter windstorms based on large-scale drivers. International Journal of Climatology, 38, 3044-3057, doi:10.1002/joc.5481.
- Wang, B., and Coauthors, 2018: Toward Predicting Changes in the Land Monsoon Rainfall a Decade in Advance. J. Clim., 31, 2699-2714, doi:10.1175/jcli-d-17-0521.1.
- Wang, X., W. Tan, and C. Z. Wang, 2018: A new index for identifying different types of El Nino Modoki events. Climate Dynamics, 50, 2753-2765, doi:10.1007/s00382-017-3769-8.
- Ward, D. S., E. Shevliakova, S. Malyshev, and S. Rabin, 2018: Trends and Variability of Global Fire Emissions Due To Historical Anthropogenic Activities. Global Biogeochemical Cycles, 32, 122-142, doi:10.1002/2017gb005787.
- Wares, J. P., S. Crickenberger, A. F. Govindarajan, J. L. Hamrick, K. M. Skoczen, D. W. Trapnell, and D. S. Wethey, 2018: The cryptic population biology of Chthamalus fragilis Darwin, 1854 (Cirripedia, Thoracica) on the Atlantic coast of North America. Journal of Crustacean Biology, 38, 754-764, doi:10.1093/jcbiol/ruy070.
- Wilcox, L. J., and Coauthors, 2018: Multiple perspectives on the attribution of the extreme European summer of 2012 to climate change. Climate Dynamics, 50, 3537-3555, doi:10.1007/s00382-017-3822-7.
- Williamson, F., and Coauthors, 2018: Collating Historic Weather Observations for the East Asian Region: Challenges, Solutions, and Reanalyses. Advances in Atmospheric Sciences, 35, 899-904, doi:10.1007/s00376-017-7259-z.
- Willis, D. M., and Coauthors, 2018: Sunspot Observations on 10 and 11 February 1917: A Case Study in Collating Known and Previously Undocumented Records. Space Weather-the International Journal of Research and Applications, 16, 1740-1752, doi:10.1029/2018sw002012.
- Wills, R. C., T. Schneider, J. M. Wallace, D. S. Battisti, and D. L. Hartmann, 2018: Disentangling Global Warming, Multidecadal Variability, and El Nino in Pacific Temperatures. Geophysical Research Letters, 45, 2487-2496, doi:10.1002/2017gl076327.
- Wise, E. K., C. A. Woodhouse, G. J. McCabe, G. T. Pederson, and J. M. St-Jacques, 2018: Hydroclimatology of the Missouri River Basin. Journal of Hydrometeorology, 19, 161-182, doi:10.1175/jhm-d-17-0155.1.
- Woodworth, P. L., 2018: Sea level change in Great Britain between 1859 and the present. Geophysical Journal International, 213, 222-236, doi:10.1093/gji/ggx538.
- Woollings, T., and Coauthors, 2018: Daily to Decadal Modulation of Jet Variability. J. Clim., 31, 1297-1314, doi:10.1175/jcli-d-17-0286.1.
- Wyard, C., S. Doutreloup, A. Belleflamme, M. Wild, and X. Fettweis, 2018: Global Radiative Flux and Cloudiness Variability for the Period 1959-2010 in Belgium: A Comparison between Reanalyses and the Regional Climate Model MAR. Atmosphere, 9, doi:10.3390/atmos9070262.
- Xiao, F., L. L. Zeng, Q. Y. Liu, W. Zhou, and D. X. Wang, 2018: Extreme subsurface warm events in the South China Sea during 1998/99 and 2006/07: observations and mechanisms. Climate Dynamics, 50, 115-128, doi:10.1007/s00382-017-3588-y.
- Xue, J. Q., C. Sun, J. P. Li, and J. Y. Mao, 2018: South Atlantic Forced Multidecadal Teleconnection to the Midlatitude South Indian Ocean. Geophysical Research Letters, 45, 8480-8489, doi:10.1029/2018gl078990.
- Yang, M. H., R. T. Zuo, L. Q. Wang, and X. Chen, 2018: A Simulation Study of Global Evapotranspiration Components Using the Community Land Model. Atmosphere, 9, doi:10.3390/atmos9050178.
- Yao, Y., Z. Zhong, and X. Q. Yang, 2018: Impacts of the subarctic frontal zone on the North Pacific storm track in the cold season: an observational study. International Journal of Climatology, 38, 2554-2564, doi:10.1002/joc.5429.
- Yao, Y., Z. Zhong, and X. Q. Yang, 2018: Influence of the subarctic front intensity on the midwinter suppression of the North Pacific storm track. Dynamics of Atmospheres and Oceans, 81, 63-72, doi:10.1016/j.dynatmoce.2018.01.001.
- Ye, X. C., Z. W. Wu, Z. M. Wang, H. Y. Shen, and J. M. Xu, 2018: Seasonal Prediction of the Yangtze River Runoff Using a Partial Least Squares Regression Model. Atmosphere-Ocean, 56, 117-128, doi:10.1080/07055900.2018.1448751.
- Yeager, S. G., and Coauthors, 2018: PREDICTING NEAR-TERM CHANGES IN THE EARTH SYSTEM A Large Ensemble of Initialized Decadal Prediction Simulations Using the Community Earth System Model. Bulletin of the American Meteorological Society, 99, 1867-1886, doi:10.1175/bams-d-17-0098.1.
- Yin, Z., and Coauthors, 2018: Evaluation of ORCHIDEE-MICT-simulated soil moisture over China and impacts of different atmospheric forcing data. Hydrology and Earth System Sciences, 22, 5463-5484, doi:10.5194/hess-22-5463-2018.
- Yiou, P., J. Cattiaux, A. Ribes, R. Vautard, and M. Vrac, 2018: Recent Trends in the Recurrence of North Atlantic Atmospheric Circulation Patterns. Complexity, doi:10.1155/2018/3140915.
- You, Y. J., and J. C. Furtado, 2018: The South Pacific Meridional Mode and Its Role in Tropical Pacific Climate Variability. J. Clim., 31, 10141-10163, doi:10.1175/jcli-d-17-0860.1.
- Yu, L. J., S. Y. Zhong, W. E. Heilman, and X. D. Bian, 2018: Trends in seasonal warm anomalies across the contiguous United States: Contributions from natural climate variability. Scientific Reports, 8, doi:10.1038/s41598-018-21817-9.
- Zhang, L., B. L. Gan, L. X. Wu, W. J. Cai, and H. Ma, 2018: Seasonal Dependence of Coupling between Storm Tracks and Sea Surface Temperature in the Southern Hemisphere Midlatitudes: A Statistical Assessment. J. Clim., 31, 4055-4074, doi:10.1175/jcli-d-17-0196.1.
- Zhang, L., and W. Q. Han, 2018: Impact of Ningaloo Nino on Tropical Pacific and an Interbasin Coupling Mechanism. Geophysical Research Letters, 45, 11300-11309, doi:10.1029/2018gl078579.
- Zhang, Q., Z. Y. Guan, and M. G. Li, 2018: The Eurasia-North Pacific Oscillation in atmospheric mass variations independent of both IHO and AO and its possible impacts on winter climate. Climate Dynamics, 50, 4303-4322, doi:10.1007/s00382-017-3876-6.
- Zhang, W. X., and Coauthors, 2018: Multiscale Variations of Precipitable Water over China Based on 1999-2015 Ground-Based GPS Observations and Evaluations of Reanalysis Products. J. Clim., 31, 945-962, doi:10.1175/jcli-d-17-0419.1.
- Zhang, Y. F., Y. Guo, W. J. Dong, and C. X. Li, 2018: What drives the decadal variation of global land monsoon precipitation over the past 50 years? International Journal of Climatology, 38, 4818-4829, doi:10.1002/joc.5699.
- Zhang, Y. L., Y. T. Wang, B. J. Huai, M. H. Ding, and W. J. Sun, 2018: Skill of the two 20th century reanalyses in representing Antarctic near-surface air temperature. International Journal of Climatology, 38, 4225-4238, doi:10.1002/joc.5563.
- Zhang, Z. R., P. Uotila, A. Stossel, T. Vihma, H. L. Liu, and Y. S. Zhong, 2018: Seasonal southern hemisphere multi-variable reflection of the southern annular mode in atmosphere and ocean reanalyses. Climate Dynamics, 50, 1451-1470, doi:10.1007/s00382-017-3698-6.
- Zhao, L., B. Han, S. H. Lv, L. J. Wen, X. H. Meng, and Z. G. Li, 2018: The different influence of the residual layer on the development of the summer convective boundary layer in two deserts in northwest China. Theoretical and Applied Climatology, 131, 877-888, doi:10.1007/s00704-016-2014-4.
- Zheng, J., Q. Y. Liu, and C. Y. Wang, 2018: An aftereffect of global warming on tropical Pacific decadal variability. Journal of Oceanology and Limnology, 36, 193-204, doi:10.1007/s00343-017-6267-2.
- Zheng, M. J., J. Sjolte, F. Adolphi, B. M. Vinther, H. C. Steen-Larsen, T. J. Popp, and R. Muscheler, 2018: Climate information preserved in seasonal water isotope at NEEM: relationships with temperature, circulation and sea ice. Climate of the Past, 14, 1067-1078, doi:10.5194/cp-14-1067-2018.
- Zhou, C. L., Y. Y. He, and K. C. Wang, 2018: On the suitability of current atmospheric reanalyses for regional warming studies over China. Atmospheric Chemistry and Physics, 18, 8113-8136, doi:10.5194/acp-18-8113-2018.
2017
- Achuthavarier, D., S. D. Schubert, and Y. V. Vikhliaev, 2017: North Pacific decadal variability: insights from a biennial ENSO environment. Climate Dynamics, 49, 1379-1397, doi:10.1007/s00382-016-3391-1.
- Agnihotri, R., A. P. Dimri, H. M. Joshi, N. K. Verma, C. Sharma, J. Singh, and Y. P. Sundriyal, 2017: Assessing operative natural and anthropogenic forcing factors from long-term climate time series of Uttarakhand (India) in the backdrop of recurring extreme rainfall events over northwest Himalaya. Geomorphology, 284, 31-40, doi:10.1016/j.geomorph.2016.10.024.
- Allen, R. J., and M. Kovilakam, 2017: The Role of Natural Climate Variability in Recent Tropical Expansion. J. Clim., 30, 6329-6350, doi:10.1175/jcli-d-16-0735.1.
- Anderson, B. T., J. C. Furtado, E. Di Lorenzo, and D. J. S. Gianotti, 2017: Tracking the Pacific Decadal Precession. Journal of Geophysical Research-Atmospheres, 122, 3214-3227, doi:10.1002/2016jd025962.
- Andreadis, K. M., G. J. P. Schumann, D. Stampoulis, P. D. Bates, G. R. Brakenridge, and A. J. Kettner, 2017: Can Atmospheric Reanalysis Data Sets Be Used to Reproduce Flooding Over Large Scales? Geophysical Research Letters, 44, 10369-10377, doi:10.1002/2017gl075502.
- Andreoli, R. V., S. N. R. da Silva, R. A. F. de Souza, M. T. Kayano, S. R. Garcia, V. B. Capistrano, and E. Armijos, 2017: Intense drought and flooding events in the Rio Negro and relation with the tropical Pacific and Atlantic variability modes. Theoretical and Applied Climatology, 129, 551-576, doi:10.1007/s00704-016-1790-1.
- Andreoli, R. V., S. S. de Oliveira, M. T. Kayano, J. Viegas, R. A. F. de Souza, and L. A. Candido, 2017: The influence of different El Nino types on the South American rainfall. International Journal of Climatology, 37, 1374-1390, doi:10.1002/joc.4783.
- Andreu-Hayles, L., and Coauthors, 2017: 400 Years of summer hydroclimate from stable isotopes in Iberian trees. Climate Dynamics, 49, 143-161, doi:10.1007/s00382-016-3332-z.
- Arns, A., S. Dangendorf, J. Jensen, S. Talke, J. Bender, and C. Pattiaratchi, 2017: Sea-level rise induced amplification of coastal protection design heights. Scientific Reports, 7, doi:10.1038/srep40171.
- Aubry, T. J., A. M. Jellinek, G. Carazzo, R. Gallo, K. Hatcher, and J. Dunning, 2017: A new analytical scaling for turbulent wind-bent plumes: Comparison of scaling laws with analog experiments and a new database of eruptive conditions for predicting the height of volcanic plumes. Journal of Volcanology and Geothermal Research, 343, 233-251, doi:10.1016/j.jvolgeores.2017.07.006.
- Azad, R., and A. Sorteberg, 2017: Extreme daily precipitation in coastal western Norway and the link to atmospheric rivers. Journal of Geophysical Research-Atmospheres, 122, 2080-2095, doi:10.1002/2016jd025615.
- Barcikowska, M., F. Feser, W. Zhang, and W. Mei, 2017: Changes in intense tropical cyclone activity for the western North Pacific during the last decades derived from a regional climate model simulation. Climate Dynamics, 49, 2931-2949, doi:10.1007/s00382-016-3420-0.
- Barcikowska, M. J., T. R. Knutson, and R. Zhang, 2017: Observed and Simulated Fingerprints of Multidecadal Climate Variability and Their Contributions to Periods of Global SST Stagnation. J. Clim., 30, 721-737, doi:10.1175/jcli-d-16-0443.1.
- Barnes, E. A., and I. R. Simpson, 2017: Seasonal Sensitivity of the Northern Hemisphere Jet Streams to Arctic Temperatures on Subseasonal Time Scales. J. Clim., 30, 10117-10137, doi:10.1175/jcli-d-17-0299.1.
- Barth, N. A., G. Villarini, M. A. Nayak, and K. White, 2017: Mixed populations and annual flood frequency estimates in the western United States: The role of atmospheric rivers. Water Resources Research, 53, 257-269, doi:10.1002/2016wr019064.
- Bartoszek, K., S. Wereski, A. Krzyzewska, and M. Dobek, 2017: The influence of atmospheric circulation on bioclimatic conditions in Lublin (Poland). Bulletin of Geography-Physical Geography Series, 12, 41-49, doi:10.1515/bgeo-2017-0004.
- Belmecheri, S., F. Babst, A. R. Hudson, J. Betancourt, and V. Trouet, 2017: Northern Hemisphere Jet Stream Position Indices as Diagnostic Tools for Climate and Ecosystem Dynamics. Earth Interactions, 21, 1-23, doi:10.1175/ei-d-16-0023.1.
- Berry, D. I., and E. C. Kent, 2017: Assessing the health of the in situ global surface marine climate observing system. International Journal of Climatology, 37, 2248-2259, doi:10.1002/joc.4914.
- Bett, P. E., H. E. Thornton, and R. T. Clark, 2017: Using the Twentieth Century Reanalysis to assess climate variability for the European wind industry. Theoretical and Applied Climatology, 127, 61-80, doi:10.1007/s00704-015-1591-y.
- Bierstedt, S. E., B. Hunicke, E. Zorita, and J. Ludwig, 2017: A wind proxy based on migrating dunes at the Baltic coast: statistical analysis of the link between wind conditions and sand movement. Earth System Dynamics, 8, 639-652, doi:10.5194/esd-8-639-2017.
- Bischoff, T., T. Schneider, and A. N. Meckler, 2017: A Conceptual Model for the Response of Tropical Rainfall to Orbital Variations. J. Clim., 30, 8375-8391, doi:10.1175/jcli-d-16-0691.1.
- Bonnet, R., J. Bae, G. Dayon, and E. Martin, 2017: Twentieth-Century Hydrometeorological Reconstructions to Study the Multidecadal Variations of the Water Cycle Over France. Water Resources Research, 53, 8366-8382, doi:10.1002/2017wr020596.
- Bordbar, M. H., T. Martin, M. Latif, and W. Park, 2017: Role of internal variability in recent decadal to multidecadal tropical Pacific climate changes. Geophysical Research Letters, 44, 4246-4255, doi:10.1002/2016gl072355.
- Borodina, A., E. M. Fischer, and R. Knutti, 2017: Potential to Constrain Projections of Hot Temperature Extremes. J. Clim., 30, 9949-9964, doi:10.1175/jcli-d-16-0848.1.
- Bosilovich, M. G., F. R. Robertson, L. Takacs, A. Molod, and D. Mocko, 2017: Atmospheric Water Balance and Variability in the MERRA-2 Reanalysis. J. Clim., 30, 1177-1196, doi:10.1175/jcli-d-16-0338.1.
- Boucher, E., A. Nicault, D. Arseneault, Y. Begin, and M. P. Karami, 2017: Decadal Variations in Eastern Canada's Taiga Wood Biomass Production Forced by Ocean-Atmosphere Interactions. Scientific Reports, 7, doi:10.1038/s41598-017-02580-9.
- Brands, S., J. M. Gutierrez, and D. San-Martin, 2017: Twentieth-century atmospheric river activity along the west coasts of Europe and North America: algorithm formulation, reanalysis uncertainty and links to atmospheric circulation patterns. Climate Dynamics, 48, 2771-2795, doi:10.1007/s00382-016-3095-6.
- Brazdil, R., and Coauthors, 2017: The extraordinary windstorm of 7 December 1868 in the Czech Lands and its central European context. International Journal of Climatology, 37, 14-29, doi:10.1002/joc.4973.
- Breivik, O., and O. J. Aarnes, 2017: Efficient bootstrap estimates for tail statistics. Natural Hazards and Earth System Sciences, 17, 357-366, doi:10.5194/nhess-17-357-2017.
- Bronnimann, S., and Coauthors, 2017: Tropical circulation and precipitation response to ozone depletion and recovery. Environmental Research Letters, 12, doi:10.1088/1748-9326/aa7416.
- Butler, A. H., J. P. Sjoberg, D. J. Seidel, and K. H. Rosenlof, 2017: A sudden stratospheric warming compendium. Earth System Science Data, 9, 63-76, doi:10.5194/essd-9-63-2017.
- Caillouet, L., J. P. Vidal, E. Sauquet, A. Devers, and B. Graff, 2017: Ensemble reconstruction of spatio-temporal extreme low-flow events in France since 1871. Hydrology and Earth System Sciences, 21, 2923-2951, doi:10.5194/hess-21-2923-2017.
- Cao, B., S. Gruber, and T. J. Zhang, 2017: REDCAPP (v1.0): parameterizing valley inversions in air temperature data downscaled from reanalyses. Geoscientific Model Development, 10, 2905-2923, doi:10.5194/gmd-10-2905-2017.
- Carella, G., E. C. Kent, and D. I. Berry, 2017: A probabilistic approach to ship voyage reconstruction in ICOADS. International Journal of Climatology, 37, 2233-2247, doi:10.1002/joc.4492.
- Carella, G., and Coauthors, 2017: Measurements and models of the temperature change of water samples in sea-surface temperature buckets. Quarterly Journal of the Royal Meteorological Society, 143, 2198-2209, doi:10.1002/qj.3078.
- Carrillo, C. M., C. L. Castro, H. I. Chang, and T. M. Luong, 2017: Multi-year climate variability in the Southwestern United States within a context of a dynamically downscaled twentieth century reanalysis. Climate Dynamics, 49, 4217-4236, doi:10.1007/s00382-017-3569-1.
- Cerrone, D., G. Fusco, Y. Cotroneo, I. Simmonds, and G. Budillon, 2017: The Antarctic Circumpolar Wave: Its Presence and Interdecadal Changes during the Last 142 Years. J. Clim., 30, 6371-6389, doi:10.1175/jcli-d-16-0646.1.
- Choi, Y. W., and J. B. Ahn, 2017: The Effect of Boreal Late Autumn Snow Cover over Western and Central China on the Northern Hemisphere Wintertime Blocking Frequency. J. Clim., 30, 9027-9039, doi:10.1175/jcli-d-16-0830.1.
- Chowdary, J. S., H. S. Harsha, C. Gnanaseelan, G. Srinivas, A. Parekh, P. Pillai, and C. V. Naidu, 2017: Indian summer monsoon rainfall variability in response to differences in the decay phase of El Nio. Climate Dynamics, 48, 2707-2727, doi:10.1007/s00382-016-3233-1.
- Christensen, H. M., J. Berner, D. R. B. Coleman, and T. N. Palmer, 2017: Stochastic Parameterization and El Nino-Southern Oscillation. J. Clim., 30, 17-38, doi:10.1175/jcli-d-16-0122.1.
- Christiansen, B., and F. C. Ljungqvist, 2017: Challenges and perspectives for large-scale temperature reconstructions of the past two millennia. Reviews of Geophysics, 55, 40-96, doi:10.1002/2016rg000521.
- Cialone, M. A., A. S. Grzegorzewski, D. J. Mark, M. A. Bryant, and T. C. Massey, 2017: Coastal-Storm Model Development and Water-Level Validation for the North Atlantic Coast Comprehensive Study. Journal of Waterway Port Coastal and Ocean Engineering, 143, doi:10.1061/(asce)ww.1943-5460.0000408.
- Cid, A., P. Camus, S. Castanedo, F. J. Mendez, and R. Medina, 2017: Global reconstructed daily surge levels from the 20th Century Reanalysis (1871-2010). Global and Planetary Change, 148, 9-21, doi:10.1016/j.gloplacha.2016.11.006.
- Cieslikiewicz, W., A. Dudkowska, G. Gic-Grusza, and J. Jedrasik, 2017: Extreme bottom velocities induced by wind wave and currents in the Gulf of GdaA"sk. Ocean Dynamics, 67, 1461-1480, doi:10.1007/s10236-017-1098-4.
- Conroy, J. L., A. M. Hudson, J. T. Overpeck, K. B. Liu, L. Wang, and J. E. Cole, 2017: The primacy of multidecadal to centennial variability over late-Holocene forced change of the Asian Monsoon on the southern Tibetan Plateau. Earth and Planetary Science Letters, 458, 337-348, doi:10.1016/j.epsl.2016.10.044.
- Cornes, R. C., P. D. Jones, and C. Qian, 2017: Twentieth-Century Trends in the Annual Cycle of Temperature across the Northern Hemisphere. J. Clim., 30, 5755-5773, doi:10.1175/jcli-d-16-0315.1.
- Correa, S. W., R. C. D. de Paiva, J. C. Espinoza, and W. Collischonn, 2017: Multi-decadal Hydrological Retrospective: Case study of Amazon floods and droughts. Journal of Hydrology, 549, 667-684, doi:10.1016/j.jhydrol.2017.04.019. Coumou, D., K. Kornhuber, J. Lehmann, and V. Petoukhov, 2017: Weakened Flow, Persistent Circulation, and Prolonged Weather Extremes in Boreal Summer. Climate Extremes: Patterns and Mechanisms, S. Y. S. Wang, J. H. Yoon, C. C. Funk, and R. R. Gillies, Eds., 61-73.
- Cowan, T., G. C. Hegerl, I. Colfescu, M. Bollasina, A. Purich, and G. Boschat, 2017: Factors Contributing to Record-Breaking Heat Waves over the Great Plains during the 1930s Dust Bowl. J. Clim., 30, 2437-2461, doi:10.1175/jcli-d-16-0436.1.
- Cradden, L. C., F. McDermott, L. Zubiate, C. Sweeney, and M. O'Malley, 2017: A 34-year simulation of wind generation potential for Ireland and the impact of large-scale atmospheric pressure patterns. Renewable Energy, 106, 165-176, doi:10.1016/j.renene.2016.12.079.
- Cui, W. J., X. Q. Dong, B. K. Xi, and A. Kennedy, 2017: Evaluation of Reanalyzed Precipitation Variability and Trends Using the Gridded Gauge-Based Analysis over the CONUS. Journal of Hydrometeorology, 18, 2227-2248, doi:10.1175/jhm-d-17-0029.1.
- D'Agostino, R., and P. Lionello, 2017: Evidence of global warming impact on the evolution of the Hadley Circulation in ECMWF centennial reanalyses. Climate Dynamics, 48, 3047-3060, doi:10.1007/s00382-016-3250-0. Dafka, S., A. Toreti, J. Luterbacher, P. Zanis, E. Tyrlis, and E. Xoplaki, 2017: Do RCMs Accurately Simulate the Etesians Climatology? Perspectives on Atmospheric Sciences, T. S. Karacostas, A. F. Bais, and P. T. Nastos, Eds., 591-597.
- Dai, A. G., and T. B. Zhao, 2017: Uncertainties in historical changes and future projections of drought. Part I: estimates of historical drought changes. Climatic Change, 144, 519-533, doi:10.1007/s10584-016-1705-2.
- Dai, N., and P. A. Arkin, 2017: Twentieth century ENSO-related precipitation mean states in twentieth century reanalysis, reconstructed precipitation and CMIP5 models. Climate Dynamics, 48, 3061-3083, doi:10.1007/s00382-016-3251-z.
- Dangendorf, S., M. Marcos, G. Woppelmannc, C. P. Conrad, T. Frederikse, and R. Riva, 2017: Reassessment of 20th century global mean sea level rise. Proceedings of the National Academy of Sciences of the United States of America, 114, 5946-5951, doi:10.1073/pnas.1616007114.
- Dannenberg, M. P., and E. K. Wise, 2017: Shifting Pacific storm tracks as stressors to ecosystems of western North America. Global Change Biology, 23, 4896-4906, doi:10.1111/gcb.13748.
- Davis, J. L., and N. T. Vinogradova, 2017: Causes of accelerating sea level on the East Coast of North America. Geophysical Research Letters, 44, 5133-5141, doi:10.1002/2017gl072845.
- Deser, C., J. W. Hurrell, and A. S. Phillips, 2017: The role of the North Atlantic Oscillation in European climate projections. Climate Dynamics, 49, 3141-3157, doi:10.1007/s00382-016-3502-z.
- DiNezio, P. N., and Coauthors, 2017: A 2 Year Forecast for a 60-80% Chance of La Nina in 2017-2018. Geophysical Research Letters, 44, 11624-11635, doi:10.1002/2017gl074904.
- Ding, S. Y., W. Chen, J. Feng, and H. F. Graf, 2017: Combined Impacts of PDO and Two Types of La Nina on Climate Anomalies in Europe. J. Clim., 30, 3253-3278, doi:10.1175/jcli-d-16-0376.1.
- Diouf, I., and Coauthors, 2017: Comparison of Malaria Simulations Driven by Meteorological Observations and Reanalysis Products in Senegal. International Journal of Environmental Research and Public Health, 14, doi:10.3390/ijerph14101119.
- Dixon, B. C., J. J. Tyler, A. M. Lorrey, I. D. Goodwin, J. Gergis, and R. N. Drysdale, 2017: Low-resolution Australasian palaeoclimate records of the last 2000 years. Climate of the Past, 13, 1403-1433, doi:10.5194/cp-13-1403-2017.
- Dominguez-Castro, F., and Coauthors, 2017: Early meteorological records from Latin-America and the Caribbean during the 18th and 19th centuries. Scientific Data, 4, doi:10.1038/sdata.2017.169.
- Douville, H., Y. Peings, and D. Saint-Martin, 2017: Snow-(N)AO relationship revisited over the whole twentieth century. Geophysical Research Letters, 44, 569-577, doi:10.1002/2016gl071584.
- Etling, D., 2017: Meteorological aspects of Salomon August Andree's attempt to reach the North Pole by balloon in 1897 based on 20CR data. Meteorologische Zeitschrift, 26, 567-580, doi:10.1127/metz/2017/0853.
- Eyre, J., and X. B. Zeng, 2017: Evaluation of Greenland near surface air temperature datasets. Cryosphere, 11, 1591-1605, doi:10.5194/tc-11-1591-2017.
- Fan, F. X., X. Dong, X. H. Fang, F. Xue, F. Zheng, and J. Zhu, 2017: Revisiting the relationship between the South Asian summer monsoon drought and El Nino warming pattern. Atmospheric Science Letters, 18, 175-182, doi:10.1002/asl.740.
- Fasullo, J. T., R. Tomas, S. Stevenson, B. Otto-Bliesner, E. Brady, and E. Wahl, 2017: The amplifying influence of increased ocean stratification on a future year without a summer. Nature Communications, 8, doi:10.1038/s41467-017-01302-z.
- Fereday, D., 2017: How Persistent Are North Atlantic-European Sector Weather Regimes? J. Clim., 30, 2381-2394, doi:10.1175/jcli-d-16-0328.1.
- Ferguson, C. R., and D. M. Mocko, 2017: Diagnosing an Artificial Trend in NLDAS-2 Afternoon Precipitation. Journal of Hydrometeorology, 18, 1051-1070, doi:10.1175/jhm-d-16-0251.1.
- Fettweis, X., and Coauthors, 2017: Reconstructions of the 1900-2015 Greenland ice sheet surface mass balance using the regional climate MAR model. Cryosphere, 11, 1015-1033, doi:10.5194/tc-11-1015-2017.
- Fita, L., J. P. Evans, D. Argueso, A. King, and Y. Liu, 2017: Evaluation of the regional climate response in Australia to large-scale climate modes in the historical NARCliM simulations. Climate Dynamics, 49, 2815-2829, doi:10.1007/s00382-016-3484-x.
- Flanagan, P. X., J. B. Basara, and X. M. Xiao, 2017: Long-term analysis of the asynchronicity between temperature and precipitation maxima in the United States Great Plains. International Journal of Climatology, 37, 3919-3933, doi:10.1002/joc.4966.
- Fogt, R. L., C. A. Goergens, J. M. Jones, D. P. Schneider, J. P. Nicolas, D. H. Bromwich, and H. E. Dusselier, 2017: A twentieth century perspective on summer Antarctic pressure change and variability and contributions from tropical SSTs and ozone depletion. Geophysical Research Letters, 44, 9918-9927, doi:10.1002/2017gl075079.
- Fogt, R. L., M. E. Jones, S. Solomon, J. M. Jones, and C. A. Goergens, 2017: AN EXCEPTIONAL SUMMER DURING THE SOUTH POLE RACE OF 1911/12. Bulletin of the American Meteorological Society, 98, 2189-2200, doi:10.1175/bams-d-17-0013.1.
- Fortunato, A. B., P. Freire, X. Bertin, M. Rodrigues, J. Ferreira, and M. L. R. Liberato, 2017: A numerical study of the February 15, 1941 storm in the Tagus estuary. Continental Shelf Research, 144, 50-64, doi:10.1016/j.csr.2017.06.023.
- Franke, J., S. Bronnimann, J. Bhend, and Y. Brugnara, 2017: A monthly global paleo-reanalysis of the atmosphere from 1600 to 2005 for studying past climatic variations. Scientific Data, 4, doi:10.1038/sdata.2017.76.
- Frederikse, T., K. Simon, C. A. Katsman, and R. Riva, 2017: The sea-level budget along the Northwest Atlantic coast: GIA, mass changes, and large-scale ocean dynamics. Journal of Geophysical Research-Oceans, 122, 5486-5501, doi:10.1002/2017jc012699.
- Frederiksen, C. S., J. S. Frederiksen, J. M. Sisson, and S. L. Osbrough, 2017: Trends and projections of Southern Hemisphere baroclinicity: the role of external forcing and impact on Australian rainfall. Climate Dynamics, 48, 3261-3282, doi:10.1007/s00382-016-3263-8.
- Freeman, E., and Coauthors, 2017: ICOADS Release 3.0: a major update to the historical marine climate record. International Journal of Climatology, 37, 2211-2232, doi:10.1002/joc.4775.
- Friedman, A. R., G. Reverdin, M. Khodri, and G. Gastineau, 2017: A new record of Atlantic sea surface salinity from 1896 to 2013 reveals the signatures of climate variability and long-term trends. Geophysical Research Letters, 44, 1866-1876, doi:10.1002/2017gl072582.
- Fujiwara, M., and Coauthors, 2017: Introduction to the SPARC Reanalysis Intercomparison Project (S-RIP) and overview of the reanalysis systems. Atmospheric Chemistry and Physics, 17, 1417-1452, doi:10.5194/acp-17-1417-2017. Funk, C., and A. Hoell, 2017: Recent Climate Extremes Associated with the West Pacific Warming Mode. Climate Extremes: Patterns and Mechanisms, S. Y. S. Wang, J. H. Yoon, C. C. Funk, and R. R. Gillies, Eds., 165-176.
- Furukawa, R., R. Uemura, K. Fujita, J. Sjolte, K. Yoshimura, S. Matoba, and Y. Iizuka, 2017: Seasonal-Scale Dating of a Shallow Ice Core From Greenland Using Oxygen Isotope Matching Between Data and Simulation. Journal of Geophysical Research-Atmospheres, 122, 10873-10887, doi:10.1002/2017jd026716.
- Gallego, D., R. Garcia-Herrera, C. Pena-Ortiz, and P. Ribera, 2017: The steady enhancement of the Australian Summer Monsoon in the last 200 years. Scientific Reports, 7, doi:10.1038/s41598-017-16414-1.
- Gampe, D., and R. Ludwig, 2017: Evaluation of Gridded Precipitation Data Products for Hydrological Applications in Complex Topography. Hydrology, 4, doi:10.3390/hydrology4040053.
- Gan, B. L., and Coauthors, 2017: On the Response of the Aleutian Low to Greenhouse Warming. J. Clim., 30, 3907-3925, doi:10.1175/jcli-d-15-0789.1.
- Gelaro, R., and Coauthors, 2017: The Modern-Era Retrospective Analysis for Research and Applications, Version 2 (MERRA-2). J. Clim., 30, 5419-5454, doi:10.1175/jcli-d-16-0758.1.
- Gershunov, A., T. Shulgina, F. M. Ralph, D. A. Lavers, and J. J. Rutz, 2017: Assessing the climate-scale variability of atmospheric rivers affecting western North America. Geophysical Research Letters, 44, 7900-7908, doi:10.1002/2017gl074175.
- Ghelani, R. P. S., E. C. J. Oliver, N. J. Holbrook, M. C. Wheeler, and P. J. Klotzbach, 2017: Joint Modulation of Intraseasonal Rainfall in Tropical Australia by the Madden-Julian Oscillation and El Nino-Southern Oscillation. Geophysical Research Letters, 44, 10754-10761, doi:10.1002/2017gl075452.
- Ghosh, R., W. A. Muller, J. Baehr, and J. Bader, 2017: Impact of observed North Atlantic multidecadal variations to European summer climate: a linear baroclinic response to surface heating. Climate Dynamics, 48, 3547-3563, doi:10.1007/s00382-016-3283-4.
- Gic-Grusza, G., and A. Dudkowska, 2017: Numerical modeling of hydrodynamics and sediment transport-an integrated approach. Ocean Dynamics, 67, 1283-1292, doi:10.1007/s10236-017-1085-9.
- Glotter, M., and J. Elliott, 2017: Simulating US agriculture in a modern Dust Bowl drought. Nature Plants, 3, doi:10.1038/nplants.2016.193.
- Grainger, S., C. S. Frederiksen, and X. G. Zheng, 2017: Projections of Southern Hemisphere atmospheric circulation interannual variability. Climate Dynamics, 48, 1187-1211, doi:10.1007/s00382-016-3135-2.
- Green, B., J. Marshall, and A. Donohoe, 2017: Twentieth century correlations between extratropical SST variability and ITCZ shifts. Geophysical Research Letters, 44, 9039-9047, doi:10.1002/2017gl075044.
- Groth, A., Y. Feliks, D. Kondrashov, and M. Ghil, 2017: Interannual Variability in the North Atlantic Ocean's Temperature Field and Its Association with the Wind Stress Forcing. J. Clim., 30, 2655-2678, doi:10.1175/jcli-d-16-0370.1.
- Guan, X. D., J. P. Huang, and R. X. Guo, 2017: Changes in Aridity in Response to the Global Warming Hiatus. Journal of Meteorological Research, 31, 117-125, doi:10.1007/s13351-017-6038-1.
- Guo, Y. Y., M. F. Ting, Z. P. Wen, and D. E. Lee, 2017: Distinct Patterns of Tropical Pacific SST Anomaly and Their Impacts on North American Climate. J. Clim., 30, 5221-5241, doi:10.1175/jcli-d-16-0488.1.
- Hall, R. J., J. M. Jones, E. Hanna, A. A. Scaife, and R. Erdelyi, 2017: Drivers and potential predictability of summer time North Atlantic polar front jet variability. Climate Dynamics, 48, 3869-3887, doi:10.1007/s00382-016-3307-0.
- Han, B., and Coauthors, 2017: Global Land Surface Climate Analysis Based on the Calculation of a Modified Bowen Ratio. Advances in Atmospheric Sciences, 34, 663-678, doi:10.1007/s00376-016-6175-y.
- Hao, X., and S. P. He, 2017: Combined Effect of ENSO-Like and Atlantic Multidecadal Oscillation SSTAs on the Interannual Variability of the East Asian Winter Monsoon. J. Clim., 30, 2697-2716, doi:10.1175/jcli-d-16-0118.1.
- Hawkins, E., and Coauthors, 2017: ESTIMATING CHANGES IN GLOBAL TEMPERATURE SINCE THE PREINDUSTRIAL PERIOD. Bulletin of the American Meteorological Society, 98, 1841-1856, doi:10.1175/bams-d-16-0007.1.
- Henke, L. M. K., F. H. Lambert, and D. J. Charman, 2017: Was the Little Ice Age more or less El Nino-like than the Medieval Climate Anomaly? Evidence from hydrological and temperature proxy data. Climate of the Past, 13, 267-301, doi:10.5194/cp-13-267-2017.
- Herold, N., L. Alexander, D. Green, and M. Donat, 2017: Greater increases in temperature extremes in low versus high income countries. Environmental Research Letters, 12, doi:10.1088/1748-9326/aa5c43.
- Hersbach, H., and Coauthors, 2017: The potential value of early (1939-1967) upper-air data in atmospheric climate reanalysis. Quarterly Journal of the Royal Meteorological Society, 143, 1197-1210, doi:10.1002/qj.3040.
- Hoell, A., M. Barlow, F. Cannon, and T. Y. Xu, 2017: Oceanic Origins of Historical Southwest Asia Precipitation During the Boreal Cold Season. J. Clim., 30, 2885-2903, doi:10.1175/jcli-d-16-0519.1.
- Holland, M. M., L. Landrum, Y. Kostov, and J. Marshall, 2017: Sensitivity of Antarctic sea ice to the Southern Annular Mode in coupled climate models. Climate Dynamics, 49, 1813-1831, doi:10.1007/s00382-016-3424-9.
- Hu, Z. Y., Q. M. Zhou, X. Chen, C. Qian, S. S. Wang, and J. F. Li, 2017: Variations and changes of annual precipitation in Central Asia over the last century. International Journal of Climatology, 37, 157-170, doi:10.1002/joc.4988.
- Huang, J. P., Y. K. Xie, X. D. Guan, D. D. Li, and F. Ji, 2017: The dynamics of the warming hiatus over the Northern Hemisphere. Climate Dynamics, 48, 429-446, doi:10.1007/s00382-016-3085-8.
- Huang, W. Y., R. Y. Chen, Z. F. Yang, B. Wang, and W. Q. Ma, 2017: Exploring the combined effects of the Arctic Oscillation and ENSO on the wintertime climate over East Asia using self-organizing maps. Journal of Geophysical Research-Atmospheres, 122, 9107-9129, doi:10.1002/2017jd026812.
- Huang, Y. Y., X. Q. Dong, B. K. Xi, E. K. Dolinar, R. E. Stanfield, and S. Y. Qiu, 2017: Quantifying the Uncertainties of Reanalyzed Arctic Cloud and Radiation Properties Using Satellite Surface Observations. J. Clim., 30, 8007-8029, doi:10.1175/jcli-d-16-0722.1.
- Ishida, K., and M. L. Kavvas, 2017: Climate change analysis on historical watershed-scale precipitation by means of long-term dynamical downscaling. Hydrological Processes, 31, 35-50, doi:10.1002/hyp.10932.
- Jacques, A. A., J. D. Horel, E. T. Crosman, and F. L. Vernon, 2017: Tracking Mesoscale Pressure Perturbations Using the USArray Transportable Array. Monthly Weather Review, 145, 3119-3142, doi:10.1175/mwr-d-16-0450.1.
- Jayawardena, I., W. L. Sumathipala, and B. Basnayake, 2017: Impact of Madden Julian oscillation (MJO) and other meteorological phenomena on the heavy rainfall event from 19th-28th December, 2014 over Sri Lanka. Journal of the National Science Foundation of Sri Lanka, 45, 101-111, doi:10.4038/jnsfsr.v45i2.8176.
- Jia, F., D. X. Hu, S. J. Hu, and J. Q. Feng, 2017: Nino4 as a Key Region for the Interannual Variability of the Western Pacific Warm Pool. Journal of Geophysical Research-Oceans, 122, 9299-9314, doi:10.1002/2017jc013208.
- Jones, A. C., J. M. Haywood, N. Dunstone, K. Emanuel, M. K. Hawcroft, K. I. Hodges, and A. Jones, 2017: Impacts of hemispheric solar geoengineering on tropical cyclone frequency. Nature Communications, 8, doi:10.1038/s41467-017-01606-0.
- Jones, P. D., and Coauthors, 2017: Using ERA-Interim reanalysis for creating datasets of energy-relevant climate variables. Earth System Science Data, 9, 471-495, doi:10.5194/essd-9-471-2017.
- Karspeck, A. R., and Coauthors, 2017: Comparison of the Atlantic meridional overturning circulation between 1960 and 2007 in six ocean reanalysis products. Climate Dynamics, 49, 957-982, doi:10.1007/s00382-015-2787-7.
- Keller, J. D., L. Delle Monache, and S. Alessandrini, 2017: Statistical Downscaling of a High-Resolution Precipitation Reanalysis Using the Analog Ensemble Method. Journal of Applied Meteorology and Climatology, 56, 2081-2095, doi:10.1175/jamc-d-16-0380.1. Klotzbach, P. J., M. A. Saunders, G. D. Bell, and E. S. Blake, 2017: North Atlantic Seasonal Hurricane Prediction: Underlying Science and an Evaluation of Statistical Models. Climate Extremes: Patterns and Mechanisms, S. Y. S. Wang, J. H. Yoon, C. C. Funk, and R. R. Gillies, Eds., 315-328.
- Kolstad, E. W., 2017: Causal Pathways for Temperature Predictability from Snow Depth. J. Clim., 30, 9651-9663, doi:10.1175/jcli-d-17-0280.1.
- Kolstad, E. W., E. A. Barnes, and S. P. Sobolowski, 2017: Quantifying the role of land-atmosphere feedbacks in mediating near-surface temperature persistence. Quarterly Journal of the Royal Meteorological Society, 143, 1620-1631, doi:10.1002/qj.3033.
- Kravtsov, S., 2017: Comment on "Comparison of Low-Frequency Internal Climate Variability in CMIP5 Models and Observations''. J. Clim., 30, 9763-9772, doi:10.1175/jcli-d-17-0438.1.
- Kravtsov, S., 2017: Pronounced differences between observed and CMIP5-simulated multidecadal climate variability in the twentieth century. Geophysical Research Letters, 44, 5749-5757, doi:10.1002/2017gl074016.
- Kravtsov, S., P. Roebber, and V. Brazauskas, 2017: A virtual climate library of surface temperature over North America for 1979-2015. Scientific Data, 4, doi:10.1038/sdata.2017.155.
- Krishnamurthy, L., and V. Krishnamurthy, 2017: Indian monsoon's relation with the decadal part of PDO in observations and NCAR CCSM4. International Journal of Climatology, 37, 1824-1833, doi:10.1002/joc.4815.
- Kuchar, A., and Coauthors, 2017: On the aliasing of the solar cycle in the lower stratospheric tropical temperature. Journal of Geophysical Research-Atmospheres, 122, 9076-9093, doi:10.1002/2017jd026948.
- Lang, T. J., and Coauthors, 2017: WMO WORLD RECORD LIGHTNING EXTREMES Longest Reported Flash Distance and Longest Reported Flash Duration. Bulletin of the American Meteorological Society, 98, 1153-1168, doi:10.1175/bams-d-16-0061.1.
- Lavergne, A., and Coauthors, 2017: Modelling tree ring cellulose delta O-18 variations in two temperature-sensitive tree species from North and South America. Climate of the Past, 13, 1515-1526, doi:10.5194/cp-13-1515-2017.
- Lee, S. K., D. L. Volkov, H. Lopez, W. G. Cheon, A. L. Gordon, Y. Y. Liu, and R. Wanninkhof, 2017: Wind-driven ocean dynamics impact on the contrasting sea-ice trends around West Antarctica. Journal of Geophysical Research-Oceans, 122, 4413-4430, doi:10.1002/2016jc012416.
- Lehner, F., C. Deser, and L. Terray, 2017: Toward a New Estimate of "Time of Emergence'' of Anthropogenic Warming: Insights from Dynamical Adjustment and a Large Initial-Condition Model Ensemble. J. Clim., 30, 7739-7756, doi:10.1175/jcli-d-16-0792.1.
- Lewis, K., 2017: Understanding climate as a driver of food insecurity in Ethiopia. Climatic Change, 144, 317-328, doi:10.1007/s10584-017-2036-7.
- Li, C., J. J. Luo, and S. L. Li, 2017: Impacts of Different Types of ENSO on the Interannual Seesaw between the Somali and the Maritime Continent Cross-Equatorial Flows. J. Clim., 30, 2621-2638, doi:10.1175/jcli-d-16-0521.1.
- Li, G., J. P. Chen, X. Wang, Y. K. Tan, and X. H. Jiang, 2017: Modulation of Pacific Decadal Oscillation on the relationship of El Nino with southern China rainfall during early boreal winter. Atmospheric Science Letters, 18, 336-341, doi:10.1002/asl.761.
- Li, J., B. Wang, and Y. M. Yang, 2017: Retrospective seasonal prediction of summer monsoon rainfall over West Central and Peninsular India in the past 142 years. Climate Dynamics, 48, 2581-2596, doi:10.1007/s00382-016-3225-1.
- Li, M. X., Z. G. Ma, H. P. Gu, Q. Yang, and Z. Y. Zheng, 2017: Production of a combined land surface data set and its use to assess land-atmosphere coupling in China. Journal of Geophysical Research-Atmospheres, 122, 948-965, doi:10.1002/2016jd025511.
- Li, Q. X., L. Zhang, W. H. Xu, T. J. Zhou, J. F. Wang, P. M. Zhai, and P. Jones, 2017: COMPARISONS OF TIME SERIES OF ANNUAL MEAN SURFACE AIR TEMPERATURE FOR CHINA SINCE THE 1900S. Bulletin of the American Meteorological Society, 98, 699-711, doi:10.1175/bams-d-16-0092.1.
- Li, X. L., and Coauthors, 2017: The East Asian summer monsoon variability over the last 145 years inferred from the Shihua Cave record, North China. Scientific Reports, 7, doi:10.1038/s41598-017-07251-3.
- Liu, G., P. Zhao, and J. M. Chen, 2017: Possible Effect of the Thermal Condition of the Tibetan Plateau on the Interannual Variability of the Summer Asian-Pacific Oscillation. J. Clim., 30, 9965-9977, doi:10.1175/jcli-d-17-0079.1.
- Liu, Z. F., Y. L. Tang, Z. M. Jian, C. J. Poulsen, J. M. Welker, and G. J. Bowen, 2017: Pacific North American circulation pattern links external forcing and North American hydroclimatic change over the past millennium. Proceedings of the National Academy of Sciences of the United States of America, 114, 3340-3345, doi:10.1073/pnas.1618201114.
- Liu, Z. F., K. Yoshimura, N. Buenning, Z. M. Jian, and L. Zhao, 2017: The response of winter Pacific North American pattern to strong volcanic eruptions. Climate Dynamics, 48, 3599-3614, doi:10.1007/s00382-016-3287-0.
- Long, C. S., M. Fujiwara, S. Davis, D. M. Mitchell, and C. J. Wright, 2017: Climatology and interannual variability of dynamic variables in multiple reanalyses evaluated by the SPARC Reanalysis Intercomparison Project (S-RIP). Atmospheric Chemistry and Physics, 17, 14593-14629, doi:10.5194/acp-17-14593-2017.
- Loughran, T. F., S. E. Perkins-Kirkpatrick, and L. V. Alexander, 2017: Understanding the spatio-temporal influence of climate variability on Australian heatwaves. International Journal of Climatology, 37, 3963-3975, doi:10.1002/joc.4971.
- Loughran, T. F., S. E. Perkins-Kirkpatrick, L. V. Alexander, and A. J. Pitman, 2017: No significant difference between Australian heat wave impacts of Modoki and eastern Pacific El Nino. Geophysical Research Letters, 44, 5150-5157, doi:10.1002/2017gl073231.
- Lovejoy, S., 2017: How accurately do we know the temperature of the surface of the earth? Climate Dynamics, 49, 4089-4106, doi:10.1007/s00382-017-3561-9.
- Lubbecke, J. F., and M. J. McPhaden, 2017: Symmetry of the Atlantic Nino mode. Geophysical Research Letters, 44, 965-973, doi:10.1002/2016gl071829.
- Lyu, K., J. Y. Yu, and H. Paek, 2017: The Influences of the Atlantic Multidecadal Oscillation on the Mean Strength of the North Pacific Subtropical High during Boreal Winter. J. Clim., 30, 411-426, doi:10.1175/jcli-d-16-0525.1.
- Lyu, K. W., X. B. Zhang, J. A. Church, J. Y. Hu, and J. Y. Yu, 2017: Distinguishing the Quasi-Decadal and Multidecadal Sea Level and Climate Variations in the Pacific: Implications for the ENSO-Like Low-Frequency Variability. J. Clim., 30, 5097-5117, doi:10.1175/jcli-d-17-0004.1.
- Madrigal-Gonzalez, J., and Coauthors, 2017: Forest productivity in southwestern Europe is controlled by coupled North Atlantic and Atlantic Multidecadal Oscillations. Nature Communications, 8, doi:10.1038/s41467-017-02319-0.
- Magee, A. D., D. C. Verdon-Kidd, H. J. Diamond, and A. S. Kiem, 2017: Influence of ENSO, ENSO Modoki, and the IPO on tropical cyclogenesis: a spatial analysis of the southwest Pacific region. International Journal of Climatology, 37, 1118-1137, doi:10.1002/joc.5070.
- Malevich, S. B., and C. A. Woodhouse, 2017: Pacific sea surface temperatures, midlatitude atmospheric circulation, and widespread interannual anomalies in western US streamflow. Geophysical Research Letters, 44, 5123-5132, doi:10.1002/2017gl073536.
- Malik, A., and Coauthors, 2017: Decadal to multi-decadal scale variability of Indian summer monsoon rainfall in the coupled ocean-atmosphere-chemistry climate model SOCOL-MPIOM. Climate Dynamics, 49, 3551-3572, doi:10.1007/s00382-017-3529-9.
- Masaki, Y., and Coauthors, 2017: Intercomparison of global river discharge simulations focusing on dam operation-multiple models analysis in two case-study river basins, Missouri-Mississippi and Green-Colorado. Environmental Research Letters, 12, doi:10.1088/1748-9326/aa57a8.
- Masina, S., and A. Storto, 2017: Reconstructing the recent past ocean variability: Status and perspective. Journal of Marine Research, 75, 727-764, doi:McAfee, S. A., 2017: Uncertainty in Pacific decadal oscillation indices does not contribute to teleconnection instability. International Journal of Climatology, 37, 3509-3516, doi:10.1002/joc.4918.
- McKinnon, K. A., A. Poppick, E. Dunn-Sigouin, and C. Deser, 2017: An "Observational Large Ensemble'' to Compare Observed and Modeled Temperature Trend Uncertainty due to Internal Variability. J. Clim., 30, 7585-7598, doi:10.1175/jcli-d-16-0905.1.
- Medvedev, I. P., A. B. Rabinovich, and E. A. Kulikov, 2017: The pole tide/14-month oscillations in the Baltic Sea during the 19th and 20th centuries: Spatial and temporal variations. Continental Shelf Research, 137, 117-130, doi:10.1016/j.csr.2017.02.001.
- Miller, A. J., and Coauthors, 2017: Coupled ocean-atmosphere modeling and predictions. Journal of Marine Research, 75, 361-402, doi:Moore, G. W. K., and M. Babij, 2017: Iceland's Great Frost Winter of 1917/1918 and its representation in reanalyses of the twentieth century. Quarterly Journal of the Royal Meteorological Society, 143, 508-520, doi:10.1002/qj.2939.
- Mouyen, M., A. Canitano, B. F. Chao, Y. J. Hsu, P. Steer, L. Longuevergne, and J. P. Boy, 2017: Typhoon-Induced Ground Deformation. Geophysical Research Letters, 44, 11004-11011, doi:10.1002/2017gl075615.
- Munday, C., and R. Washington, 2017: Circulation controls on southern African precipitation in coupled models: The role of the Angola Low. Journal of Geophysical Research-Atmospheres, 122, 861-877, doi:10.1002/2016jd025736.
- Munoz, S. E., and S. G. Dee, 2017: El Nino increases the risk of lower Mississippi River flooding. Scientific Reports, 7, doi:10.1038/s41598-017-01919-6.
- Munz, P. M., A. Luckge, M. Siccha, A. Boll, S. Forke, M. Kucera, and H. Schulz, 2017: The Indian winter monsoon and its response to external forcing over the last two and a half centuries. Climate Dynamics, 49, 1801-1812, doi:10.1007/s00382-016-3403-1.
- Naiman, Z., P. J. Goodman, J. P. Krasting, S. L. Malyshev, J. L. Russell, R. J. Stouffer, and A. T. Wittenberg, 2017: Impact of Mountains on Tropical Circulation in Two Earth System Models. J. Clim., 30, 4149-4163, doi:10.1175/jcli-d-16-0512.1.
- Nath, D., W. Chen, and X. Q. Lan, 2017: Long-Term Trend in Potential Vorticity Intrusion Events over the Pacific Ocean: Role of Global Mean Temperature Rise. Journal of Meteorological Research, 31, 906-915, doi:10.1007/s13351-017-7021-6.
- Nayak, M. A., and G. Villarini, 2017: A long-term perspective of the hydroclimatological impacts of atmospheric rivers over the central United States. Water Resources Research, 53, 1144-1166, doi:10.1002/2016wr019033.
- Nidheesh, A. G., M. Lengaigne, J. Vialard, T. Izumo, A. S. Unnikrishnan, and C. Cassou, 2017: Influence of ENSO on the Pacific decadal oscillation in CMIP models. Climate Dynamics, 49, 3309-3326, doi:10.1007/s00382-016-3514-8.
- Nilsen, I. B., J. H. Stagge, and L. M. Tallaksen, 2017: A probabilistic approach for attributing temperature changes to synoptic type frequency. International Journal of Climatology, 37, 2990-3002, doi:10.1002/joc.4894.
- O'Reilly, C. H., T. Woollings, and L. Zanna, 2017: The Dynamical Influence of the Atlantic Multidecadal Oscillation on Continental Climate. J. Clim., 30, 7213-7230, doi:10.1175/jcli-d-16-0345.1.
- Okazaki, A., and K. Yoshimura, 2017: Development and evaluation of a system of proxy data assimilation for paleoclimate reconstruction. Climate of the Past, 13, 379-393, doi:10.5194/cp-13-379-2017.
- Okumura, Y. M., P. DiNezio, and C. Deser, 2017: Evolving Impacts of Multiyear La Nina Events on Atmospheric Circulation and US Drought. Geophysical Research Letters, 44, 11614-11623, doi:10.1002/2017gl075034.
- Orsi, A. J., and Coauthors, 2017: The recent warming trend in North Greenland. Geophysical Research Letters, 44, 6235-6243, doi:10.1002/2016gl072212.
- Osterberg, E. C., and Coauthors, 2017: The 1200 year composite ice core record of Aleutian Low intensification. Geophysical Research Letters, 44, 7447-7454, doi:10.1002/2017gl073697.
- Paeth, H., F. Pollinger, and C. Ring, 2017: Detection and Attribution of Multivariate Climate Change Signals Using Discriminant Analysis and Bayesian Theorem. J. Clim., 30, 7757-7776, doi:10.1175/jcli-d-16-0850.1.
- Paik, S., and S. K. Min, 2017: Climate responses to volcanic eruptions assessed from observations and CMIP5 multi-models. Climate Dynamics, 48, 1017-1030, doi:10.1007/s00382-016-3125-4.
- Pappas, C., M. D. Mahecha, D. C. Frank, F. Babst, and D. Koutsoyiannis, 2017: Ecosystem functioning is enveloped by hydrometeorological variability. Nature Ecology & Evolution, 1, 1263-1270, doi:10.1038/s41559-017-0277-5.
- Park, B. J., Y. H. Kim, S. K. Min, M. K. Kim, Y. Choi, K. O. Boo, and S. Shim, 2017: Long-Term Warming Trends in Korea and Contribution of Urbanization: An Updated Assessment. Journal of Geophysical Research-Atmospheres, 122, 10637-10654, doi:10.1002/2017jd027167.
- Park, Y. G., and A. Choi, 2017: Long-term changes of South China Sea surface temperatures in winter and summer. Continental Shelf Research, 143, 185-193, doi:10.1016/j.csr.2016.07.019.
- Parker, W. S., 2017: Computer Simulation, Measurement, and Data Assimilation. British Journal for the Philosophy of Science, 68, 273-304, doi:10.1093/bjps/axv037.
- Parodi, A., L. Ferraris, W. Gallus, M. Maugeri, L. Molini, F. Siccardi, and G. Boni, 2017: Ensemble cloud-resolving modelling of a historic back-building mesoscale convective system over Liguria: the San Fruttuoso case of 1915. Climate of the Past, 13, 455-472, doi:10.5194/cp-13-455-2017.
- Peings, Y., H. Douville, J. Colin, D. Saint Martin, and G. Magnusdottir, 2017: Snow-(N)AO Teleconnection and Its Modulation by the Quasi-Biennial Oscillation. J. Clim., 30, 10211-10235, doi:10.1175/jcli-d-17-0041.1.
- Pepler, A. S., J. Fong, and L. V. Alexander, 2017: Australian east coast mid-latitude cyclones in the 20th Century Reanalysis ensemble. International Journal of Climatology, 37, 2187-2192, doi:10.1002/joc.4812.
- Perez, J., M. Menendez, and I. J. Losada, 2017: GOW2: A global wave hindcast for coastal applications. Coastal Engineering, 124, 1-11, doi:10.1016/j.coastaleng.2017.03.005.
- Perkins, W. A., and G. J. Hakim, 2017: Reconstructing paleoclimate fields using online data assimilation with a linear inverse model. Climate of the Past, 13, 421-436, doi:10.5194/cp-13-421-2017.
- Peterson, I., B. Greenan, D. Gilbert, and D. Hebert, 2017: Variability and wind forcing of ocean temperature and thermal fronts in the Slope Water region of the Northwest Atlantic. Journal of Geophysical Research-Oceans, 122, 7325-7343, doi:10.1002/2017jc012788.
- Pierre, S., and Coauthors, 2017: 6-kyr record of flood frequency and intensity in the western Mediterranean Alps - Interplay of solar and temperature forcing. Quaternary Science Reviews, 170, 121-135, doi:10.1016/j.quascirev.2017.06.019.
- Pierret, J., and S. S. P. Shen, 2017: 4D Visual Delivery of Big Climate Data: A Fast Web Database Application System. Advances in Data Science and Adaptive Analysis, 9, doi:10.1142/s2424922x17500061.
- Pinheiro, H. R., K. I. Hodges, M. A. Gan, and N. J. Ferreira, 2017: A new perspective of the climatological features of upper-level cut-off lows in the Southern Hemisphere. Climate Dynamics, 48, 541-559, doi:10.1007/s00382-016-3093-8.
- Pohl, B., C. Macron, and P. A. Monerie, 2017: Fewer rainy days and more extreme rainfall by the end of the century in Southern Africa. Scientific Reports, 7, doi:10.1038/srep46466.
- Polonsky, A. B., and D. V. Basharin, 2017: How strong is the impact of the Indo-ocean dipole on the surface air temperature/sea level pressure anomalies in the Mediterranean region? Global and Planetary Change, 151, 101-107, doi:10.1016/j.gloplacha.2016.11.007.
- Pye, K., and S. J. Blott, 2017: Evolution of a sediment-starved, over-stabilised dunefield: Kenfig Burrows, South Wales, UK. Journal of Coastal Conservation, 21, 685-717, doi:10.1007/s11852-017-0506-8.
- Rabin, S. S., and Coauthors, 2017: The Fire Modeling Intercomparison Project (FireMIP), phase 1: experimental and analytical protocols with detailed model descriptions. Geoscientific Model Development, 10, 1175-1197, doi:10.5194/gmd-10-1175-2017.
- Raynaud, D., B. Hingray, I. Zin, S. Anquetin, S. Debionne, and R. Vautard, 2017: Atmospheric analogues for physically consistent scenarios of surface weather in Europe and Maghreb. International Journal of Climatology, 37, 2160-2176, doi:10.1002/joc.4844.
- Rhines, A., K. A. McKinnon, M. P. Tingley, and P. Huybers, 2017: Seasonally Resolved Distributional Trends of North American Temperatures Show Contraction of Winter Variability. J. Clim., 30, 1139-1157, doi:10.1175/jcli-d-16-0363.1.
- Ricchi, A., and Coauthors, 2017: Sensitivity of a Mediterranean Tropical-Like Cyclone to Different Model Configurations and Coupling Strategies. Atmosphere, 8, doi:10.3390/atmos8050092.
- Rimbu, N., G. Lohmann, M. Werner, and M. Ionita, 2017: Links between central Greenland stable isotopes, blocking and extreme climate variability over Europe at decadal to multidecadal time scales. Climate Dynamics, 49, 649-663, doi:10.1007/s00382-016-3365-3.
- Risbey, J. S., M. R. Grose, D. P. Monselesan, T. J. O'Kane, and S. Lewandowsky, 2017: Transient response of the global mean warming rate and its spatial variation. Weather and Climate Extremes, 18, 55-64, doi:10.1016/j.wace.2017.11.002.
- Rodriguez-Lloveras, X., J. P. Corella, and G. Benito, 2017: MODELLING THE HYDRO-SEDIMENTARY DYNAMICS OF A MEDITERRANEAN SEMIARID UNGAUGED WATERSHED BEYOND THE INSTRUMENTAL PERIOD. Land Degradation & Development, 28, 1506-1518, doi:10.1002/ldr.2678.
- Roth, M., G. Hendeby, C. Fritsche, and F. Gustafsson, 2017: The Ensemble Kalman filter: a signal processing perspective. Eurasip Journal on Advances in Signal Processing, doi:10.1186/s13634-017-0492-x.
- Rudd, A. C., V. A. Bell, and A. L. Kay, 2017: National-scale analysis of simulated hydrological droughts (1891-2015). Journal of Hydrology, 550, 368-385, doi:10.1016/j.jhydrol.2017.05.018.
- Russell, A. M., A. Gnanadesikan, and B. Zaitchik, 2017: Are the Central Andes Mountains a Warming Hot Spot? J. Clim., 30, 3589-3608, doi:10.1175/jcli-d-16-0268.1.
- Rydval, M., and Coauthors, 2017: Reconstructing 800 years of summer temperatures in Scotland from tree rings. Climate Dynamics, 49, 2951-2974, doi:10.1007/s00382-016-3478-8.
- Sakashita, W., H. Miyahara, Y. Yokoyama, T. Aze, S. P. Obrochta, and T. Nakatsuka, 2017: Relationship between the Northern Pacific Gyre Oscillation and tree-ring cellulose oxygen isotopes in northeastern Japan. Geoscience Letters, 4, doi:10.1186/s40562-017-0095-2.
- Sanderson, M. G., T. Economou, K. H. Salmon, and S. E. O. Jones, 2017: Historical Trends and Variability in Heat Waves in the United Kingdom. Atmosphere, 8, doi:10.3390/atmos8100191.
- Santamaria-Aguilar, S., A. Arns, and A. T. Vafeidis, 2017: Sea-level rise impacts on the temporal and spatial variability of extreme water levels: A case study for St. Peter-Ording, Germany. Journal of Geophysical Research-Oceans, 122, 2742-2759, doi:10.1002/2016jc012579.
- Santos, M., J. A. Santos, and M. Fragoso, 2017: Atmospheric driving mechanisms of flash floods in Portugal. International Journal of Climatology, 37, 671-680, doi:10.1002/joc.5030.
- Santos, V. M., I. D. Haigh, and T. Wahl, 2017: Spatial and Temporal Clustering Analysis of Extreme Wave Events around the UK Coastline. Journal of Marine Science and Engineering, 5, doi:10.3390/jmse5030028.
- Sasaki, Y. N., R. Washizu, T. Yasuda, and S. Minobe, 2017: Sea Level Variability around Japan during the Twentieth Century Simulated by a Regional Ocean Model. J. Clim., 30, 5585-5595, doi:10.1175/jcli-d-16-0497.1.
- Saunders, M. A., P. J. Klotzbach, and A. S. R. Lea, 2017: Replicating annual North Atlantic hurricane activity 1878-2012 from environmental variables. Journal of Geophysical Research-Atmospheres, 122, 6284-6297, doi:10.1002/2017jd026492.
- Saurral, R. I., I. A. Camilloni, and V. R. Barros, 2017: Low-frequency variability and trends in centennial precipitation stations in southern South America. International Journal of Climatology, 37, 1774-1793, doi:10.1002/joc.4810.
- Schemm, S., A. Nummelin, N. G. Kvamsto, and O. Breivik, 2017: The Ocean Version of the Lagrangian Analysis Tool LAGRANTO. Journal of Atmospheric and Oceanic Technology, 34, 1723-1741, doi:10.1175/jtech-d-16-0198.1.
- Scheuer, S., D. Haase, and M. Volk, 2017: Integrative assessment of climate change for fast-growing urban areas: Measurement and recommendations for future research. Plos One, 12, doi:10.1371/journal.pone.0189451.
- Schwander, M., S. Bronnimann, G. Delaygue, M. Rohrer, R. Auchmann, and Y. Brugnara, 2017: Reconstruction of Central European daily weather types back to 1763. International Journal of Climatology, 37, 30-44, doi:10.1002/joc.4974.
- Seager, R., N. Henderson, M. A. Cane, H. B. Liu, and J. Nakamura, 2017: Is There a Role for Human-Induced Climate Change in the Precipitation Decline that Drove the California Drought? J. Clim., 30, 10237-10258, doi:10.1175/jcli-d-17-0192.1.
- Seager, R., and M. F. Ting, 2017: Decadal Drought Variability Over North America: Mechanisms and Predictability. Current Climate Change Reports, 3, 141-149, doi:10.1007/s40641-017-0062-1.
- Seim, A., and Coauthors, 2017: Synoptic-scale circulation patterns during summer derived from tree rings in mid-latitude Asia. Climate Dynamics, 49, 1917-1931, doi:10.1007/s00382-016-3426-7. Serykh, I. V., 2017: A comparison of the structure and dynamics of Global atmospheric oscillation in reality and in the CMIP5 climate models. International Conference on Computational Information Technologies for Environmental Sciences, E. Gordov, and V. Lykosov, Eds.
- Shan, H. X., Y. P. Guan, J. P. Huang, and C. M. Dong, 2017: Trajectory patterns of the annual cycle of the heat centre of the Indo-Pacific warm pool. International Journal of Climatology, 37, 637-647, doi:10.1002/joc.4729.
- Shen, L., and L. J. Mickley, 2017: Seasonal prediction of US summertime ozone using statistical analysis of large scale climate patterns. Proceedings of the National Academy of Sciences of the United States of America, 114, 2491-2496, doi:10.1073/pnas.1610708114.
- Shen, L., L. J. Mickley, E. M. Leibensperger, and M. W. Li, 2017: Strong Dependence of US Summertime Air Quality on the Decadal Variability of Atlantic Sea Surface Temperatures. Geophysical Research Letters, 44, 12527-12535, doi:10.1002/2017gl075905.
- Shen, X. J., B. H. Liu, and X. G. Lu, 2017: Effects of land use/land cover on diurnal temperature range in the temperate grassland region of China. Science of the Total Environment, 575, 1211-1218, doi:10.1016/j.scitotenv.2016.09.187.
- Slangen, A. B. A., and Coauthors, 2017: Evaluating Model Simulations of Twentieth-Century Sea Level Rise. Part I: Global Mean Sea Level Change. J. Clim., 30, 8539-8563, doi:10.1175/jcli-d-17-0110.1.
- So, E. M., and M. S. Suh, 2017: Trends of Upper Jet Streams Characteristics (Intensity, Altitude, Latitude and Longitude) Over the Asia-North Pacific Region Based on Four Reanalysis Datasets. Atmosphere-Korea, 27, 1-16, doi:10.14191/Atmos.2017.27.1.001.
- Srinivasu, U., M. Ravichandran, W. Q. Han, S. Sivareddy, H. Rahman, Y. L. Li, and S. Nayak, 2017: Causes for the reversal of North Indian Ocean decadal sea level trend in recent two decades. Climate Dynamics, 49, 3887-3904, doi:10.1007/s00382-017-3551-y.
- Stankunavicius, G., D. Basharin, R. Skorupskas, and G. Vivaldo, 2017: Euro-Atlantic blocking events and their impact on surface air temperature and precipitation over the European region in the 20th century. Climate Research, 71, 203-218, doi:10.3354/cr01438.
- Steen-Larsen, H. C., C. Risi, M. Werner, K. Yoshimura, and V. Masson-Delmotte, 2017: Evaluating the skills of isotope-enabled general circulation models against in situ atmospheric water vapor isotope observations. Journal of Geophysical Research-Atmospheres, 122, 246-263, doi:10.1002/2016jd025443.
- Storto, A., and S. Masina, 2017: Objectively estimating the temporal evolution of accuracy and skill in a global ocean reanalysis. Meteorological Applications, 24, 101-113, doi:10.1002/met.1609.
- Strong, C., and G. J. McCabe, 2017: Observed variations in US frost timing linked to atmospheric circulation patterns. Nature Communications, 8, doi:10.1038/ncomms15307.
- Stryhal, J., and R. Huth, 2017: Classifications of Winter Euro-Atlantic Circulation Patterns: An Intercomparison of Five Atmospheric Reanalyses. J. Clim., 30, 7847-7861, doi:10.1175/jcli-d-17-0059.1.
- Sun, C., J. P. Li, R. Q. Ding, and Z. Jin, 2017: Cold season Africa-Asia multidecadal teleconnection pattern and its relation to the Atlantic multidecadal variability. Climate Dynamics, 48, 3903-3918, doi:10.1007/s00382-016-3309-y.
- Swingedouw, D., J. Mignot, E. Guilyardi, S. Nguyen, and L. Ormieres, 2017: Tentative reconstruction of the 1998-2012 hiatus in global temperature warming using the IPSL-CM5A-LR climate model. Comptes Rendus Geoscience, 349, 369-379, doi:10.1016/j.crte.2017.09.014.
- Swingedouw, D., J. Mignot, P. Ortega, M. Khodri, M. Menegoz, C. Cassou, and V. Hanquiez, 2017: Impact of explosive volcanic eruptions on the main climate variability modes. Global and Planetary Change, 150, 24-45, doi:10.1016/j.gloplacha.2017.01.006.
- Taszarek, M., and J. Gromadzki, 2017: Deadly Tornadoes in Poland from 1820 to 2015. Monthly Weather Review, 145, 1221-1243, doi:10.1175/mwr-d-16-0146.1.
- Terzago, S., J. von Hardenberg, E. Palazzi, and A. Provenzale, 2017: Snow water equivalent in the Alps as seen by gridded data sets, CMIP5 and CORDEX climate models. Cryosphere, 11, 1625-1645, doi:10.5194/tc-11-1625-2017.
- Thorne, P. W., and Coauthors, 2017: TOWARD AN INTEGRATED SET OF SURFACE METEOROLOGICAL OBSERVATIONS FOR CLIMATE SCIENCE AND APPLICATIONS. Bulletin of the American Meteorological Society, 98, 2689-2702, doi:10.1175/bams-d-16-0165.1.
- Tokinaga, H., S. P. Xie, and H. Mukougawa, 2017: Early 20th-century Arctic warming intensified by Pacific and Atlantic multidecadal variability. Proceedings of the National Academy of Sciences of the United States of America, 114, 6227-6232, doi:10.1073/pnas.1615880114. Toride, K., D. L. Cawthorne, K. Ishida, A. J. Diaz, L. M. Kavvas, and M. L. Anderson, 2017: Climate Change Trend Analysis on Extreme Precipitation over the Shasta Dam Watershed Based on 159-Year Long-Term Dynamic Downscaling. 427-436 pp.
- Toride, K., P. Neluwala, H. Kim, and K. Yoshimura, 2017: Feasibility Study of the Reconstruction of Historical Weather with Data Assimilation. Monthly Weather Review, 145, 3563-3580, doi:10.1175/mwr-d-16-0288.1.
- Trott, C. B., B. Subrahmanyam, and V. S. N. Murty, 2017: Variability of the Somali Current and eddies during the southwest monsoon regimes. Dynamics of Atmospheres and Oceans, 79, 43-55, doi:10.1016/j.dynatmoce.2017.07.002.
- Ummenhofer, C. C., H. Seo, Y. O. Kwon, R. Parfitt, S. Brands, and T. M. Joyce, 2017: Emerging European winter precipitation pattern linked to atmospheric circulation changes over the North Atlantic region in recent decades. Geophysical Research Letters, 44, 8557-8566, doi:10.1002/2017gl074188.
- van den Broeke, M., and Coauthors, 2017: Greenland Ice Sheet Surface Mass Loss: Recent Developments in Observation and Modeling. Current Climate Change Reports, 3, 345-356, doi:10.1007/s40641-017-0084-8.
- Verdon-Kidd, D. C., B. R. Scanlon, R. C. Tong, and D. N. Fernando, 2017: A comparative study of historical droughts over Texas, USA and Murray-Darling Basin, Australia: Factors influencing initialization and cessation. Global and Planetary Change, 149, 123-138, doi:10.1016/j.gloplacha.2017.01.001.
- Vitart, F., 2017: Madden - Julian Oscillation prediction and teleconnections in the S2S database. Quarterly Journal of the Royal Meteorological Society, 143, 2210-2220, doi:10.1002/qj.3079.
- von Storch, H., and Coauthors, 2017: Regional reanalysis without local data: Exploiting the downscaling paradigm. Journal of Geophysical Research-Atmospheres, 122, 8631-8649, doi:10.1002/2016jd026332.
- Walsh, J. E., F. Fetterer, J. S. Stewart, and W. L. Chapman, 2017: A DATABASE FOR DEPICTING ARCTIC SEA ICE VARIATIONS BACK TO 1850. Geographical Review, 107, 89-107, doi:10.1111/j.1931-0846.2016.12195.x. Wang, C. Z., C. Deser, J. Y. Yu, P. DiNezio, and A. Clement, 2017: El Nino and Southern Oscillation (ENSO): A Review. Vol. 8, 85-106 pp.
- Wang, C. Z., X. D. Wang, R. H. Weisberg, and M. L. Black, 2017: Variability of tropical cyclone rapid intensification in the North Atlantic and its relationship with climate variations. Climate Dynamics, 49, 3627-3645, doi:10.1007/s00382-017-3537-9.
- Wang, L., P. Q. Xu, W. Chen, and Y. Liu, 2017: Interdecadal Variations of the Silk Road Pattern. J. Clim., 30, 9915-9932, doi:10.1175/jcli-d-17-0340.1.
- Wang, P. X., B. Wang, H. Cheng, J. Fasullo, Z. T. Guo, T. Kiefer, and Z. Y. Liu, 2017: The global monsoon across time scales: Mechanisms and outstanding issues. Earth-Science Reviews, 174, 84-121, doi:10.1016/j.earscirev.2017.07.006.
- Wang, X. F., J. P. Li, C. Sun, and T. Liu, 2017: NAO and its relationship with the Northern Hemisphere mean surface temperature in CMIP5 simulations. Journal of Geophysical Research-Atmospheres, 122, 4202-4227, doi:10.1002/2016jd025979.
- Wegmann, M., S. Bronnimann, and G. P. Compo, 2017: Tropospheric circulation during the early twentieth century Arctic warming. Climate Dynamics, 48, 2405-2418, doi:10.1007/s00382-016-3212-6.
- Wegmann, M., Y. Orsolini, E. Dutra, O. Bulygina, A. Sterin, and S. Bronnimann, 2017: Eurasian snow depth in long-term climate reanalyses. Cryosphere, 11, 923-935, doi:10.5194/tc-11-923-2017.
- Whelan, J., and J. S. Frederiksen, 2017: Dynamics of the perfect storms: La Nia and Australia's extreme rainfall and floods of 1974 and 2011. Climate Dynamics, 48, 3935-3948, doi:10.1007/s00382-016-3312-3.
- Williams, A. P., B. I. Cook, J. E. Smerdon, D. A. Bishop, R. Seager, and J. S. Mankin, 2017: The 2016 Southeastern US Drought: An Extreme Departure From Centennial Wetting and Cooling. Journal of Geophysical Research-Atmospheres, 122, 10888-10905, doi:10.1002/2017jd027523.
- Williams, B., and Coauthors, 2017: North Pacific twentieth century decadal-scale variability is unique for the past 342 years. Geophysical Research Letters, 44, 3761-3769, doi:10.1002/2017gl073138.
- Wilton, D. J., A. Jowett, E. Hanna, G. R. Bigg, M. R. van den Broeke, X. Fettweis, and P. Huybrechts, 2017: High resolution (1 km) positive degree-day modelling of Greenland ice sheet surface mass balance, 1870-2012 using reanalysis data. Journal of Glaciology, 63, 176-193, doi:10.1017/jog.2016.133.
- Winski, D., and Coauthors, 2017: Industrial-age doubling of snow accumulation in the Alaska Range linked to tropical ocean warming. Scientific Reports, 7, doi:10.1038/s41598-017-18022-5.
- Woodworth, P. L., M. A. M. Maqueda, W. R. Gehrels, V. M. Roussenov, R. G. Williams, and C. W. Hughes, 2017: Variations in the difference between mean sea level measured either side of Cape Hatteras and their relation to the North Atlantic Oscillation. Climate Dynamics, 49, 2451-2469, doi:10.1007/s00382-016-3464-1.
- Wunderlich, F., and D. M. Mitchell, 2017: Revisiting the observed surface climate response to large volcanic eruptions. Atmospheric Chemistry and Physics, 17, 485-499, doi:10.5194/acp-17-485-2017.
- Xu, K., R. X. Huang, W. Q. Wang, C. W. Zhu, and R. Y. Lu, 2017: Thermocline Fluctuations in the Equatorial Pacific Related to the Two Types of El Nino Events. J. Clim., 30, 6611-6627, doi:10.1175/jcli-d-16-0291.1.
- Yang, C. X., S. Masina, and A. Storto, 2017: Historical ocean reanalyses (1900-2010) using different data assimilation strategies. Quarterly Journal of the Royal Meteorological Society, 143, 479-493, doi:10.1002/qj.2936.
- Yang, E. G., and H. M. Kim, 2017: Evaluation of a Regional Reanalysis and ERA-Interim over East Asia Using In Situ Observations during 2013-14. Journal of Applied Meteorology and Climatology, 56, 2821-2844, doi:10.1175/jamc-d-16-0227.1.
- Yang, L., M. F. Liu, J. A. Smith, and F. Q. Tian, 2017: Typhoon Nina and the August 1975 Flood over Central China. Journal of Hydrometeorology, 18, 451-472, doi:10.1175/jhm-d-16-0152.1.
- Yao, Y., Z. Zhong, X. Q. Yang, and W. Lu, 2017: An observational study of the North Pacific storm-track impact on the midlatitude oceanic front. Journal of Geophysical Research-Atmospheres, 122, 6962-6975, doi:10.1002/2016jd026192.
- You, Q. L., Z. H. Jiang, G. W. K. Moore, Y. T. Bao, L. Kong, and S. C. Kang, 2017: Revisiting the Relationship between Observed Warming and Surface Pressure in the Tibetan Plateau. J. Clim., 30, 1721-1737, doi:10.1175/jcli-d-15-0834.1.
- Yu, L. J., and Coauthors, 2017: Possible connections of the opposite trends in Arctic and Antarctic sea-ice cover. Scientific Reports, 7, doi:10.1038/srep45804.
- Yu, L. S., X. Z. Jin, S. A. Josey, T. Lee, A. Kumar, C. H. Wen, and Y. Xue, 2017: The Global Ocean Water Cycle in Atmospheric Reanalysis, Satellite, and Ocean Salinity. J. Clim., 30, 3829-3852, doi:10.1175/jcli-d-16-0479.1.
- Yu, P. L., L. F. Zhang, H. Liu, X. Liu, and J. Zhu, 2017: A dual-period response of the Kuroshio Extension SST to Aleutian Low activity in the winter season. Acta Oceanologica Sinica, 36, 1-9, doi:10.1007/s13131-017-1104-1.
- Yuchechen, A. E., and P. O. Canziani, 2017: A comparison between thermal tropopauses derived from mandatory and significant levels for the Indian subcontinent upper-air network. Atmospheric Science Letters, 18, 207-214, doi:10.1002/asl.743.
- Zahid, M., R. Blender, V. Lucarini, and M. C. Bramati, 2017: Return levels of temperature extremes in southern Pakistan. Earth System Dynamics, 8, 1263-1278, doi:10.5194/esd-8-1263-2017.
- Zampieri, M., A. Toreti, A. Schindler, E. Scoccimarro, and S. Gualdi, 2017: Atlantic multi-decadal oscillation influence on weather regimes over Europe and the Mediterranean in spring and summer. Global and Planetary Change, 151, 92-100, doi:10.1016/j.gloPlacha.2016.08.014.
- Zerbini, S., F. Raicich, C. M. Prati, S. Bruni, S. Del Conte, M. Errico, and E. Santi, 2017: Sea-level change in the Northern Mediterranean Sea from long-period tide gauge time series. Earth-Science Reviews, 167, 72-87, doi:10.1016/j.earscirev.2017.02.009.
- Zhang, L., T. Li, and M. M. Lu, 2017: Surface wind energy trends near Taiwan in winter since 1871. Terrestrial Atmospheric and Oceanic Sciences, 28, 295-302, doi:10.3319/tao.2016.04.29.01(a).
- Zhang, L., T. Rechtman, K. B. Karnauskas, L. F. Li, J. P. Donnelly, and J. P. Kossin, 2017: Longwave emission trends over Africa and implications for Atlantic hurricanes. Geophysical Research Letters, 44, 9075-9083, doi:10.1002/2017gl073869.
- Zhang, L. P., T. L. Delworth, and F. R. Zeng, 2017: The impact of multidecadal Atlantic meridional overturning circulation variations on the Southern Ocean. Climate Dynamics, 48, 2065-2085, doi:10.1007/s00382-016-3190-8.
- Zhang, P., M. Ionita, G. Lohmann, D. L. Chen, and H. W. Linderholm, 2017: Can tree-ring density data reflect summer temperature extremes and associated circulation patterns over Fennoscandia? Climate Dynamics, 49, 2721-2736, doi:10.1007/s00382-016-3452-5.
- Zhang, P., Z. W. Wu, and H. Chen, 2017: Interdecadal Variability of the ENSO-North Pacific Atmospheric Circulation in Winter. Atmosphere-Ocean, 55, 110-120, doi:10.1080/07055900.2017.1291411.
- Zhang, Q., and Z. Guan, 2017: Interdecadal Change in the Eurasia-Pacific Anti-Phase Relation of Atmospheric Mass and Its Possible Link with PDO. Journal of Meteorological Research, 31, 126-141, doi:10.1007/s13351-017-6079-5.
- Zhang, Y. Q., Q. L. You, C. C. Chen, and X. Li, 2017: Flash droughts in a typical humid and subtropical basin: A case study in the Gan River Basin, China. Journal of Hydrology, 551, 162-176, doi:10.1016/j.jhydrol.2017.05.044.
- Zhao, L., J. S. Wang, H. W. Liu, and Z. N. Xiao, 2017: Amplification of the Solar Signal in the Summer Monsoon Rainband in China by Synergistic Actions of Different Dynamical Responses. Journal of Meteorological Research, 31, 61-72, doi:10.1007/s13351-016-6046-6.
- Zhu, J., D. Q. Huang, P. W. Yan, Y. Huang, and X. Y. Kuang, 2017: Can reanalysis datasets describe the persistent temperature and precipitation extremes over China? Theoretical and Applied Climatology, 130, 655-671, doi:10.1007/s00704-016-1912-9.
- Zhu, Z. W., and T. Li, 2017: The Record-Breaking Hot Summer in 2015 over Hawaii and Its Physical Causes. J. Clim., 30, 4253-4266, doi:10.1175/jcli-d-16-0438.1.
- Zhu, Z. W., and T. Li, 2017: The statistical extended-range (10-30-day) forecast of summer rainfall anomalies over the entire China. Climate Dynamics, 48, 209-224, doi:10.1007/s00382-016-3070-2.
- Zolina, O., A. Dufour, S. K. Gulev, and G. Stenchikov, 2017: Regional Hydrological Cycle over the Red Sea in ERA-Interim. Journal of Hydrometeorology, 18, 65-83, doi:10.1175/jhm-d-16-0048.1.
2016
- Allan, R., and Coauthors, 2016: Toward integrated historical climate research: the example of Atmospheric Circulation Reconstructions over the Earth. Wiley Interdisciplinary Reviews-Climate Change, 7, 164-174, doi:10.1002/wcc.379.
- Anderson, B. T., D. J. S. Gianotti, J. C. Furtado, and E. Di Lorenzo, 2016: A decadal precession of atmospheric pressures over the North Pacific. Geophysical Research Letters, 43, 3921-3927, doi:10.1002/2016GL068206.
- Anderson, B. T., D. J. S. Gianotti, G. Salvucci, and J. Furtado, 2016: Dominant Time Scales of Potentially Predictable Precipitation Variations across the Continental United States. J. Clim., 29, 8881-8897, doi:10.1175/JCLI-D-15-0635.1.
- Ashcroft, L., J. Gergis, and D. J. Karoly, 2016: Long-term stationarity of El Nino-Southern Oscillation teleconnections in southeastern Australia. Climate Dynamics, 46, 2991-3006, doi:10.1007/s00382-015-2746-3.
- Axell, L., and Y. Liu, 2016: Application of 3-D ensemble variational data assimilation to a Baltic Sea reanalysis 1989-2013. Tellus Series a-Dynamic Meteorology and Oceanography, 68, doi:10.3402/tellusa.v68.24220.
- Bach, L., C. Schraff, J. D. Keller, and A. Hense, 2016: Towards a probabilistic regional reanalysis system for Europe: evaluation of precipitation from experiments. Tellus Series a-Dynamic Meteorology and Oceanography, 68, doi:10.3402/tellusa.v68.32209. Ban, R. J., 2016: NEXT GENERATION EARTH SYSTEM PREDICTION STRATEGIES FOR SUBSEASONAL TO SEASONAL FORECASTS Preface. Next Generation Earth System Prediction: Strategies for Subseasonal to Seasonal Forecasts, XI-+.
- Bantges, R. J., H. E. Brindley, X. H. Chen, X. L. Huang, J. E. Harries, and J. E. Murray, 2016: On the Detection of Robust Multidecadal Changes in Earth's Outgoing Longwave Radiation Spectrum. J. Clim., 29, 4939-4947, doi:10.1175/JCLI-D-15-0713.1.
- Bartoszek, K., and D. Skiba, 2016: Circulation types classification for hourly precipitation events in Lublin (East Poland). Open Geosciences, 8, 214-230, doi:10.1515/geo-2016-0019.
- Batte, L., and M. Deque, 2016: Randomly correcting model errors in the ARPEGE-Climate v6.1 component of CNRM-CM: applications for seasonal forecasts. Geoscientific Model Development, 9, 2055-2076, doi:10.5194/gmd-9-2055-2016.
- Beal, L. M., and S. Elipot, 2016: Broadening not strengthening of the Agulhas Current since the early 1990s. Nature, 540, 570-+, doi:10.1038/nature19853.
- Befort, D. J., S. Wild, T. Kruschke, U. Ulbrich, and G. C. Leckebusch, 2016: Different long-term trends of extra-tropical cyclones and windstorms in ERA-20C and NOAA-20CR reanalyses. Atmospheric Science Letters, 17, 586-595, doi:10.1002/asl.694.
- Behnke, R., S. Vavrus, A. Allstadt, T. Albright, W. E. Thogmartin, and V. C. Radeloff, 2016: Evaluation of downscaled, gridded climate data for the - conterminous United States. Ecol Appl, 26, 1338-1351, doi:10.1002/15-1061.
- Bierstedt, S. E., B. Huenicke, E. Zorita, S. Wagner, and J. J. Gomez-Navarro, 2016: Variability of daily winter wind speed distribution over Northern Europe during the past millennium in regional and global climate simulations. Climate of the Past, 12, 317-338, doi:10.5194/cp-12-317-2016.
- Bodini, N., J. K. Lundquist, D. Zardi, and M. Handschy, 2016: Year-to-year correlation, record length, and overconfidence in wind resource assessment. Wind Energy Science, 1, 115-128, doi:10.5194/wes-1-115-2016.
- Boisier, J. P., R. Rondanelli, R. D. Garreaud, and F. Munoz, 2016: Anthropogenic and natural contributions to the Southeast Pacific precipitation decline and recent megadrought in central Chile. Geophysical Research Letters, 43, 413-421, doi:10.1002/2015GL067265.
- Boudou, M., M. Lang, F. Vinet, and D. Coeur, 2016: Comparative hazard analysis of processes leading to remarkable flash floods (France, 1930-1999). Journal of Hydrology, 541, 533-552, doi:10.1016/j.jhydrol.2016.05.032.
- Brigode, P., F. Brissette, A. Nicault, L. Perreault, A. Kuentz, T. Mathevet, and J. Gailhard, 2016: Streamflow variability over the 1881-2011 period in northern Quebec: comparison of hydrological reconstructions based on tree rings and geopotential height field reanalysis. Climate of the Past, 12, 1785-1804, doi:10.5194/cp-12-1785-2016.
- Bronnimann, S., and Coauthors, 2016: Multidecadal variations of the effects of the Quasi-Biennial Oscillation on the climate system. Atmospheric Chemistry and Physics, 16, 15529-15543, doi:10.5194/acp-16-15529-2016.
- Browning, S. A., and I. D. Goodwin, 2016: Large-scale drivers of Australian East Coast Cyclones since 1851. Journal of Southern Hemisphere Earth Systems Science, 66, 125-151, doi:Burcea, S., R. Cica, and R. Bojariu, 2016: Hail Climatology and Trends in Romania: 1961-2014. Monthly Weather Review, 144, 4289-4299, doi:10.1175/MWR-D-16-0126.1.
- Caillouet, L., J.-P. Vidal, E. Sauquet, and B. Graff, 2016: Probabilistic precipitation and temperature downscaling of the Twentieth Century Reanalysis over France. Climate of the Past, 12, 635-662, doi:10.5194/cp-12-635-2016.
- Campanico, H., P. M. M. Soares, P. Hollmuller, and R. M. Cardoso, 2016: Climatic cooling potential and building cooling demand savings: High resolution spatiotemporal analysis of direct ventilation and evaporative cooling for the Iberian Peninsula. Renewable Energy, 85, 766-776, doi:10.1016/j.renene.2015.07.038.
- Cao, J., S. Gui, Q. Su, and Y. Yang, 2016: The Variability of the Indian-East Asian Summer Monsoon Interface in Relation to the Spring Seesaw Mode between the Indian Ocean and the Central-Western Pacific. J. Clim., 29, 5027-5040, doi:10.1175/JCLI-D-15-0839.1.
- Capa-Morocho, M., B. Rodriguez-Fonseca, and M. Ruiz-Ramos, 2016: Sea surface temperature impacts on winter cropping systems in the Iberian Peninsula. Agricultural and Forest Meteorology, 226, 213-228, doi:10.1016/j.agrformet.2016.06.007.
- Capa-Morocho, M., B. Rodriguez-Fonseca, and M. Ruiz-Ramos, 2016: El Nino influence on potential maize yield in Iberian Peninsula. International Journal of Climatology, 36, 1313-1330, doi:10.1002/joc.4426.
- Carril, A. F., and Coauthors, 2016: Extreme events in the La Plata basin: a retrospective analysis of what we have learned during CLARIS-LPB project. Climate Research, 68, 95-116, doi:10.3354/cr01374.
- Cauquoin, A., P. Jean-Baptiste, C. Risi, E. Fourre, and A. Landais, 2016: Modeling the global bomb tritium transient signal with the AGCM LMDZ-iso: A method to evaluate aspects of the hydrological cycle. Journal of Geophysical Research-Atmospheres, 121, 12612-12629, doi:10.1002/2016JD025484.
- Chafik, L., and Coauthors, 2016: Global linkages originating from decadal oceanic variability in the subpolar North Atlantic. Geophysical Research Letters, 43, 10909-10919, doi:10.1002/2016GL071134.
- Chen, D., H.-J. Wang, S. Yang, and Y. Gao, 2016: A multidecadal oscillation in the northeastern Pacific. Atmospheric and Oceanic Science Letters, 9, 315-326, doi:10.1080/16742834.2016.1194716.
- Chen, J.-M., P.-H. Tan, C.-F. Shih, and H.-S. Chen, 2016: Large-Scale Processes Associated with Inter-Decadal and Inter-Annual Early Spring Rainfall Variability in Taiwan. Terrestrial Atmospheric and Oceanic Sciences, 27, 87-98, doi:10.3319/TAO.2015.06.17.01(A).
- Chervenkov, H., I. Tsonevsky, and K. Slavov, 2016: Drought Events Assessment and Trend Estimation - Results from the Analysis of Long-Term Time Series of the Standardized Precipitation Index. Comptes Rendus De L Academie Bulgare Des Sciences, 69, 983-994, doi:Ciarlo, J. M., and N. J. Aquilina, 2016: An analysis of teleconnections in the Mediterranean region using RegCM4. International Journal of Climatology, 36, 797-808, doi:10.1002/joc.4383.
- Comas-Bru, L., F. McDermott, and M. Werner, 2016: The effect of the East Atlantic pattern on the precipitation delta O-18-NAO relationship in Europe. Climate Dynamics, 47, 2059-2069, doi:10.1007/s00382-015-2950-1.
- Corella, J. P., B. L. Valero-Garces, S. M. Vicente-Serrano, A. Brauer, and G. Benito, 2016: Three millennia of heavy rainfalls in Western Mediterranean: frequency, seasonality and atmospheric drivers. Scientific Reports, 6, doi:10.1038/srep38206.
- Dafka, S., E. Xoplaki, A. Toreti, P. Zanis, E. Tyrlis, C. Zerefos, and J. Luterbacher, 2016: The Etesians: from observations to reanalysis. Climate Dynamics, 47, 1569-1585, doi:10.1007/s00382-015-2920-7.
- Dangendorf, S., A. Arns, J. G. Pinto, P. Ludwig, and J. Jensen, 2016: The exceptional influence of storm 'Xaver' on design water levels in the German Bight. Environmental Research Letters, 11, doi:10.1088/1748-9326/11/5/054001.
- Dell'Aquila, A., and Coauthors, 2016: Benchmarking Northern Hemisphere midlatitude atmospheric synoptic variability in centennial reanalysis and numerical simulations. Geophysical Research Letters, 43, 5442-5449, doi:10.1002/2016GL068829.
- Deser, C., L. Terray, and A. S. Phillips, 2016: Forced and Internal Components of Winter Air Temperature Trends over North America during the past 50 Years: Mechanisms and Implications. J. Clim., 29, 2237-2258, doi:10.1175/JCLI-D-15-0304.1.
- Diaz, H. F., E. R. Wahl, E. Zorita, T. W. Giambelluca, and J. K. Eischeid, 2016: A Five-Century Reconstruction of Hawaiian Islands Winter Rainfall. J. Clim., 29, 5661-5674, doi:10.1175/JCLI-D-15-0815.1.
- Diaz-Argandona, J., A. Ezcurra, J. Saenz, G. Ibarra-Berastegi, and I. Errasti, 2016: Climatology and temporal evolution of the atmospheric semidiurnal tide in present-day reanalyses. Journal of Geophysical Research-Atmospheres, 121, 4614-4626, doi:10.1002/2015JD024513.
- Dieppois, B., B. Pohl, M. Rouault, M. New, D. Lawler, and N. Keenlyside, 2016: Interannual to interdecadal variability of winter and summer southern African rainfall, and their teleconnections. Journal of Geophysical Research-Atmospheres, 121, 6215-6239, doi:10.1002/2015JD024576.
- Dima, M., and M. Voiculescu, 2016: Global patterns of solar influence on high cloud cover. Climate Dynamics, 47, 667-678, doi:10.1007/s00382-015-2862-0.
- Ding, R., J. Li, Y.-h. Tseng, K.-J. Ha, S. Zhao, and J.-Y. Lee, 2016: Interdecadal change in the lagged relationship between the Pacific-South American pattern and ENSO. Climate Dynamics, 47, 2867-2884, doi:10.1007/s00382-016-3002-1.
- Dirmeyer, P. A., and Coauthors, 2016: Confronting Weather and Climate Models with Observational Data from Soil Moisture Networks over the United States. Journal of Hydrometeorology, 17, 1049-1067, doi:10.1175/JHM-D-15-0196.1.
- Dolinar, E. K., X. Dong, and B. Xi, 2016: Evaluation and intercomparison of clouds, precipitation, and radiation budgets in recent reanalyses using satellite-surface observations. Climate Dynamics, 46, 2123-2144, doi:10.1007/s00382-015-2693-z.
- Donat, M. G., L. V. Alexander, N. Herold, and A. J. Dittus, 2016: Temperature and precipitation extremes in century-long gridded observations, reanalyses, and atmospheric model simulations. Journal of Geophysical Research-Atmospheres, 121, 11174-11189, doi:10.1002/2016JD025480.
- Donat, M. G., A. D. King, J. T. Overpeck, L. V. Alexander, I. Durre, and D. J. Karoly, 2016: Extraordinary heat during the 1930s US Dust Bowl and associated large-scale conditions. Climate Dynamics, 46, 413-426, doi:10.1007/s00382-015-2590-5. Dong, W., J. Huang, Y. Guo, and F. Ren, 2016: Data and Methods. Atlas of Climate Change: Responsibility and Obligation of Human Society, 1-7.
- Dong, X., and F. Xue, 2016: Phase Transition of the Pacific Decadal Oscillation and Decadal Variation of the East Asian Summer Monsoon in the 20th Century. Advances in Atmospheric Sciences, 33, 330-338, doi:10.1007/s00376-015-5130-7.
- Dufour, A., O. Zolina, and S. K. Gulev, 2016: Atmospheric Moisture Transport to the Arctic: Assessment of Reanalyses and Analysis of Transport Components. J. Clim., 29, 5061-5081, doi:10.1175/JCLI-D-15-0559.1.
- Dunn, R. J. H., K. M. Willett, D. E. Parker, and L. Mitchell, 2016: Expanding HadISD: quality-controlled, sub-daily station data from 1931. Geoscientific Instrumentation Methods and Data Systems, 5, doi:10.5194/gi-5-473-2016.
- Edvardsson, J., F. Adolphi, H. W. Linderholm, C. Corona, R. Muscheler, and M. Stoffel, 2016: Periodicities in mid- to late-Holocene peatland hydrology identified from Swedish and Lithuanian tree-ring data. Quaternary Science Reviews, 137, 200-208, doi:10.1016/j.quascirev.2016.02.020.
- Emery, C. M., S. Biancamaria, A. Boone, P.-A. Garambois, S. Ricci, M. C. Rochoux, and B. Decharme, 2016: Temporal Variance-Based Sensitivity Analysis of the River-Routing Component of the Large-Scale Hydrological Model ISBA-TRIP: Application on the Amazon Basin. Journal of Hydrometeorology, 17, 3007-3027, doi:10.1175/JHM-D-16-0050.1.
- Evan, A. T., C. Flamant, M. Gaetani, and F. Guichard, 2016: The past, present and future of African dust. Nature, 531, 493-+, doi:10.1038/nature17149.
- Eyring, V., and Coauthors, 2016: ESMValTool (v1.0) - a community diagnostic and performance metrics tool for routine evaluation of Earth system models in CMIP. Geoscientific Model Development, 9, 1747-1802, doi:10.5194/gmd-9-1747-2016.
- Fang, M., and X. Li, 2016: Paleoclimate data assimilation: Its motivation, progress and prospects. Science China-Earth Sciences, 59, 1817-1826, doi:10.1007/s11430-015-5432-6.
- Faranda, D., M. C. Alvarez-Castro, and P. Yiou, 2016: Return times of hot and cold days via recurrences and extreme value theory. Climate Dynamics, 47, 3803-3815, doi:10.1007/s00382-016-3042-6.
- Finkenbinder, M. S., M. B. Abbott, and B. A. Steinman, 2016: Holocene climate change in Newfoundland reconstructed using oxygen isotope analysis of lake sediment cores. Global and Planetary Change, 143, 251-261, doi:10.1016/j.gloplacha.2016.06.014.
- Fleming, L. E., and K. J. Anchukaitis, 2016: North Pacific decadal variability in the CMIP5 last millennium simulations. Climate Dynamics, 47, 3783-3801, doi:10.1007/s00382-016-3041-7.
- Fogt, R. L., C. A. Goergens, M. E. Jones, G. A. Witte, M. Y. Lee, and J. M. Jones, 2016: Antarctic station-based seasonal pressure reconstructions since 1905: 1. Reconstruction evaluation. Journal of Geophysical Research-Atmospheres, 121, 2814-2835, doi:10.1002/2015JD024564.
- Fogt, R. L., J. M. Jones, C. A. Goergens, M. E. Jones, G. A. Witte, and M. Y. Lee, 2016: Antarctic station-based seasonal pressure reconstructions since 1905: 2. Variability and trends during the twentieth century. Journal of Geophysical Research-Atmospheres, 121, 2836-2856, doi:10.1002/2015JD024565.
- Francois, B., 2016: Influence of winter North-Atlantic Oscillation on Climate-Related Energy penetration in Europe. Renewable Energy, 99, 602-613, doi:10.1016/j.renene.2016.07.010.
- Francois, B., B. Hingray, D. Raynaud, M. Borga, and J. D. Creutin, 2016: Increasing climate-related-energy penetration by integrating run-of-the river hydropower to wind/solar mix. Renewable Energy, 87, 686-696, doi:10.1016/j.renene.2015.10.064.
- Frederikse, T., R. Riva, M. Kleinherenbrink, Y. Wada, M. van den Broeke, and B. Marzeion, 2016: Closing the sea level budget on a regional scale: Trends and variability on the Northwestern European continental shelf. Geophysical Research Letters, 43, 10864-10872, doi:10.1002/2016GL070750.
- Fredriksen, H.-B., and K. Rypdal, 2016: Spectral Characteristics of Instrumental and Climate Model Surface Temperatures. J. Clim., 29, 1253-1268, doi:10.1175/JCLI-D-15-0457.1.
- Fuentes-Franco, R., F. Giorgi, E. Coppola, and F. Kucharski, 2016: The role of ENSO and PDO in variability of winter precipitation over North America from twenty first century CMIP5 projections. Climate Dynamics, 46, 3259-3277, doi:10.1007/s00382-015-2767-y.
- Gao, Y., P.-C. Hsu, and H.-H. Hsu, 2016: Assessments of surface latent heat flux associated with the Madden-Julian Oscillation in reanalyses. Climate Dynamics, 47, 1755-1774, doi:10.1007/s00382-015-2931-4.
- Gibson, P. B., S. E. Perkins-Kirkpatrick, and J. A. Renwick, 2016: Projected changes in synoptic weather patterns over New Zealand examined through self-organizing maps. International Journal of Climatology, 36, 3934-3948, doi:10.1002/joc.4604.
- Gibson, P. B., P. Uotila, S. E. Perkins-Kirkpatrick, L. V. Alexander, and A. J. Pitman, 2016: Evaluating synoptic systems in the CMIP5 climate models over the Australian region. Climate Dynamics, 47, 2235-2251, doi:10.1007/s00382-015-2961-y.
- Giese, B. S., H. F. Seidel, G. P. Compo, and P. D. Sardeshmukh, 2016: An ensemble of ocean reanalyses for 1815-2013 with sparse observational input. Journal of Geophysical Research-Oceans, 121, 6891-6910, doi:10.1002/2016JC012079.
- Glovin, G. M., T. E. Arbetter, and A. H. Lynch, 2016: Wavelet analysis of polar vortex variability over the twentieth century. Journal of Geophysical Research-Atmospheres, 121, 722-732, doi:10.1002/2014JD022971.
- Grotjahn, R., and Coauthors, 2016: North American extreme temperature events and related large scale meteorological patterns: a review of statistical methods, dynamics, modeling, and trends. Climate Dynamics, 46, 1151-1184, doi:10.1007/s00382-015-2638-6.
- Guo, Y., J. Cao, H. Li, J. Wang, and Y. Ding, 2016: Simulation of the Interface between the Indian Summer Monsoon and the East Asian Summer Monsoon: Intercomparison between MPI-ESM and ECHAM5/MPI-OM. Advances in Atmospheric Sciences, 33, 294-308, doi:10.1007/s00376-015-5073-z.
- Guo, Y., J. Li, J. Feng, F. Xie, C. Sun, and J. Zheng, 2016: The Multidecadal Variability of the Asymmetric Mode of the Boreal Autumn Hadley Circulation and Its Link to the Atlantic Multidecadal Oscillation. J. Clim., 29, 5625-5641, doi:10.1175/JCLI-D-15-0025.1.
- Guo, Y., S. Zhang, J. Yan, Z. Chen, and X. Ruan, 2016: A comparison of atmospheric temperature over China between radiosonde observations and multiple reanalysis datasets. Journal of Meteorological Research, 30, 242-257, doi:10.1007/s13351-016-5169-0.
- Haigh, I. D., and Coauthors, 2016: Analysis: Spatial and temporal analysis of extreme sea level and storm surge events around the coastline of the UK. Scientific Data, 3, doi:10.1038/sdata.2016.107.
- Hakim, G. J., and Coauthors, 2016: The lastmillennium climate reanalysis project: Framework and first results. Journal of Geophysical Research-Atmospheres, 121, 6745-6764, doi:10.1002/2016JD024751.
- Halder, S., S. K. Saha, P. A. Dirmeyer, T. N. Chase, and B. N. Goswami, 2016: Investigating the impact of land-use land-cover change on Indian summer monsoon daily rainfall and temperature during 1951-2005 using a regional climate model. Hydrology and Earth System Sciences, 20, 1765-1784, doi:10.5194/hess-20-1765-2016.
- Hanna, E., T. E. Cropper, R. J. Hall, and J. Cappelen, 2016: Greenland Blocking Index 1851-2015: a regional climate change signal. International Journal of Climatology, 36, 4847-4861, doi:10.1002/joc.4673.
- Harada, Y., and Coauthors, 2016: The JRA-55 Reanalysis: Representation of Atmospheric Circulation and Climate Variability. Journal of the Meteorological Society of Japan, 94, 269-302, doi:10.2151/jmsj.2016-015.
- Harel, M. A., S. M. Mudd, and M. Attal, 2016: Global analysis of the stream power law parameters based on worldwide Be-10 denudation rates. Geomorphology, 268, 184-196, doi:10.1016/j.geomorph.2016.05.035.
- Harrington, L. J., P. B. Gibson, S. M. Dean, D. Mitchell, S. M. Rosier, and D. J. Frame, 2016: Investigating event-specific drought attribution using self-organizing maps. Journal of Geophysical Research-Atmospheres, 121, 12766-12780, doi:10.1002/2016JD025602.
- Hatchett, B. J., D. P. Boyle, C. B. Garner, M. L. Kaplan, A. E. Putnam, and S. D. Bassett, 2016: Magnitude and frequency of wet years under a megadrought climate in the western Great Basin, USA. Quaternary Science Reviews, 152, 197-202, doi:10.1016/j.quascirev.2016.09.017.
- He, S., and H. Wang, 2016: Linkage between the East Asian January temperature extremes and the preceding Arctic Oscillation. International Journal of Climatology, 36, 1026-1032, doi:10.1002/joc.4399.
- He, Y.-C., H. Drange, Y. Gao, and M. Bentsen, 2016: Simulated Atlantic Meridional Overturning Circulation in the 20th century with an ocean model forced by reanalysis-based atmospheric data sets. Ocean Modelling, 100, 31-48, doi:10.1016/j.ocemod.2015.12.011.
- Hernandez, A., H. Kutiel, R. M. Trigo, M. A. Valente, J. Sigro, T. Cropper, and F. E. Santo, 2016: New Azores archipelago daily precipitation dataset and its links with large-scale modes of climate variability. International Journal of Climatology, 36, 4439-4454, doi:10.1002/joc.4642.
- Herold, N., L. V. Alexander, M. G. Donat, S. Contractor, and A. Becker, 2016: How much does it rain over land? Geophysical Research Letters, 43, 341-348, doi:10.1002/2015GL066615.
- Hoy, A., O. Katel, P. Thapa, N. Dendup, and J. Matschullat, 2016: Climatic changes and their impact on socio-economic sectors in the Bhutan Himalayas: an implementation strategy. Regional Environmental Change, 16, 1401-1415, doi:10.1007/s10113-015-0868-0.
- Huang, J., M. Ji, Y. Xie, S. Wang, Y. He, and J. Ran, 2016: Global semi-arid climate change over last 60 years. Climate Dynamics, 46, 1131-1150, doi:10.1007/s00382-015-2636-8.
- Huang, W., B. Wang, and J. S. Wright, 2016: A potential vorticity-based index for the East Asian winter monsoon. Journal of Geophysical Research-Atmospheres, 121, 9382-9399, doi:10.1002/2016JD025053. Ishida, K., and M. L. Kavvas, 2016: Climate Change Analysis on Historical Precipitation over Mountainous Watersheds by Means of Dynamical Downscaling of Long-Term Reanalysis. World Environmental and Water Resources Congress 2016: Hydraulics and Waterways and Hydro-Climate/Climate Change, 626-632.
- Jackson, D. L., M. Hughes, and G. A. Wick, 2016: Evaluation of landfalling atmospheric rivers along the US West Coast in reanalysis data sets. Journal of Geophysical Research-Atmospheres, 121, 2705-2718, doi:10.1002/2015JD024412.
- Jacques, A. A., J. D. Horel, E. T. Crosman, F. Vernon, and J. Tytell, 2016: The Earthscope US transportable array 1 Hz surface pressure dataset. Geoscience Data Journal, 3, 29-36, doi:10.1002/gdj3.37.
- Jacques-Coper, M., S. Broennimann, O. Martius, C. Vera, and B. Cerne, 2016: Summer heat waves in southeastern Patagonia: an analysis of the intraseasonal timescale. International Journal of Climatology, 36, 1359-1374, doi:10.1002/joc.4430.
- Jarvinen, H., T. Seitola, J. Silen, and J. Raisanen, 2016: Multi-annual modes in the 20th century temperature variability in reanalyses and CMIP5 models. Geoscientific Model Development, 9, 4097-4109, doi:10.5194/gmd-9-4097-2016.
- Jia, F., L. Wu, B. Gan, and W. Cai, 2016: Global Warming Attenuates the Tropical Atlantic-Pacific Teleconnection. Scientific Reports, 6, doi:10.1038/srep20078.
- Jones, P., 2016: The Reliability of Global and Hemispheric Surface Temperature Records. Advances in Atmospheric Sciences, 33, 269-282, doi:10.1007/s00376-015-5194-4.
- Jones, P. D., and Coauthors, 2016: Long-term trends in precipitation and temperature across the Caribbean. International Journal of Climatology, 36, 3314-3333, doi:10.1002/joc.4557.
- Jones, P. D., C. Harpham, and D. Lister, 2016: Long-term trends in gale days and storminess for the Falkland Islands. International Journal of Climatology, 36, 1413-1427, doi:10.1002/joc.4434.
- Jourdain, N. C., M. Lengaigne, J. Vialard, T. Izumo, and A. Sen Gupta, 2016: Further Insights on the Influence of the Indian Ocean Dipole on the Following Year's ENSO from Observations and CMIP5 Models. J. Clim., 29, 637-658, doi:10.1175/JCLI-D-15-0481.1.
- Kam, J., and J. Sheffield, 2016: Increased Drought and Pluvial Risk over California due to Changing Oceanic Conditions. J. Clim., 29, 8269-8279, doi:10.1175/JCLI-D-15-0879.1.
- Karspeck, A. R., 2016: An Ensemble Approach for the Estimation of Observational Error Illustrated for a Nominal 1 degrees Global Ocean Model. Monthly Weather Review, 144, 1713-1728, doi:10.1175/MWR-D-14-00336.1.
- Kayano, M. T., V. B. Capistrano, R. V. Andreoli, and R. A. F. de Souza, 2016: A further analysis of the tropical Atlantic SST modes and their relations to north-eastern Brazil rainfall during different phases of Atlantic Multidecadal Oscillation. International Journal of Climatology, 36, 4006-4018, doi:10.1002/joc.4610.
- Kern, Z., A. Nemeth, M. H. Gulyas, I. Popa, T. Levanic, and I. G. Hatvani, 2016: Natural proxy records of temperature- and hydroclimate variability with annual resolution from the Northern Balkan-Carpathian region for the past millennium - Review & recalibration. Quaternary International, 415, 109-125, doi:10.1016/j.quaint.2016.01.012.
- Khouakhi, A., and G. Villarini, 2016: On the relationship between atmospheric rivers and high sea water levels along the US West Coast. Geophysical Research Letters, 43, 8815-8822, doi:10.1002/2016GL070086.
- Kim, J., and K.-Y. Kim, 2016: The tropospheric biennial oscillation defined by a biennial mode of sea surface temperature and its impact on the atmospheric circulation and precipitation in the tropical eastern Indo-western Pacific region. Climate Dynamics, 47, 2601-2615, doi:10.1007/s00382-016-2987-9.
- Klotzbach, P. J., E. C. J. Oliver, R. D. Leeper, and C. J. Schreck, III, 2016: The Relationship between the Madden-Julian Oscillation (MJO) and Southeastern New England Snowfall. Monthly Weather Review, 144, 1355-1362, doi:10.1175/MWR-D-15-0434.1.
- Krishnamurthy, L., and V. Krishnamurthy, 2016: Teleconnections of Indian monsoon rainfall with AMO and Atlantic tripole. Climate Dynamics, 46, 2269-2285, doi:10.1007/s00382-015-2701-3.
- Krishnamurthy, L., and V. Krishnamurthy, 2016: Decadal and interannual variability of the Indian Ocean SST. Climate Dynamics, 46, 57-70, doi:10.1007/s00382-015-2568-3.
- Kruschke, T., H. W. Rust, C. Kadow, W. A. Mueller, H. Pohlmann, G. C. Leckebusch, and U. Ulbrich, 2016: Probabilistic evaluation of decadal prediction skill regarding Northern Hemisphere winter storms. Meteorologische Zeitschrift, 25, 721-738, doi:10.1127/metz/2015/0641.
- Kubota, H., Y. Kosaka, and S.-P. Xie, 2016: A 117-year long index of the Pacific-Japan pattern with application to interdecadal variability. International Journal of Climatology, 36, 1575-1589, doi:10.1002/joc.4441.
- Kucharski, F., and Coauthors, 2016: Atlantic forcing of Pacific decadal variability. Climate Dynamics, 46, 2337-2351, doi:10.1007/s00382-015-2705-z.
- Kucharski, F., and Coauthors, 2016: The Teleconnection of the Tropical Atlantic to Indo-Pacific Sea Surface Temperatures on Inter-Annual to Centennial Time Scales: A Review of Recent Findings. Atmosphere, 7, doi:10.3390/atmos7020029.
- Kutta, E., and J. A. Hubbart, 2016: Reconsidering meteorological seasons in a changing climate. Climatic Change, 137, 511-524, doi:10.1007/s10584-016-1704-3.
- Kwon, E. Y., Y. H. Kim, Y.-G. Park, Y.-H. Park, J. Dunne, and K.-I. Chang, 2016: Multidecadal wind-driven shifts in northwest Pacific temperature, salinity, O-2, and PO4. Global Biogeochemical Cycles, 30, 1599-1619, doi:10.1002/2016GB005442.
- Lee, S.-K., A. T. Wittenberg, D. B. Enfield, S. J. Weaver, C. Wang, and R. Atlas, 2016: US regional tornado outbreaks and their links to spring ENSO phases and North Atlantic SST variability. Environmental Research Letters, 11, doi:10.1088/1748-9326/11/4/044008.
- Li, A. K., H. Paek, and J.-Y. Yu, 2016: The changing influences of the AMO and PDO on the decadal variation of the Santa Ana winds. Environmental Research Letters, 11, doi:10.1088/1748-9326/11/6/064019.
- Li, B., X. Zhang, and J. E. Smerdon, 2016: Comparison between spatio-temporal random processes and application to climate model data. Environmetrics, 27, 267-279, doi:10.1002/env.2395.
- Lin, J.-S., B. Wu, and T.-J. Zhou, 2016: Is the interdecadal circumglobal teleconnection pattern excited by the Atlantic multidecadal Oscillation? Atmospheric and Oceanic Science Letters, 9, 451-457, doi:10.1080/16742834.2016.1233800.
- Lopez, H., S. Dong, S.-K. Lee, and E. Campos, 2016: Remote influence of Interdecadal Pacific Oscillation on the South Atlantic meridional overturning circulation variability. Geophysical Research Letters, 43, 8250-8258, doi:10.1002/2016GL069067.
- Lopez-Parages, J., B. Rodriguez-Fonseca, D. Dommenget, and C. Frauen, 2016: ENSO influence on the North Atlantic European climate: a non-linear and non-stationary approach. Climate Dynamics, 47, 2071-2084, doi:10.1007/s00382-015-2951-0.
- Lorrey, A. M., and P. R. Chappell, 2016: The "dirty weather" diaries of Reverend Richard Davis: insights about early colonial-era meteorology and climate variability for northern New Zealand, 1839-1851. Climate of the Past, 12, 553-573, doi:10.5194/cp-12-553-2016.
- Ma, S., and T. Zhou, 2016: Robust Strengthening and Westward Shift of the Tropical Pacific Walker Circulation during 1979-2012: A Comparison of 7 Sets of Reanalysis Data and 26 CMIP5 Models. J. Clim., 29, 3097-3118, doi:10.1175/JCLI-D-15-0398.1.
- Magee, A. D., D. C. Verdon-Kidd, and A. S. Kiem, 2016: An intercomparison of tropical cyclone best-track products for the southwest Pacific. Natural Hazards and Earth System Sciences, 16, 1431-1447, doi:10.5194/nhess-16-1431-2016.
- Malherbe, J., B. Dieppois, P. Maluleke, M. Van Staden, and D. L. Pillay, 2016: South African droughts and decadal variability. Natural Hazards, 80, 657-681, doi:10.1007/s11069-015-1989-y.
- Martin-Benito, D., C. C. Ummenhofer, N. Kose, H. T. Guner, and N. Pederson, 2016: Tree-ring reconstructed May-June precipitation in the Caucasus since 1752 CE. Climate Dynamics, 47, 3011-3027, doi:10.1007/s00382-016-3010-1.
- Martineau, P., S.-W. Son, and M. Taguchi, 2016: Dynamical Consistency of Reanalysis Datasets in the Extratropical Stratosphere. J. Clim., 29, 3057-3074, doi:10.1175/JCLI-D-15-0469.1.
- Matthews, T., D. Mullan, R. L. Wilby, C. Broderick, and C. Murphy, 2016: Past and future climate change in the context of memorable seasonal extremes. Clim Risk Manag, 11, 37-52, doi:10.1016/j.crm.2016.01.004.
- Matthews, T., C. Murphy, R. L. Wilby, and S. Harrigan, 2016: A cyclone climatology of the British-Irish Isles 1871-2012. International Journal of Climatology, 36, 1299-1312, doi:10.1002/joc.4425.
- McCusker, K. E., J. C. Fyfe, and M. Sigmond, 2016: Twenty-five winters of unexpected Eurasian cooling unlikely due to Arctic sea-ice loss. Nature Geoscience, 9, 838-+, doi:10.1038/NGEO2820.
- Menezes, V. V., H. E. Phillips, M. L. Vianna, and N. L. Bindoff, 2016: Interannual variability of the South Indian Countercurrent. Journal of Geophysical Research-Oceans, 121, 3465-3487, doi:10.1002/2015JC011417.
- Mikhailova, N. V., and A. V. Yurovsky, 2016: The East Atlantic Oscillation: Mechanism and Impact on the European Climate in Winter. Physical Oceanography, 25-33, doi:10.22449/1573-160X-2016-4-25-33.
- Mikhailova, N. V., A. V. Yurovsky, and А. В. Юровский, 2016: East Atlantic Oscillation: mechanism and impact on the European climate in winter. Physical Oceanography, 27-37, doi:Miksovsky, J., E. Holtanova, and P. Pisoft, 2016: Imprints of climate forcings in global gridded temperature data. Earth System Dynamics, 7, 231-249, doi:10.5194/esd-7-231-2016.
- Mo, K. C., and D. P. Lettenmaier, 2016: Precipitation Deficit Flash Droughts over the United States. Journal of Hydrometeorology, 17, 1169-1184, doi:10.1175/JHM-D-15-0158.1.
- Mohino, E., N. Keenlyside, and H. Pohlmann, 2016: Decadal prediction of Sahel rainfall: where does the skill (or lack thereof) come from? Climate Dynamics, 47, 3593-3612, doi:10.1007/s00382-016-3416-9.
- Moore, G. W. K., 2016: The March 1972 northwest Greenland windstorm: evidence of downslope winds associated with a trapped lee wave. Quarterly Journal of the Royal Meteorological Society, 142, 1428-1438, doi:10.1002/qj.2744.
- Mudd, S. M., M.-A. Harel, M. D. Hurst, S. W. D. Grieve, and S. M. Marrero, 2016: The CAIRN method: automated, reproducible calculation of catchment-averaged denudation rates from cosmogenic nuclide concentrations. Earth Surface Dynamics, 4, 655-674, doi:10.5194/esurf-4-655-2016.
- Mueller Schmied, H., and Coauthors, 2016: Variations of global and continental water balance components as impacted by climate forcing uncertainty and human water use. Hydrology and Earth System Sciences, 20, 2877-2898, doi:10.5194/hess-20-2877-2016.
- Munoz, A. G., J. Diaz-Lobaton, X. Chourio, and M. J. Stock, 2016: Seasonal prediction of lightning activity in North Western Venezuela: Large-scale versus local drivers. Atmospheric Research, 172, 147-162, doi:10.1016/j.atmosres.2015.12.018.
- Naik, M., and B. J. Abiodun, 2016: Potential impacts of forestation on future climate change in Southern Africa. International Journal of Climatology, 36, 4560-4576, doi:10.1002/joc.4652.
- Najafi, M. R., F. W. Zwiers, and N. P. Gillett, 2016: Attribution of the spring snow cover extent decline in the Northern Hemisphere, Eurasia and North America to anthropogenic influence. Climatic Change, 136, 571-586, doi:10.1007/s10584-016-1632-2.
- Nath, D., and Coauthors, 2016: Subtropical Potential Vorticity Intrusion Drives Increasing Tropospheric Ozone over the Tropical Central Pacific. Scientific Reports, 6, doi:10.1038/srep21370.
- Nnamchi, H. C., J. Li, F. Kucharski, I.-S. Kang, N. S. Keenlyside, P. Chang, and R. Farneti, 2016: An Equatorial-Extratropical Dipole Structure of the Atlantic Nino. J. Clim., 29, 7295-7311, doi:10.1175/JCLI-D-15-0894.1.
- Nygard, T., and Coauthors, 2016: Validation of eight atmospheric reanalyses in the Antarctic Peninsula region. Quarterly Journal of the Royal Meteorological Society, 142, 684-692, doi:10.1002/qj.2691. Oki, T., and H. Kim, 2016: Macroscale Hydrological Modeling and Global Water Balance. Terrestrial Water Cycle and Climate Change: Natural and Human-Induced Impacts, 3-16.
- Oliver, E. C. J., 2016: Blind use of reanalysis data: apparent trends in Madden-Julian Oscillation activity driven by observational changes. International Journal of Climatology, 36, 3458-3468, doi:10.1002/joc.4568.
- Ordonez, P., D. Gallego, P. Ribera, C. Pena-Ortiz, and R. Garcia-Herrera, 2016: Tracking the Indian Summer Monsoon Onset Back to the Preinstrument Period. J. Clim., 29, 8115-8127, doi:10.1175/JCLI-D-15-0788.1.
- OrtizBevia, M. J., A. RuizdeElvira, F. J. Alvarez-Garcia, and M. Tasambay-Salazar, 2016: The multidecadal component of the Mediterranean summer variability. Climate Dynamics, 47, 3373-3386, doi:10.1007/s00382-016-3341-y.
- Painter, S. C., M. Finlay, V. S. Hemsley, and A. P. Martin, 2016: Seasonality, phytoplankton succession and the biogeochemical impacts of an autumn storm in the northeast Atlantic Ocean. Prog Oceanogr, 142, 72-104, doi:10.1016/j.pocean.2016.02.001.
- Pal, J., S. Chaudhuri, A. R. Chowdhury, and T. Bandyopadhyay, 2016: Cloud - Aerosol interaction during lightning activity over land and ocean: Precipitation pattern assessment. Asia-Pacific Journal of Atmospheric Sciences, 52, 251-261, doi:10.1007/s13143-015-0087-0.
- Palmer, J. G., and Coauthors, 2016: Changes in El Nino - Southern Oscillation (ENSO) conditions during the Greenland Stadial 1 (GS-1) chronozone revealed by NeW Zealand tree-rings. Quaternary Science Reviews, 153, 139-155, doi:10.1016/j.quascirev.2016.10.003.
- Park, M., Y. Choi, and S.-W. Son, 2016: The Impact of Satellite Observations on Large-Scale Atmospheric Circulation in the Reanalysis Data: A Comparison Between JRA-55 and JRA-55C. Atmosphere-Korea, 26, 523-540, doi:10.14191/Atmos.2016.26.4.523.
- Parker, W. S., 2016: REANALYSES AND OBSERVATIONS What's the Difference? Bulletin of the American Meteorological Society, 97, 1565-+, doi:10.1175/BAMS-D-14-00226.1.
- Peings, Y., G. Simpkins, and G. Magnusdottir, 2016: Multidecadal fluctuations of the North Atlantic Ocean and feedback on the winter climate in CMIP5 control simulations. Journal of Geophysical Research-Atmospheres, 121, 2571-2592, doi:10.1002/2015JD024107.
- Pena-Angulo, D., R. M. Trigo, N. Cortesi, and J. C. Gonzalez-Hidalgo, 2016: The influence of weather types on the monthly average maximum and minimum temperatures in the Iberian Peninsula. Atmospheric Research, 178, 217-230, doi:10.1016/j.atmosres.2016.03.022.
- Pereira, S., A. M. Ramos, J. L. Zezere, R. M. Trigo, and J. M. Vaquero, 2016: Spatial impact and triggering conditions of the exceptional hydro-geomorphological event of December 1909 in Iberia. Natural Hazards and Earth System Sciences, 16, 371-390, doi:10.5194/nhess-16-371-2016.
- Perez-Zanon, N., M. Carmen Casas-Castillo, R. Rodriguez-Sola, J. Carlos Pena, A. Rius, J. German Sole, and A. Redano, 2016: Analysis of extreme rainfall in the Ebre Observatory (Spain). Theoretical and Applied Climatology, 124, 935-944, doi:10.1007/s00704-015-1476-0.
- Piecuch, C. G., S. Dangendorf, R. M. Ponte, and M. Marcos, 2016: Annual Sea Level Changes on the North American Northeast Coast: Influence of Local Winds and Barotropic Motions. J. Clim., 29, 4801-4816, doi:10.1175/JCLI-D-16-0048.1.
- Piecuch, C. G., P. R. Thompson, and K. A. Donohue, 2016: Air pressure effects on sea level changes during the twentieth century. Journal of Geophysical Research-Oceans, 121, 7917-7930, doi:10.1002/2016JC012131.
- Pino, D., and Coauthors, 2016: Meteorological and hydrological analysis of major floods in NE Iberian Peninsula. Journal of Hydrology, 541, 63-89, doi:10.1016/j.jhydrol.2016.02.008.
- Pirloaga, R., and V. Dobrica, 2016: The North Temperate Climate on Long-Term Timescales. Connection to Solar Variability. Romanian Journal of Physics, 61, 1098-1107, doi:Poli, P., and Coauthors, 2016: ERA-20C: An Atmospheric Reanalysis of the Twentieth Century. J. Clim., 29, 4083-4097, doi:10.1175/JCLI-D-15-0556.1.
- Prasanna, V., 2016: South Asian Summer Monsoon Rainfall Variability and Trend: Its Links to Indo-Pacific SST Anomalies and Moist Processes. Pure and Applied Geophysics, 173, 2167-2193, doi:10.1007/s00024-015-1232-5.
- Przybylak, R., P. Wyszynski, O. Nordli, and T. Strzyzewski, 2016: Air temperature changes in Svalbard and the surrounding seas from 1865 to 1920. International Journal of Climatology, 36, 2899-2916, doi:10.1002/joc.4527.
- Qian, W., K. Wu, J. C.-H. Leung, and J. Shi, 2016: Long-term trends of the Polar and Arctic cells influencing the Arctic climate since 1989. Journal of Geophysical Research-Atmospheres, 121, 2679-2690, doi:10.1002/2015JD024252. Quante, M., and Coauthors, 2016: Introduction to the Assessment-Characteristics of the Region. North Sea Region Climate Change Assessment, 1-52.
- Ren, Y., D. Parker, G. Ren, and R. Dunn, 2016: Tempo-spatial characteristics of sub-daily temperature trends in mainland China. Climate Dynamics, 46, 2737-2748, doi:10.1007/s00382-015-2726-7.
- Rimbu, N., M. Czymzik, M. Ionita, G. Lohmann, and A. Brauer, 2016: Atmospheric circulation patterns associated with the variability of River Ammer floods: evidence from observed and proxy data. Climate of the Past, 12, 377-385, doi:10.5194/cp-12-377-2016.
- Rimbu, N., S. Stefan, A. Busuioc, and F. Georgescu, 2016: Links between blocking circulation and precipitation extremes over Romania in summer. International Journal of Climatology, 36, 369-376, doi:10.1002/joc.4353. Robertson, A. W., Y. Kushnir, U. Lall, and J. Nakamura, 2016: Weather and Climatic Drivers of Extreme Flooding Events over the Midwest of the United States. Extreme Events: Observations, Modeling, and Economics, 115-124.
- Robertson, F. R., M. G. Bosilovich, and J. B. Roberts, 2016: Reconciling Land-Ocean Moisture Transport Variability in Reanalyses with P - ET in Observationally Driven Land Surface Models. J. Clim., 29, 8625-8646, doi:10.1175/JCLI-D-16-0379.1.
- Rodwell, M. J., and Coauthors, 2016: Reliability in ensemble data assimilation. Quarterly Journal of the Royal Meteorological Society, 142, 443-454, doi:10.1002/qj.2663.
- Rueda, A., P. Camus, F. J. Mendez, A. Tomas, and A. Luceno, 2016: An extreme value model for maximum wave heights based on weather types. Journal of Geophysical Research-Oceans, 121, 1262-1273, doi:10.1002/2015JC010952.
- Saarni, S., F. Muschitiello, S. Weege, A. Brauer, and T. Saarinen, 2016: A late Holocene record of solar-forced atmospheric blocking variability over Northern Europe inferred from varved lake sediments of Lake Kuninkaisenlampi. Quaternary Science Reviews, 154, 100-110, doi:10.1016/j.quascirev.2016.10.019.
- Saffioti, C., E. M. Fischer, S. C. Scherrer, and R. Knutti, 2016: Reconciling observed and modeled temperature and precipitation trends over Europe by adjusting for circulation variability. Geophysical Research Letters, 43, 8189-8198, doi:10.1002/2016GL069802.
- Saha, M., P. Mitra, and R. S. Nanjundiah, 2016: Autoencoder-based identification of predictors of Indian monsoon. Meteorology and Atmospheric Physics, 128, 613-628, doi:10.1007/s00703-016-0431-7.
- Sasaki, W., 2016: Impact of Satellite Data Assimilation in Atmospheric Reanalysis on the Marine Wind and Wave Climate. J. Clim., 29, 6351-6361, doi:10.1175/JCLI-D-16-0056.1.
- Scherrer, S. C., M. Begert, M. Croci-Maspoli, and C. Appenzeller, 2016: Long series of Swiss seasonal precipitation: regionalization, trends and influence of large-scale flow. International Journal of Climatology, 36, 3673-3689, doi:10.1002/joc.4584.
- Schindelegger, M., D. Einspigel, D. Salstein, and J. Boehm, 2016: The Global S Tide in Earth's Nutation. Surv Geophys, 37, 643-680, doi:10.1007/s10712-016-9365-3.
- Schulte, J. A., R. G. Najjar, and M. Li, 2016: The influence of climate modes on streamflow in the Mid-Atlantic region of the United States. J Hydrol-Reg Stud, 5, 80-99, doi:10.1016/j.ejrh.2015.11.003. Serykh, I. V., 2016: Influence of the North Atlantic dipole on climate changes over Eurasia. International Conference and Early Career Scientists School on Environmental Observations, Modelling and Information Systems.
- Shen, S. S. P., O. Wied, A. Weithmann, T. Regele, B. A. Bailey, and J. H. Lawrimore, 2016: Six temperature and precipitation regimes of the contiguous United States between 1895 and 2010: a statistical inference study. Theoretical and Applied Climatology, 125, 197-211, doi:10.1007/s00704-015-1502-2.
- Si, D., and Y. Ding, 2016: Oceanic Forcings of the Interdecadal Variability in East Asian Summer Rainfall. J. Clim., 29, 7633-7649, doi:10.1175/JCLI-D-15-0792.1.
- Sigmond, M., and J. C. Fyfe, 2016: Tropical Pacific impacts on cooling North American winters. Nature Climate Change, 6, 970-+, doi:10.1038/NCLIMATE3069.
- Simmons, A., J.-L. Fellous, V. Ramaswamy, and K. Trenberth, 2016: Observation and integrated Earth-system science: A roadmap for 2016-2025. Advances in Space Research, 57, 2037-2103, doi:10.1016/j.asr.2016.03.008.
- Siqueira, L., and B. P. Kirtman, 2016: Atlantic near-term climate variability and the role of a resolved Gulf Stream. Geophysical Research Letters, 43, 3964-3972, doi:10.1002/2016GL068694.
- Slater, A. G., 2016: Surface Solar Radiation in North America: A Comparison of Observations, Reanalyses, Satellite, and Derived Products. Journal of Hydrometeorology, 17, 401-420, doi:10.1175/JHM-D-15-0087.1.
- Smith, S. M., 2016: Contributions of recent barometric pressure trends to rates of sea level rise in southeastern Massachusetts (USA). Regional Studies in Marine Science, 8, 41-50, doi:10.1016/j.rsma.2016.09.005.
- Solman, S. A., and I. Orlanski, 2016: Climate Change over the Extratropical Southern Hemisphere: The Tale from an Ensemble of Reanalysis Datasets. J. Clim., 29, 1673-1687, doi:10.1175/JCLI-D-15-0588.1.
- Staehling, E. M., and R. E. Truchelut, 2016: Diagnosing United States hurricane landfall risk: An alternative to count-based methodologies. Geophysical Research Letters, 43, 8798-8805, doi:10.1002/2016GL070117.
- Steinman, B. A., and Coauthors, 2016: Oxygen isotope records of Holocene climate variability in the Pacific Northwest. Quaternary Science Reviews, 142, 40-60, doi:10.1016/j.quascirev.2016.04.012. Stendel, M., and Coauthors, 2016: Recent Change-Atmosphere. North Sea Region Climate Change Assessment, 55-84.
- Storto, A., C. Yang, and S. Masina, 2016: Sensitivity of global ocean heat content from reanalyses to the atmospheric reanalysis forcing: A comparative study. Geophysical Research Letters, 43, 5261-5270, doi:10.1002/2016GL068605.
- Stott, P. A., and Coauthors, 2016: Attribution of extreme weather and climate-related events. Wiley Interdisciplinary Reviews-Climate Change, 7, 23-41, doi:10.1002/wcc.380.
- Stramma, L., R. Czeschel, T. Tanhua, P. Brandt, M. Visbeck, and B. S. Giese, 2016: The flow field of the upper hypoxic eastern tropical North Atlantic oxygen minimum zone. Ocean Science, 12, 153-167, doi:10.5194/os-12-153-2016.
- Stryhal, J., and R. Huth, 2016: Classifications of atmospheric circulation. Geografie, 121, 300-323, doi:Stucki, P., S. Dierer, C. Welker, J. J. Gomez-Navarro, C. C. Raible, O. Martius, and S. Bronnimann, 2016: Evaluation of downscaled wind speeds and parameterised gusts for recent and historical windstorms in Switzerland. Tellus Series a-Dynamic Meteorology and Oceanography, 68, doi:10.3402/tellusa.v68.31820.
- Sun, J., S. Wu, and J. Ao, 2016: Role of the North Pacific sea surface temperature in the East Asian winter monsoon decadal variability. Climate Dynamics, 46, 3793-3805, doi:10.1007/s00382-015-2805-9.
- Takahashi, C., and M. Watanabe, 2016: Pacific trade winds accelerated by aerosol forcing over the past two decades. Nature Climate Change, 6, 768-+, doi:10.1038/NCLIMATE2996.
- Tao, Y., J. Cao, G. Lan, and Q. Su, 2016: The zonal movement of the Indian-East Asian summer monsoon interface in relation to the land-sea thermal contrast anomaly over East Asia. Climate Dynamics, 46, 2759-2771, doi:10.1007/s00382-015-2729-4.
- Tapiador, F. J., A. Behrangi, Z. S. Haddad, D. Katsanos, and M. de Castro, 2016: Disruptions in precipitation cycles: Attribution to anthropogenic forcing. Journal of Geophysical Research-Atmospheres, 121, 2161-2177, doi:10.1002/2015JD023406.
- Thomas, J. A., A. A. Berg, and W. J. Merryfield, 2016: Influence of snow and soil moisture initialization on sub-seasonal predictability and forecast skill in boreal spring. Climate Dynamics, 47, 49-65, doi:10.1007/s00382-015-2821-9.
- Tian, D., M. Pan, L. Jia, G. Vecchi, and E. F. Wood, 2016: Assessing GFDL high-resolution climate model water and energy budgets from AMIP simulations over Africa. Journal of Geophysical Research-Atmospheres, 121, 8444-8459, doi:10.1002/2016JD025068. Titley, D. W., 2016: ATTRIBUTION OF Extreme Weather Events IN THE CONTEXT OF Climate Change Preface. Attribution of Extreme Weather Events in the Context of Climate Change, IX-+.
- Turney, C. S. M., and Coauthors, 2016: Anomalous mid-twentieth century atmospheric circulation change over the South Atlantic compared to the last 6000 years. Environmental Research Letters, 11, doi:10.1088/1748-9326/11/6/064009.
- Turney, C. S. M., and Coauthors, 2016: Intensification of Southern Hemisphere westerly winds 2000-1000 years ago: evidence from the subantarctic Campbell and Auckland Islands (52-50 degrees S). Journal of Quaternary Science, 31, 12-19, doi:10.1002/jqs.2828.
- van den Hurk, B., and Coauthors, 2016: LS3MIP (v1.0) contribution to CMIP6: the Land Surface, Snow and Soil moisture Model Intercomparison Project - aims, setup and expected outcome. Geoscientific Model Development, 9, 2809-2832, doi:10.5194/gmd-9-2809-2016.
- Viana, D. R., and C. A. Sansigolo, 2016: Monthly and Seasonal Rainfall Forecasting in Southern Brazil Using Multiple Discriminant Analysis. Weather Forecast, 31, 1947-1960, doi:10.1175/WAF-D-15-0155.1.
- Vijayakumar, D. B. I. P., F. Raulier, P. Bernier, D. Pare, S. Gauthier, Y. Bergeron, and D. Pothier, 2016: Cover density recovery after fire disturbance controls landscape aboveground biomass carbon in the boreal forest of eastern Canada. Forest Ecology and Management, 360, 170-180, doi:10.1016/j.foreco.2015.10.035.
- Wahl, T., and D. P. Chambers, 2016: Climate controls multidecadal variability in U. S. extreme sea level records. Journal of Geophysical Research-Oceans, 121, 1274-1290, doi:10.1002/2015JC011057.
- Wang, H., S.-P. Xie, H. Tokinaga, Q. Liu, and Y. Kosaka, 2016: Detecting cross-equatorial wind change as a fingerprint of climate response to anthropogenic aerosol forcing. Geophysical Research Letters, 43, 3444-3450, doi:10.1002/2016GL068521.
- Wang, X., and H. Liu, 2016: Seasonal-to-interannual variability of the barrier layer in the western Pacific warm pool associated with ENSO. Climate Dynamics, 47, 375-392, doi:10.1007/s00382-015-2842-4.
- Wang, X., and H. Liu, 2016: PDO modulation of ENSO effect on tropical cyclone rapid intensification in the western North Pacific. Climate Dynamics, 46, 15-28, doi:10.1007/s00382-015-2563-8.
- Wang, X. L., Y. Feng, R. Chan, and V. Isaac, 2016: Inter-comparison of extra-tropical cyclone activity in nine reanalysis datasets. Atmospheric Research, 181, 133-153, doi:10.1016/j.atmosres.2016.06.010.
- Welker, C., O. Martius, P. Stucki, D. Bresch, S. Dierer, and S. Bronnimann, 2016: Modelling economic losses of historic and present-day high-impact winter windstorms in Switzerland. Tellus Series a-Dynamic Meteorology and Oceanography, 68, doi:10.3402/tellusa.v68.29546.
- Weller, H., P. Browne, C. Budd, and M. Cullen, 2016: Mesh adaptation on the sphere using optimal transport and the numerical solution of a Monge-Ampere type equation. Journal of Computational Physics, 308, 102-123, doi:10.1016/j.jcp.2015.12.018.
- Werner, A. T., and A. J. Cannon, 2016: Hydrologic extremes - an intercomparison of multiple gridded statistical downscaling methods. Hydrology and Earth System Sciences, 20, 1483-1508, doi:10.5194/hess-20-1483-2016.
- Wickert, A. D., 2016: Open-source modular solutions for flexural isostasy: gFlex v1.0. Geoscientific Model Development, 9, 997-1017, doi:10.5194/gmd-9-997-2016.
- Williamson, F., 2016: Cross-disciplinary working in the sciences and humanities: historical data rescue activities in Southeast Asia and beyond. Geoscience Letters, 3, doi:10.1186/s40562-016-0062-3.
- Wu, B., J. Lin, and T. Zhou, 2016: Interdecadal circumglobal teleconnection pattern during boreal summer. Atmospheric Science Letters, 17, 446-452, doi:10.1002/asl.677.
- Wu, B., T. Zhou, and T. Li, 2016: Impacts of the Pacific-Japan and Circumglobal Teleconnection Patterns on the Interdecadal Variability of the East Asian Summer Monsoon. J. Clim., 29, 3253-3271, doi:10.1175/JCLI-D-15-0105.1. Wu, L., X. Li, and T. Wu, 2016: South China Sea Wave Height Trends Analysis Using 20CR Reanalysis. Proceedings of the 2016 International Conference on Automatic Control and Information Engineering, 57-61.
- Wu, X., and J. Mao, 2016: Interdecadal modulation of ENSO-related spring rainfall over South China by the Pacific Decadal Oscillation. Climate Dynamics, 47, 3203-3220, doi:10.1007/s00382-016-3021-y.
- Wu, Y., M. Latif, and W. Park, 2016: Multiyear predictability of Northern Hemisphere surface air temperature in the Kiel Climate Model. Climate Dynamics, 47, 793-804, doi:10.1007/s00382-015-2871-z.
- Wu, Z., X. Li, Y. Li, and Y. Li, 2016: Potential Influence of Arctic Sea Ice to the Interannual Variations of East Asian Spring Precipitation*. J. Clim., 29, 2797-2813, doi:10.1175/JCLI-D-15-0128.1.
- Wu, Z., P. Zhang, H. Chen, and Y. Li, 2016: Can the Tibetan Plateau snow cover influence the interannual variations of Eurasian heat wave frequency? Climate Dynamics, 46, 3405-3417, doi:10.1007/s00382-015-2775-y.
- Xia, J., K. Tu, Z. Yan, and Y. Qi, 2016: The super-heat wave in eastern China during July-August 2013: a perspective of climate change. International Journal of Climatology, 36, 1291-1298, doi:10.1002/joc.4424.
- Xie, A., and Coauthors, 2016: Can temperature extremes in East Antarctica be replicated from ERA Interim reanalysis? Arct Antarct Alp Res, 48, 603-621, doi:10.1657/AAAR0015-048.
- Yamamoto, A., and J. B. Palter, 2016: The absence of an Atlantic imprint on the multidecadal variability of wintertime European temperature. Nature Communications, 7, doi:10.1038/ncomms10930.
- Yang, H., K. R. Johnson, M. L. Griffiths, and K. Yoshimura, 2016: Interannual controls on oxygen isotope variability in Asian monsoon precipitation and implications for paleoclimate reconstructions. Journal of Geophysical Research-Atmospheres, 121, 8410-8428, doi:10.1002/2015JD024683.
- Yang, H., G. Lohmann, W. Wei, M. Dima, M. Ionita, and J. Liu, 2016: Intensification and poleward shift of subtropical western boundary currents in a warming climate. Journal of Geophysical Research-Oceans, 121, 4928-4945, doi:10.1002/2015JC011513.
- Yang, Y., and Y. Du, 2016: Decadal variability of oceanic advection in the South China Sea associated with ENSO and Indian-Ocean Basin and its impacts on SST. Journal of Tropical Oceanography, 35, 72-81, doi:Yu, B., H. Lin, Z. W. Wu, and W. J. Merryfield, 2016: Relationship between North American winter temperature and large-scale atmospheric circulation anomalies and its decadal variation. Environmental Research Letters, 11, doi:10.1088/1748-9326/11/7/074001.
- Yu, P., L. Zhang, Y. Zhang, and B. Deng, 2016: Interdecadal change of winter SST variability in the Kuroshio Extension region and its linkage with Aleutian atmospheric low pressure system. Acta Oceanologica Sinica, 35, 24-37, doi:10.1007/s13131-016-0859-0.
- Zambri, B., and A. Robock, 2016: Winter warming and summer monsoon reduction after volcanic eruptions in Coupled Model Intercomparison Project 5 (CMIP5) simulations. Geophysical Research Letters, 43, 10920-10928, doi:10.1002/2016GL070460.
- Zampieri, M., S. Russo, S. di Sabatino, M. Michetti, E. Scoccimarro, and S. Gualdi, 2016: Global assessment of heat wave magnitudes from 1901 to 2010 and implications for the river discharge of the Alps. Science of the Total Environment, 571, 1330-1339, doi:10.1016/j.scitotenv.2016.07.008.
- Zhan, W., K. Guan, J. Sheffield, and E. F. Wood, 2016: Depiction of drought over sub-Saharan Africa using reanalyses precipitation data sets. Journal of Geophysical Research-Atmospheres, 121, 10555-10574, doi:10.1002/2016JD024858.
- Zhang, L., H. Ma, and L. Wu, 2016: Dynamics and mechanisms of decadal variability of the Pacific-South America mode over the 20th century. Climate Dynamics, 46, 3657-3667, doi:10.1007/s00382-015-2794-8.
- Zhang, X., L. Jin, and W. Jia, 2016: Centennial-scale teleconnection between North Atlantic sea surface temperatures and the Indian summer monsoon during the Holocene. Climate Dynamics, 46, 3323-3336, doi:10.1007/s00382-015-2771-2.
- Zhao, L., Y. Zhu, H. Liu, Z. Liu, Y. Liu, X. Li, and Z. Chen, 2016: A stable snow-atmosphere coupled mode. Climate Dynamics, 47, 2085-2104, doi:10.1007/s00382-015-2952-z.
- Zhao, P., and Coauthors, 2016: Summer precipitation anomalies in Asia and North America induced by Eurasian non-monsoon land heating versus ENSO. Scientific Reports, 6, doi:10.1038/srep21346.
- Zhou, B., Y. Xu, J. Wu, S. Dong, and Y. Shi, 2016: Changes in temperature and precipitation extreme indices over China: analysis of a high-resolution grid dataset. International Journal of Climatology, 36, 1051-1066, doi:10.1002/joc.4400.
- Zhou, T., and Coauthors, 2016: GMMIP (v1.0) contribution to CMIP6: Global Monsoons Model Inter-comparison Project. Geoscientific Model Development, 9, doi:10.5194/gmd-9-3589-2016.
- Zhou, Y., and Z. Wu, 2016: Possible impacts of mega-El Nino/Southern Oscillation and Atlantic Multidecadal Oscillation on Eurasian heatwave frequency variability. Quarterly Journal of the Royal Meteorological Society, 142, 1647-1661, doi:10.1002/qj.2759.
2015
- Agosta, C., X. Fettweis, and R. Datta, 2015: Evaluation of the CMIP5 models in the aim of regional modelling of the Antarctic surface mass balance. Cryosphere, 9, 2311-2321, doi:10.5194/tc-9-2311-2015.
- Alexeev, V. A., E. S. Euskirchen, J. E. Cherry, and R. C. Busey, 2015: Tundra burning in 2007-Did sea ice retreat matter? Polar Science, 9, 185-195, doi:10.1016/j.polar.2015.02.002.
- Allen, R. J., A. T. Evan, and B. B. B. Booth, 2015: Interhemispheric Aerosol Radiative Forcing and Tropical Precipitation Shifts during the Late Twentieth Century. J. Clim., 28, 8219-8246, doi:10.1175/JCLI-D-15-0148.1.
- Alsan, M., 2015: The Effect of the TseTse Fly on African Development. American Economic Review, 105, 382-410, doi:10.1257/aer.20130604.
- Amiruddin, A. M., I. D. Haigh, M. N. Tsimplis, F. M. Calafat, and S. Dangendorf, 2015: The seasonal cycle and variability of sea level in the South China Sea. Journal of Geophysical Research-Oceans, 120, 5490-5513, doi:10.1002/2015JC010923.
- Anchukaitis, K. J., M. J. Taylor, C. Leland, D. Pons, J. Martin-Fernandez, and E. Castellanos, 2015: Tree-ring reconstructed dry season rainfall in Guatemala. Climate Dynamics, 45, 1537-1546, doi:10.1007/s00382-014-2407-y.
- Andres, H. J., and W. R. Peltier, 2015: Attributing observed Greenland responses to natural and anthropogenic climate forcings. Climate Dynamics, 45, 2919-2936, doi:10.1007/s00382-015-2514-4.
- Arndt, D. S., and Coauthors, 2015: State of the Climate in 2014. Bulletin of the American Meteorological Society, 96, S1-S267, doi:10.1175/2015BAMSStateoftheClimate.1.
- Arns, A., T. Wahl, S. Dangendorf, and J. Jensen, 2015: The impact of sea level rise on storm surge water levels in the northern part of the German Bight. Coastal Engineering, 96, 118-131, doi:10.1016/j.coastaleng.2014.12.002.
- Arns, A., T. Wahl, I. D. Haigh, and J. Jensen, 2015: Determining return water levels at ungauged coastal sites: a case study for northern Germany. Ocean Dynamics, 65, 539-554, doi:10.1007/s10236-015-0814-1.
- Bao, M., and J. M. Wallace, 2015: Cluster Analysis of Northern Hemisphere Wintertime 500-hPa Flow Regimes during 1920-2014*. J Atmos Sci, 72, 3597-3608, doi:10.1175/JAS-D-15-0001.1.
- Belleflamme, A., X. Fettweis, and M. Erpicum, 2015: Recent summer Arctic atmospheric circulation anomalies in a historical perspective. Cryosphere, 9, 53-64, doi:10.5194/tc-9-53-2015.
- Bellomo, K., and A. C. Clement, 2015: Evidence for weakening of the Walker circulation from cloud observations. Geophysical Research Letters, 42, 7758-7766, doi:10.1002/2015GL065463.
- Benestad, R. E., and A. Mezghani, 2015: On downscaling probabilities for heavy 24-hour precipitation events at seasonal-to-decadal scales. Tellus Series a-Dynamic Meteorology and Oceanography, 67, doi:10.3402/tellusa.v67.25954. Bhend, J., 2015: Regional Evidence of Global Warming. Second Assessment of Climate Change for the Baltic Sea Basin, 427-439.
- Bierstedt, S. E., B. Huenicke, and E. Zorita, 2015: Variability of wind direction statistics of mean and extreme wind events over the Baltic Sea region. Tellus Series a-Dynamic Meteorology and Oceanography, 67, doi:10.3402/tellusa.v67.29073.
- Bliznak, V., M. A. Valente, and J. Bethke, 2015: Homogenization of time series from Portugal and its former colonies for the period from the late 19th to the early 21st century. International Journal of Climatology, 35, 2400-2418, doi:10.1002/joc.4151.
- Brnoenimann, S., 2015: Pacemakers of warming. Nature Geoscience, 8, 87-89, doi:10.1038/ngeo2330.
- Broennimann, S., A. M. Fischer, E. Rozanov, P. Poli, G. P. Compo, and P. D. Sardeshmukh, 2015: Southward shift of the northern tropical belt from 1945 to 1980. Nature Geoscience, 8, 969-U110, doi:10.1038/NGEO2568.
- Brugnara, Y., and Coauthors, 2015: A collection of sub-daily pressure and temperature observations for the early instrumental period with a focus on the "year without a summer" 1816. Climate of the Past, 11, 1027-1047, doi:10.5194/cp-11-1027-2015.
- Burgess, M. L., and N. P. Klingaman, 2015: Atmospheric circulation patterns associated with extreme cold winters in the UK. Weather, 70, 211-217, doi:10.1002/wea.2476.
- Burn, M. J., and S. E. Palmer, 2015: Atlantic hurricane activity during the last millennium. Scientific Reports, 5, doi:10.1038/srep12838.
- Burt, T. P., P. D. Jones, and N. J. K. Howden, 2015: An analysis of rainfall across the British Isles in the 1870s. International Journal of Climatology, 35, 2934-2947, doi:10.1002/joc.4184.
- Campagne, P., and Coauthors, 2015: Glacial ice and atmospheric forcing on the Mertz Glacier Polynya over the past 250 years. Nature Communications, 6, doi:10.1038/ncomms7642.
- Capotondi, A., and Coauthors, 2015: Understanding ENSO Diversity. Bulletin of the American Meteorological Society, 96, 921-938, doi:10.1175/BAMS-D-13-00117.1.
- Carlos Pena, J., M. Aran, J. Miguel Raso, and N. Perez-Zanon, 2015: Principal sequence pattern analysis of episodes of excess mortality due to heat in the Barcelona metropolitan area. International Journal of Biometeorology, 59, 435-446, doi:10.1007/s00484-014-0857-x.
- Cauquoin, A., P. Jean-Baptiste, C. Risi, E. Fourre, B. Stenni, and A. Landais, 2015: The global distribution of natural tritium in precipitation simulated with an Atmospheric General Circulation Model and comparison with observations. Earth and Planetary Science Letters, 427, 160-170, doi:10.1016/j.epsl.2015.06.043.
- Champion, A. J., R. P. Allan, and D. A. Lavers, 2015: Atmospheric rivers do not explain UK summer extreme rainfall. Journal of Geophysical Research-Atmospheres, 120, 6731-6741, doi:10.1002/2014JD022863.
- Chen, S., R. Wu, and W. Chen, 2015: The Changing Relationship between Interannual Variations of the North Atlantic Oscillation and Northern Tropical Atlantic SST. J. Clim., 28, 485-504, doi:10.1175/JCLI-D-14-00422.1.
- Chen, X., and J. M. Wallace, 2015: ENSO-Like Variability: 1900-2013. J. Clim., 28, 9623-9641, doi:10.1175/JCLI-D-15-0322.1.
- Colgan, W., and Coauthors, 2015: Greenland high-elevation mass balance: inference and implication of reference period (1961-90) imbalance. Annals of Glaciology, 56, 105-117, doi:10.3189/2015AoG70A967.
- Cram, T. A., and Coauthors, 2015: The International Surface Pressure Databank version 2. Geoscience Data Journal, 2, 31-46, doi:10.1002/gdj3.25.
- Cropper, T., E. Hanna, M. A. Valente, and T. Jonsson, 2015: A daily Azores-Iceland North Atlantic Oscillation index back to 1850. Geoscience Data Journal, 2, 12-24, doi:10.1002/gdj3.23.
- D'Arrigo, R., and C. C. Ummenhofer, 2015: The climate of Myanmar: evidence for effects of the Pacific Decadal Oscillation. International Journal of Climatology, 35, 634-640, doi:10.1002/joc.3995.
- Dangendorf, S., M. Marcos, A. Mueller, E. Zorita, R. Riva, K. Berk, and J. Jensen, 2015: Detecting anthropogenic footprints in sea level rise. Nature Communications, 6, doi:10.1038/ncomms8849.
- Dawson, A., and T. N. Palmer, 2015: Simulating weather regimes: impact of model resolution and stochastic parameterization. Climate Dynamics, 44, 2177-2193, doi:10.1007/s00382-014-2238-x.
- Dayon, G., J. Boe, and E. Martin, 2015: Transferability in the future climate of a statistical downscaling method for precipitation in France. Journal of Geophysical Research-Atmospheres, 120, 1023-1043, doi:10.1002/2014JD022236.
- de Lima, M. I. P., and S. Lovejoy, 2015: Macroweather precipitation variability up to global and centennial scales. Water Resources Research, 51, 9490-9513, doi:10.1002/2015WR017455.
- DeRose, R. J., and Coauthors, 2015: A millennium-length reconstruction of Bear River stream flow, Utah. Journal of Hydrology, 529, 524-534, doi:10.1016/j.jhydrol.2015.01.014.
- Diaconescu, E. P., P. Gachon, J. Scinocca, and R. Laprise, 2015: Evaluation of daily precipitation statistics and monsoon onset/retreat over western Sahel in multiple data sets. Climate Dynamics, 45, 1325-1354, doi:10.1007/s00382-014-2383-2.
- Diaz, H. F., and E. R. Wahl, 2015: Recent California Water Year Precipitation Deficits: A 440-Year Perspective*. J. Clim., 28, 4637-4652, doi:10.1175/JCLI-D-14-00774.1.
- Dominguez-Castro, F., A. M. Ramos, R. Garcia-Herrera, and R. M. Trigo, 2015: Iberian extreme precipitation 1855/1856: an analysis from early instrumental observations and documentary sources. International Journal of Climatology, 35, 142-153, doi:10.1002/joc.3973.
- Dong, B., and A. Dai, 2015: The influence of the Interdecadal Pacific Oscillation on Temperature and Precipitation over the Globe. Climate Dynamics, 45, 2667-2681, doi:10.1007/s00382-015-2500-x.
- Dong, B., and R. Sutton, 2015: Dominant role of greenhouse-gas forcing in the recovery of Sahel rainfall. Nature Climate Change, 5, 757-U173, doi:10.1038/NCLIMATE2664.
- Du, Y., Y. Zhang, M. Feng, T. Wang, N. Zhang, and S. Wijffels, 2015: Decadal trends of the upper ocean salinity in the tropical Indo-Pacific since mid-1990s. Scientific Reports, 5, doi:10.1038/srep16050.
- Duan, K., B. Xu, and G. Wu, 2015: Snow accumulation variability at altitude of 7010 m a.s.l. in Muztag Ata Mountain in Pamir Plateau during 1958-2002. Journal of Hydrology, 531, 912-918, doi:10.1016/j.jhydrol.2015.10.013.
- Elbert, J., M. Jacques-Coper, M. Van Daele, R. Urrutia, and M. Grosjean, 2015: A 600 years warm-season temperature record from varved sediments of Lago Plomo, Northern Patagonia, Chile (47 degrees S). Quaternary International, 377, 28-37, doi:10.1016/j.quaint.2015.01.004.
- Erler, A. R., W. R. Peltier, and M. D'Orgeville, 2015: Dynamically Downscaled High-Resolution Hydroclimate Projections for Western Canada. J. Clim., 28, 423-450, doi:10.1175/JCLI-D-14-00174.1.
- Fang, K., H. Seppa, and D. Chen, 2015: Interdecadal hydroclimate teleconnections between Asia and North America over the past 600 years. Climate Dynamics, 44, 1777-1787, doi:10.1007/s00382-014-2266-6.
- Feng, X., M. N. Tsimplis, M. Marcos, F. M. Calafat, J. Zheng, G. Jorda, and P. Cipollini, 2015: Spatial and temporal variations of the seasonal sea level cycle in the northwest Pacific. Journal of Geophysical Research-Oceans, 120, 7091-7112, doi:10.1002/2015JC011154.
- Ferranti, L., S. Corti, and M. Janousek, 2015: Flow-dependent verification of the ECMWF ensemble over the Euro-Atlantic sector. Quarterly Journal of the Royal Meteorological Society, 141, 916-924, doi:10.1002/qj.2411.
- Feser, F., M. Barcikowska, O. Krueger, F. Schenk, R. Weisse, and L. Xia, 2015: Storminess over the North Atlantic and northwestern Europe - A review. Quarterly Journal of the Royal Meteorological Society, 141, 350-382, doi:10.1002/qj.2364.
- Fleig, A. K., L. M. Tallaksen, P. James, H. Hisdal, and K. Stahl, 2015: Attribution of European precipitation and temperature trends to changes in synoptic circulation. Hydrology and Earth System Sciences, 19, 3093-3107, doi:10.5194/hess-19-3093-2015.
- Folland, C. K., and Coauthors, 2015: Multi-annual droughts in the English Lowlands: a review of their characteristics and climate drivers in the winter half-year. Hydrology and Earth System Sciences, 19, 2353-2375, doi:10.5194/hess-19-2353-2015.
- Freitas, A. C. V., J. S. Frederiksen, J. Whelan, T. J. O'Kane, and T. Ambrizzi, 2015: Observed and simulated inter-decadal changes in the structure of Southern Hemisphere large-scale circulation. Climate Dynamics, 45, 2993-3017, doi:10.1007/s00382-015-2519-z.
- Fruendt, B., J. W. Dippner, D. E. Schulz-Bull, and J. J. Waniek, 2015: Chlorophyll a reconstruction from in situ measurements: 2. Marked carbon uptake decrease in the last century. Journal of Geophysical Research-Biogeosciences, 120, 246-253, doi:10.1002/2014JG002692.
- Fujiwara, M., T. Hibino, S. K. Mehta, L. Gray, D. Mitchell, and J. Anstey, 2015: Global temperature response to the major volcanic eruptions in multiple reanalysis data sets. Atmospheric Chemistry and Physics, 15, 13507-13518, doi:10.5194/acp-15-13507-2015.
- Funk, C. C., and A. Hoell, 2015: The Leading Mode of Observed and CMIP5 ENSO-Residual Sea Surface Temperatures and Associated Changes in Indo-Pacific Climate. J. Clim., 28, 4309-4329, doi:10.1175/JCLI-D-14-00334.1.
- Gallego, D., P. Ordonez, P. Ribera, C. Pena-Ortiz, and R. Garcia-Herrera, 2015: An instrumental index of the West African Monsoon back to the nineteenth century. Quarterly Journal of the Royal Meteorological Society, 141, 3166-3176, doi:10.1002/qj.2601.
- Gan, B., and L. Wu, 2015: Feedbacks of Sea Surface Temperature to Wintertime Storm Tracks in the North Atlantic. J. Clim., 28, 306-323, doi:10.1175/JCLI-D-13-00719.1.
- Gastineau, G., and C. Frankignoul, 2015: Influence of the North Atlantic SST Variability on the Atmospheric Circulation during the Twentieth Century. J. Clim., 28, 1396-1416, doi:10.1175/JCLI-D-14-00424.1.
- Gonzalez-Reviriego, N., C. Rodriguez-Puebla, and B. Rodriguez-Fonseca, 2015: Evaluation of observed and simulated teleconnections over the Euro-Atlantic region on the basis of partial least squares regression. Climate Dynamics, 44, 2989-3014, doi:10.1007/s00382-014-2367-2.
- Gregow, H., and Coauthors, 2015: User awareness concerning feedback data and input observations used in reanalysis systems. Advances in Science and Research, 12, 63-67, doi:10.5194/asr-12-63-2015.
- Grigholm, B., and Coauthors, 2015: Twentieth century dust lows and the weakening of the westerly winds over the Tibetan Plateau. Geophysical Research Letters, 42, 2434-2441, doi:10.1002/2015GL063217.
- Grossman, M. J., M. Zaiki, and R. Nagata, 2015: Interannual and interdecadal variations in typhoon tracks around Japan. International Journal of Climatology, 35, 2514-2527, doi:10.1002/joc.4156.
- Groth, A., and M. Ghil, 2015: Monte Carlo Singular Spectrum Analysis (SSA) Revisited: Detecting Oscillator Clusters in Multivariate Datasets. J. Clim., 28, 7873-7893, doi:10.1175/JCLI-D-15-0100.1.
- Guan, X., J. Huang, R. Guo, and P. Lin, 2015: The role of dynamically induced variability in the recent warming trend slowdown over the Northern Hemisphere. Scientific Reports, 5, doi:10.1038/srep12669.
- Haarsma, R. J., F. M. Selten, and S. S. Drijfhout, 2015: Decelerating Atlantic meridional overturning circulation main cause of future west European summer atmospheric circulation changes. Environmental Research Letters, 10, doi:10.1088/1748-9326/10/9/094007.
- Haigh, I. D., and Coauthors, 2015: A user-friendly database of coastal flooding in the United Kingdom from 1915-2014. Scientific Data, 2, doi:10.1038/sdata.2015.21.
- Hall, R., R. Erdelyi, E. Hanna, J. M. Jones, and A. A. Scaife, 2015: Drivers of North Atlantic Polar Front jet stream variability. International Journal of Climatology, 35, 1697-1720, doi:10.1002/joc.4121.
- Han, B., S. Lu, Y. Gao, Y. Ao, and R. Li, 2015: Response of Atmospheric Energy to Historical Climate Change in CMIP5. Journal of Meteorological Research, 29, 93-105, doi:10.1007/s13351-014-4016-4.
- Han, B., C. Zhao, S. Lu, and X. Wang, 2015: A diagnostic analysis on the effect of the residual layer in convective boundary layer development near Mongolia using 20th century reanalysis data. Advances in Atmospheric Sciences, 32, 807-820, doi:10.1007/s00376-014-4164-6.
- Hanna, E., T. E. Cropper, P. D. Jones, A. A. Scaife, and R. Allan, 2015: Recent seasonal asymmetric changes in the NAO (a marked summer decline and increased winter variability) and associated changes in the AO and Greenland Blocking Index. International Journal of Climatology, 35, 2540-2554, doi:10.1002/joc.4157.
- Hartmann, D. L., 2015: Pacific sea surface temperature and the winter of 2014. Geophysical Research Letters, 42, 1894-1902, doi:10.1002/2015GL063083.
- Henley, B. J., J. Gergis, D. J. Karoly, S. Power, J. Kennedy, and C. K. Folland, 2015: A Tripole Index for the Interdecadal Pacific Oscillation. Climate Dynamics, 45, 3077-3090, doi:10.1007/s00382-015-2525-1.
- Hernandez, M., C. C. Ummenhofer, and K. J. Anchukaitis, 2015: Multi-scale drought and ocean-atmosphere variability in monsoon Asia. Environmental Research Letters, 10, doi:10.1088/1748-9326/10/7/074010.
- Hernandez-Almeida, I., M. Grosjean, W. Tylmann, and A. Bonk, 2015: Chrysophyte cyst-inferred variability of warm season lake water chemistry and climate in northern Poland: training set and downcore reconstruction. Journal of Paleolimnology, 53, 123-138, doi:10.1007/s10933-014-9812-4.
- Hersbach, H., C. Peubey, A. Simmons, P. Berrisford, P. Poli, and D. Dee, 2015: ERA-20CM: a twentieth-century atmospheric model ensemble. Quarterly Journal of the Royal Meteorological Society, 141, 2350-2375, doi:10.1002/qj.2528.
- Hertig, E., C. Beck, H. Wanner, and J. Jacobeit, 2015: A review of non-stationarities in climate variability of the last century with focus on the North Atlantic-European sector. Earth-Science Reviews, 147, 1-17, doi:10.1016/j.earscirev.2015.04.009.
- Higuera, P. E., J. T. Abatzoglou, J. S. Littell, and P. Morgan, 2015: The Changing Strength and Nature of Fire-Climate Relationships in the Northern Rocky Mountains, USA, 1902-2008. Plos One, 10, doi:10.1371/journal.pone.0127563.
- Hirano, J., and T. Mikami, 2015: Long-term changes in summer temperature anomaly patterns in Japan since the early 20th century. International Journal of Climatology, 35, 3676-3690, doi:10.1002/joc.4241.
- Hoell, A., C. Funk, and M. Barlow, 2015: The Forcing of Southwestern Asia Teleconnections by Low-Frequency Sea Surface Temperature Variability during Boreal Winter. J. Clim., 28, 1511-1526, doi:10.1175/JCLI-D-14-00344.1.
- Hope, P., and Coauthors, 2015: Seasonal and regional signature of the projected southern Australian rainfall reduction. Australian Meteorological and Oceanographic Journal, 65, 54-71, doi:10.22499/2.6501.005.
- Ingleby, B., 2015: Global assimilation of air temperature, humidity, wind and pressure from surface stations. Quarterly Journal of the Royal Meteorological Society, 141, 504-517, doi:10.1002/qj.2372.
- Ionita, M., 2015: Interannual summer streamflow variability over Romania and its connection to large-scale atmospheric circulation. International Journal of Climatology, 35, 4186-4196, doi:10.1002/joc.4278.
- Ionita, M., C. Boroneant, and S. Chelcea, 2015: Seasonal modes of dryness and wetness variability over Europe and their connections with large scale atmospheric circulation and global sea surface temperature. Climate Dynamics, 45, 2803-2829, doi:10.1007/s00382-015-2508-2.
- Ionita, M., M. Dima, G. Lohmann, P. Scholz, and N. Rimbu, 2015: Predicting the June 2013 European Flooding Based on Precipitation, Soil Moisture, and Sea Level Pressure. Journal of Hydrometeorology, 16, 598-614, doi:10.1175/JHM-D-14-0156.1.
- Ionita, M., P. Scholz, and S. Chelcea, 2015: Spatio-temporal variability of dryness/wetness in the Danube River Basin. Hydrological Processes, 29, 4483-4497, doi:10.1002/hyp.10514. Ishida, K., M. L. Kavvas, S. Ceyhan, N. Ohara, and Z. Q. Chen, 2015: Climate Change Analysis on Extreme Precipitation over Three Watersheds in Northern California Based on 137-Year Long-Term Dynamical Downscaling. World Environmental and Water Resources Congress 2015: Floods, Droughts, and Ecosystems, 983-988.
- Iversen, E. C., and H. Burningham, 2015: Relationship between NAO and wind climate over Norway. Climate Research, 63, 115-134, doi:10.3354/cr01277.
- Jacques-Coper, M., S. Broennimann, O. Martius, C. S. Vera, and S. B. Cerne, 2015: Evidence for a modulation of the intraseasonal summer temperature in Eastern Patagonia by the Madden-Julian Oscillation. Journal of Geophysical Research-Atmospheres, 120, 7340-7357, doi:10.1002/2014JD022924.
- Jones, P. D., and D. H. Lister, 2015: Antarctic near-surface air temperatures compared with ERA-Interim values since 1979. International Journal of Climatology, 35, 1354-1366, doi:10.1002/joc.4061.
- Kaiser-Weiss, A. K., and Coauthors, 2015: Comparison of regional and global reanalysis near-surface winds with station observations over Germany. Advances in Science and Research, 12, 187-198, doi:10.5194/asr-12-187-2015.
- Kaspar, F., B. Tinz, H. Maechel, and L. Gates, 2015: Data rescue of national and international meteorological observations at Deutscher Wetterdienst. Advances in Science and Research, 12, 57-61, doi:10.5194/asr-12-57-2015.
- Kauffeldt, A., S. Halldin, F. Pappenberger, F. Wetterhall, C.-Y. Xu, and H. L. Cloke, 2015: Imbalanced land surface water budgets in a numerical weather prediction system. Geophysical Research Letters, 42, 4411-4417, doi:10.1002/2015GL064230.
- Kelley, C. P., S. Mohtadi, M. A. Cane, R. Seager, and Y. Kushnir, 2015: Climate change in the Fertile Crescent and implications of the recent Syrian drought. Proceedings of the National Academy of Sciences of the United States of America, 112, 3241-3246, doi:10.1073/pnas.1421533112.
- Kendon, M., and M. McCarthy, 2015: The UK's wet and stormy winter of 2013/2014. Weather, 70, 40-47, doi:10.1002/wea.2465.
- King, A. D., M. G. Donat, L. V. Alexander, and D. J. Karoly, 2015: The ENSO-Australian rainfall teleconnection in reanalysis and CMIP5. Climate Dynamics, 44, 2623-2635, doi:10.1007/s00382-014-2159-8.
- King, J. A., G. R. Bigg, and R. Hall, 2015: Influence of synoptic atmospheric conditions on movement of individual sea-ice floes in Fram Strait, late summer 2010. Annals of Glaciology, 56, 445-450, doi:10.3189/2015AoG69A655.
- Kirchner-Bossi, N., R. Garcia-Herrera, L. Prieto, and R. M. Trigo, 2015: A long-term perspective of wind power output variability. International Journal of Climatology, 35, 2635-2646, doi:10.1002/joc.4161.
- Klesse, S., M. Ziehmer, G. Rousakis, V. Trouet, and D. Frank, 2015: Synoptic drivers of 400 years of summer temperature and precipitation variability on Mt. Olympus, Greece. Climate Dynamics, 45, 807-824, doi:10.1007/s00382-014-2313-3.
- Klotzbach, P. J., and E. C. J. Oliver, 2015: Variations in global tropical cyclone activity and the Madden-Julian Oscillation since the midtwentieth century. Geophysical Research Letters, 42, 4199-4207, doi:10.1002/2015GL063966.
- Klotzbach, P. J., and E. C. J. Oliver, 2015: Modulation of Atlantic Basin Tropical Cyclone Activity by the Madden-Julian Oscillation (MJO) from 1905 to 2011. J. Clim., 28, 204-217, doi:10.1175/JCLI-D-14-00509.1.
- Kobayashi, S., and Coauthors, 2015: The JRA-55 Reanalysis: General Specifications and Basic Characteristics. Journal of the Meteorological Society of Japan, 93, 5-48, doi:10.2151/jmsj.2015-001.
- Kolstad, E. W., S. P. Sobolowski, and A. A. Scaife, 2015: Intraseasonal Persistence of European Surface Temperatures. J. Clim., 28, 5365-5374, doi:10.1175/JCLI-D-15-0053.1.
- Kong, X.-H., and X.-Q. Bi, 2015: Dynamical Downscaling of the Twentieth Century Reanalysis for China: Climatic Means during 1981-2010. Atmospheric and Oceanic Science Letters, 8, 166-173, doi:10.3878/AOSL20140099.
- Krichak, S. O., J. Barkan, J. S. Breitgand, S. Gualdi, and S. B. Feldstein, 2015: The role of the export of tropical moisture into midlatitudes for extreme precipitation events in the Mediterranean region. Theoretical and Applied Climatology, 121, 499-515, doi:10.1007/s00704-014-1244-6.
- Kruk, M. C., A. M. Lorrey, G. M. Griffiths, M. Lander, E. J. Gibney, H. J. Diamond, and J. J. Marra, 2015: On the state of the knowledge of rainfall extremes in the western and northern Pacific basin. International Journal of Climatology, 35, 321-336, doi:10.1002/joc.3990.
- Kucharski, F., F. S. Syed, A. Burhan, I. Farah, and A. Gohar, 2015: Tropical Atlantic influence on Pacific variability and mean state in the twentieth century in observations and CMIP5. Climate Dynamics, 44, 881-896, doi:10.1007/s00382-014-2228-z.
- Kuentz, A., T. Mathevet, J. Gailhard, and B. Hingray, 2015: Building long-term and high spatio-temporal resolution precipitation and air temperature reanalyses by mixing local observations and global atmospheric reanalyses: the ANATEM model. Hydrology and Earth System Sciences, 19, 2717-2736, doi:10.5194/hess-19-2717-2015.
- Lai, A. W.-C., M. Herzog, and H.-F. Graf, 2015: Two key parameters for the El Nio continuum: zonal wind anomalies and Western Pacific subsurface potential temperature. Climate Dynamics, 45, 3461-3480, doi:10.1007/s00382-015-2550-0.
- Lavers, D. A., D. M. Hannah, and C. Bradley, 2015: Connecting large-scale atmospheric circulation, river flow and groundwater levels in a chalk catchment in southern England. Journal of Hydrology, 523, 179-189, doi:10.1016/j.jhydrol.2015.01.060.
- Lee, S.-K., W. Park, M. O. Baringer, A. L. Gordon, B. Huber, and Y. Liu, 2015: Pacific origin of the abrupt increase in Indian Ocean heat content during the warming hiatus. Nature Geoscience, 8, 445-U441, doi:10.1038/NGEO2438.
- Lewis, S. C., and A. N. LeGrande, 2015: Stability of ENSO and its tropical Pacific teleconnections over the Last Millennium. Climate of the Past, 11, 1347-1360, doi:10.5194/cp-11-1347-2015.
- Li, F., and Y.-Q. Gao, 2015: The Project Siberian High in CMIP5 Models. Atmospheric and Oceanic Science Letters, 8, 179-184, doi:10.3878/AOSL20140101.
- Li, X., and M. Ting, 2015: Recent and future changes in the Asian monsoon-ENSO relationship: Natural or forced? Geophysical Research Letters, 42, 3502-3512, doi:10.1002/2015GL063557.
- Li, X., M. Ting, C. Li, and N. Henderson, 2015: Mechanisms of Asian Summer Monsoon Changes in Response to Anthropogenic Forcing in CMIP5 Models. J. Clim., 28, 4107-4125, doi:10.1175/JCLI-D-14-00559.1.
- Li, Y., J. Li, W. Zhang, X. Zhao, F. Xie, and F. Zheng, 2015: Ocean dynamical processes associated with the tropical Pacific cold tongue mode. Journal of Geophysical Research-Oceans, 120, 6419-6435, doi:10.1002/2015JC010814.
- Liu, H., C. Wang, S.-K. Lee, and D. Enfield, 2015: Inhomogeneous influence of the Atlantic warm pool on United States precipitation. Atmospheric Science Letters, 16, 63-69, doi:10.1002/asl2.521.
- Liu, Y., S.-K. Lee, D. B. Enfield, B. A. Muhling, J. T. Lamkin, F. E. Muller-Karger, and M. A. Roffer, 2015: Potential impact of climate change on the Intra-Americas Sea: Part-1. A dynamic downscaling of the CMIP5 model projections. Journal of Marine Systems, 148, 56-69, doi:10.1016/j.jmarsys.2015.01.007.
- Liu, Z., Z. Jian, K. Yoshimura, N. H. Buenning, C. J. Poulsen, and G. J. Bowen, 2015: Recent contrasting winter temperature changes over North America linked to enhanced positive Pacific-North American pattern. Geophysical Research Letters, 42, 7750-7757, doi:10.1002/2015GL065656.
- Lluis Ruiz-Bellet, J., J. Caries Balasch, J. Tuset, M. Barriendos, J. Mazon, and D. Pino, 2015: Historical, hydraulic, hydrological and meteorological reconstruction of 1874 Santa Tecla flash floods in Catalonia (NE Iberian Peninsula). Journal of Hydrology, 524, 279-295, doi:10.1016/j.jhydrol.2015.02.023.
- Longman, R. J., H. F. Diaz, and T. W. Giambelluca, 2015: Sustained Increases in Lower-Tropospheric Subsidence over the Central Tropical North Pacific Drive a Decline in High-Elevation Rainfall in Hawaii. J. Clim., 28, 8743-8759, doi:10.1175/JCLI-D-15-0006.1.
- Lovejoy, S., 2015: A voyage through scales, a missing quadrillion and why the climate is not what you expect. Climate Dynamics, 44, 3187-3210, doi:10.1007/s00382-014-2324-0.
- Lovejoy, S., and M. I. P. de Lima, 2015: The joint space-time statistics of macroweather precipitation, space-time statistical factorization and macroweather models. Chaos, 25, doi:10.1063/1.4927223.
- Ma, X., P. Chang, R. Saravanan, D. Wu, X. Lin, L. Wu, and X. Wan, 2015: Winter Extreme Flux Events in the Kuroshio and Gulf Stream Extension Regions and Relationship with Modes of North Pacific and Atlantic Variability. J. Clim., 28, 4950-4970, doi:10.1175/JCLI-D-14-00642.1.
- Marcos, M., F. M. Calafat, A. Berihuete, and S. Dangendorf, 2015: Long-term variations in global sea level extremes. Journal of Geophysical Research-Oceans, 120, 8115-8134, doi:10.1002/2015JC011173. Marie, M., P. Christian, C. Jean-Pierre, and B. Francois, 2015: Extension of the SIM Reanalysis by Combination of Observations and Statistical Downscaling. Engineering Geology for Society and Territory, Vol 1: Climate Change and Engineering Geology, 189-192.
- Martin-Rey, M., B. Rodriguez-Fonseca, and I. Polo, 2015: Atlantic opportunities for ENSO prediction. Geophysical Research Letters, 42, 6802-6810, doi:10.1002/2015GL065062.
- Masson-Delmotte, V., and Coauthors, 2015: Recent changes in north-west Greenland climate documented by NEEM shallow ice core data and simulations, and implications for past-temperature reconstructions. Cryosphere, 9, 1481-1504, doi:10.5194/tc-9-1481-2015.
- Mauro Vargas-Hernandez, J., S. E. Wijffels, G. Meyers, A. B. do Couto, and N. J. Holbrook, 2015: Decadal Characterization of Indo-Pacific Ocean Subsurface Temperature Modes in SODA Reanalysis. J. Clim., 28, 6113-6132, doi:10.1175/JCLI-D-14-00700.1.
- McPhaden, M. J., A. Timmermann, M. J. Widlansky, M. A. Balmaseda, and T. N. Stockdale, 2015: A Perspective from 40 Years of Progress in Climate Research and Forecasting. Bulletin of the American Meteorological Society, 96, 1647-1665, doi:10.1175/BAMS-D-14-00089.1. Mercer, A., and A. Grimes, 2015: Diagnosing Tropical Cyclone Rapid Intensification Using Kernel Methods and Reanalysis Datasets. Complex Adaptive Systems, 2015, 422-427.
- Merz, N., C. C. Raible, and T. Woollings, 2015: North Atlantic Eddy-Driven Jet in Interglacial and Glacial Winter Climates. J. Clim., 28, 3977-3997, doi:10.1175/JCLI-D-14-00525.1.
- Mitchell, D. M., and Coauthors, 2015: Signatures of naturally induced variability in the atmosphere using multiple reanalysis datasets. Quarterly Journal of the Royal Meteorological Society, 141, 2011-2031, doi:10.1002/qj.2492.
- Monier, E., X. Gao, J. R. Scott, A. P. Sokolov, and C. A. Schlosser, 2015: A framework for modeling uncertainty in regional climate change. Climatic Change, 131, 51-66, doi:10.1007/s10584-014-1112-5.
- Mueller, W. A., and Coauthors, 2015: A twentieth-century reanalysis forced ocean model to reconstruct the North Atlantic climate variation during the 1920s. Climate Dynamics, 44, 1935-1955, doi:10.1007/s00382-014-2267-5.
- Muhling, B. A., Y. Liu, S.-K. Lee, J. T. Lamkin, M. A. Roffer, F. Muller-Karger, and J. F. Walter, III, 2015: Potential impact of climate change on the Intra-Americas Sea: Part 2. Implications for Atlantic bluefin tuna and skipjack tuna adult and larval habitats. Journal of Marine Systems, 148, 1-13, doi:10.1016/j.jmarsys.2015.01.010.
- Nguyen, H., C. Lucas, A. Evans, B. Timbal, and L. Hanson, 2015: Expansion of the Southern Hemisphere Hadley Cell in Response to Greenhouse Gas Forcing. J. Clim., 28, 8067-8077, doi:10.1175/JCLI-D-15-0139.1.
- Nicholson, S. E., 2015: Long-term variability of the East African "short rains' and its links to large-scale factors. International Journal of Climatology, 35, 3979-3990, doi:10.1002/joc.4259.
- Oliver, E. C. J., 2015: Multidecadal variations in the modulation of Alaska wintertime air temperature by the Madden-Julian Oscillation. Theoretical and Applied Climatology, 121, 1-11, doi:10.1007/s00704-014-1215-y.
- Oliver, H., R. L. Rognstad, and D. S. Wethey, 2015: Using meteorological reanalysis data for multi-decadal hindcasts of larval connectivity in the coastal ocean. Marine Ecology Progress Series, 530, 47-62, doi:10.3354/meps11300.
- Ortega, P., F. Lehner, D. Swingedouw, V. Masson-Delmotte, C. C. Raible, M. Casado, and P. Yiou, 2015: A model-tested North Atlantic Oscillation reconstruction for the past millennium. Nature, 523, 71-+, doi:10.1038/nature14518.
- Ott, I., K. Romberg, and J. Jacobeit, 2015: Teleconnections of the tropical Atlantic and Pacific Oceans in a CMIP5 model ensemble. Climate Dynamics, 44, 3043-3055, doi:10.1007/s00382-014-2394-z.
- Overland, J., J. A. Francis, R. Hall, E. Hanna, S.-J. Kim, and T. Vihma, 2015: The Melting Arctic and Midlatitude Weather Patterns: Are They Connected? J. Clim., 28, 7917-7932, doi:10.1175/JCLI-D-14-00822.1.
- Paltsev, S., E. Monier, J. Scott, A. Sokolov, and J. Reilly, 2015: Integrated economic and climate projections for impact assessment. Climatic Change, 131, 21-33, doi:10.1007/s10584-013-0892-3.
- Pena, J. C., L. Schulte, A. Badoux, M. Barriendos, and A. Barrera-Escoda, 2015: Influence of solar forcing, climate variability and modes of low-frequency atmospheric variability on summer floods in Switzerland. Hydrology and Earth System Sciences, 19, 3807-3827, doi:10.5194/hess-19-3807-2015.
- Penny, S. G., D. W. Behringer, J. A. Carton, and E. Kalnay, 2015: A Hybrid Global Ocean Data Assimilation System at NCEP. Monthly Weather Review, 143, 4660-4677, doi:10.1175/MWR-D-14-00376.1.
- Perlwitz, J., M. Hoerling, and R. Dole, 2015: Arctic Tropospheric Warming: Causes and Linkages to Lower Latitudes. J. Clim., 28, 2154-2167, doi:10.1175/JCLI-D-14-00095.1.
- Peterson, I. K., R. Pettipas, and A. Rosing-Asvid, 2015: Trends and Variability in Sea Ice and Icebergs off the Canadian East Coast. Atmosphere-Ocean, 53, 582-594, doi:10.1080/07055900.2015.1057684.
- Piecuch, C. G., and R. M. Ponte, 2015: Inverted barometer contributions to recent sea level changes along the northeast coast of North America. Geophysical Research Letters, 42, 5918-5925, doi:10.1002/2015GL064580.
- Polzin, D., L. G. Guirola, and S. Hastenrath, 2015: Climatic variations in Central America: further exploration. International Journal of Climatology, 35, 2122-2130, doi:10.1002/joc.4111.
- Pralungo, L. R., and L. Haimberger, 2015: New estimates of tropical mean temperature trend profiles from zonal mean historical radiosonde and pilot balloon wind shear observations. Journal of Geophysical Research-Atmospheres, 120, 3700-3713, doi:10.1002/2014JD022664.
- Praveen, V., S. Sandeep, and R. S. Ajayamohan, 2015: On the Relationship between Mean Monsoon Precipitation and Low Pressure Systems in Climate Model Simulations. J. Clim., 28, 5305-5324, doi:10.1175/JCLI-D-14-00415.1.
- Qian, W., K. Wu, and D. Chen, 2015: The Arctic and Polar cells act on the Arctic sea ice variation. Tellus Series a-Dynamic Meteorology and Oceanography, 67, 1-18, doi:10.3402/tellusa.v67.27692.
- Rao, J., R. Ren, and Y. Yang, 2015: Parallel comparison of the northern winter stratospheric circulation in reanalysis and in CMIP5 models. Advances in Atmospheric Sciences, 32, 952-966, doi:10.1007/s00376-014-4192-2.
- Rapaic, M., R. Brown, M. Markovic, and D. Chaumont, 2015: An Evaluation of Temperature and Precipitation Surface-Based and Reanalysis Datasets for the Canadian Arctic, 1950-2010. Atmosphere-Ocean, 53, 283-303, doi:10.1080/07055900.2015.1045825.
- Ray, S., D. Swingedouw, J. Mignot, and E. Guilyardi, 2015: Effect of surface restoring on subsurface variability in a climate model during 1949-2005. Climate Dynamics, 44, 2333-2349, doi:10.1007/s00382-014-2358-3.
- Reboita, M. S., R. P. da Rocha, T. Ambrizzi, and C. D. Gouveia, 2015: Trend and teleconnection patterns in the climatology of extratropical cyclones over the Southern Hemisphere. Climate Dynamics, 45, 1929-1944, doi:10.1007/s00382-014-2447-3.
- Rhodes, R. I., L. C. Shaffrey, and S. L. Gray, 2015: Can reanalyses represent extreme precipitation over England and Wales? Quarterly Journal of the Royal Meteorological Society, 141, 1114-1120, doi:10.1002/qj.2418.
- Richter, J. H., C. Deser, and L. Sun, 2015: Effects of stratospheric variability on El Nino teleconnections. Environmental Research Letters, 10, doi:10.1088/1748-9326/10/12/124021.
- Risbey, J. S., T. J. O'Kane, D. P. Monselesan, C. Franzke, and I. Horenko, 2015: Metastability of Northern Hemisphere Teleconnection Modes. J Atmos Sci, 72, 35-54, doi:10.1175/JAS-D-14-0020.1.
- Rotstayn, L. D., M. A. Collier, and J. J. Luo, 2015: Effects of declining aerosols on projections of zonally averaged tropical precipitation. Environmental Research Letters, 10, doi:10.1088/1748-9326/10/4/044018. Rutgersson, A., and Coauthors, 2015: Recent Change-Atmosphere. Second Assessment of Climate Change for the Baltic Sea Basin, 69-97.
- Saffioti, C., E. M. Fischer, and R. Knutti, 2015: Contributions of atmospheric circulation variability and data coverage bias to the warming hiatus. Geophysical Research Letters, 42, 2385-2391, doi:10.1002/2015GL063091.
- Saha, M., P. Mitra, and A. Chakraborty, 2015: Fuzzy Clustering-Based Ensemble Approach to Predicting Indian Monsoon. Advances in Meteorology, doi:10.1155/2015/329835.
- Saher, M. H., W. R. Gehrels, N. L. M. Barlow, A. J. Long, I. D. Haigh, and M. Blaauw, 2015: Sea-level changes in Iceland and the influence of the North Atlantic Oscillation during the last half millennium. Quaternary Science Reviews, 108, 23-36, doi:10.1016/j.quascirev.2014.11.005.
- Santos, M., J. A. Santos, and M. Fragoso, 2015: Historical damaging flood records for 1871-2011 in Northern Portugal and underlying atmospheric forcings. Journal of Hydrology, 530, 591-603, doi:10.1016/j.jhydrol.2015.10.011.
- Sardeshmukh, P. D., G. P. Compo, and C. Penland, 2015: Need for Caution in Interpreting Extreme Weather Statistics. J. Clim., 28, 9166-9187, doi:10.1175/JCLI-D-15-0020.1.
- Schultz, J. A., C. Beck, G. Menz, B. Neuwirth, C. Ohlwein, and A. Philipp, 2015: Sensitivity of proxies on non-linear interactions in the climate system. Scientific Reports, 5, doi:10.1038/srep18560.
- Seitola, T., J. Silen, and H. Jarvinen, 2015: Randomised multichannel singular spectrum analysis of the 20th century climate data. Tellus Series a-Dynamic Meteorology and Oceanography, 67, doi:10.3402/tellusa.v67.28876.
- Selman, C., and V. Misra, 2015: Simulating diurnal variations over the southeastern United States. Journal of Geophysical Research-Atmospheres, 120, 180-198, doi:10.1002/2014JD021812.
- Serpa, D., and Coauthors, 2015: Impacts of climate and land use changes on the hydrological and erosion processes of two contrasting Mediterranean catchments. Science of the Total Environment, 538, 64-77, doi:10.1016/j.scitotenv.2015.08.033.
- Singh, P., V. Vasudevan, J. S. Chowdary, and C. Gnanaseelan, 2015: Subseasonal variations of Indian summer monsoon with special emphasis on drought and excess rainfall years. International Journal of Climatology, 35, 570-582, doi:10.1002/joc.4004.
- Sippel, S., J. Zscheischler, M. Heimann, F. E. L. Otto, J. Peters, and M. D. Mahecha, 2015: Quantifying changes in climate variability and extremes: Pitfalls and their overcoming. Geophysical Research Letters, 42, 9990-9998, doi:10.1002/2015GL066307.
- Smith, J. A., and M. L. Baeck, 2015: "Prophetic vision, vivid imagination": The 1927 Mississippi River flood. Water Resources Research, 51, 9964-9994, doi:10.1002/2015WR017927.
- Smith, T. M., and P. A. Arkin, 2015: Improved Historical Analysis of Oceanic Total Precipitable Water. J. Clim., 28, 3099-3121, doi:10.1175/JCLI-D-14-00601.1.
- Smoliak, B. V., and J. M. Wallace, 2015: On the Leading Patterns of Northern Hemisphere Sea Level Pressure Variability*. J Atmos Sci, 72, 3469-3486, doi:10.1175/JAS-D-14-0371.1.
- Smoliak, B. V., J. M. Wallace, P. Lin, and Q. Fu, 2015: Dynamical Adjustment of the Northern Hemisphere Surface Air Temperature Field: Methodology and Application to Observations. J. Clim., 28, 1613-1629, doi:10.1175/JCLI-D-14-00111.1.
- Song, F., and T. Zhou, 2015: The Crucial Role of Internal Variability in Modulating the Decadal Variation of the East Asian Summer Monsoon-ENSO Relationship during the Twentieth Century. J. Clim., 28, 7093-7107, doi:10.1175/JCLI-D-14-00783.1.
- Song, L.-Y., and W.-S. Duan, 2015: Interannual Relationship between the Winter Aleutian Low and Rainfall in the Following Summer in South China. Atmospheric and Oceanic Science Letters, 8, 271-276, doi:10.3878/AOSL20150021.
- Sprenger, M., and H. Wernli, 2015: The LAGRANTO Lagrangian analysis tool - version 2.0. Geoscientific Model Development, 8, 2569-2586, doi:10.5194/gmd-8-2569-2015.
- Steiner, N., and Coauthors, 2015: Observed trends and climate projections affecting marine ecosystems in the Canadian Arctic. Environmental Reviews, 23, 191-239, doi:10.1139/er-2014-0066.
- Sterl, A., A. M. R. Bakker, H. W. van den Brink, R. Haarsma, A. Stepek, I. L. Wijnant, and R. C. de Winter, 2015: Large-scale winds in the southern North Sea region: the wind part of the KNMI' 14 climate change scenarios. Environmental Research Letters, 10, doi:10.1088/1748-9326/10/3/035004.
- Stickler, A., and Coauthors, 2015: Upper-air observations from the German Atlantic Expedition (1925-27) and comparison with the Twentieth Century and ERA-20C reanalyses. Meteorologische Zeitschrift, 24, 525-544, doi:10.1127/metz/2015/0683.
- Stucki, P., and Coauthors, 2015: Dynamical Downscaling and Loss Modeling for the Reconstruction of Historical Weather Extremes and Their Impacts: A Severe Foehn Storm in 1925. Bulletin of the American Meteorological Society, 96, doi:10.1175/BAMS-D-14-00041.1.
- Sun, C., J. Li, J. Feng, and F. Xie, 2015: A Decadal-Scale Teleconnection between the North Atlantic Oscillation and Subtropical Eastern Australian Rainfall. J. Clim., 28, 1074-1092, doi:10.1175/JCLI-D-14-00372.1.
- Sun, C., J. Li, and S. Zhao, 2015: Remote influence of Atlantic multidecadal variability on Siberian warm season precipitation. Scientific Reports, 5, doi:10.1038/srep16853.
- Surkova, G. V., L. A. Sokolova, A. R. Chichev, Л. А. Соколова, and А. Р. Чичев, 2015: Long-term regime of extreme winds in the Barents and Kara seas. Vestnik Moskovskogo universiteta. Seriya 5: Geografiya, 53-58, doi:Swart, N. C., J. C. Fyfe, N. Gillett, and G. J. Marshall, 2015: Comparing Trends in the Southern Annular Mode and Surface Westerly Jet. J. Clim., 28, 8840-8859, doi:10.1175/JCLI-D-15-0334.1.
- Therrell, M. D., and M. B. Bialecki, 2015: A multi-century tree-ring record of spring flooding on the Mississippi River. Journal of Hydrology, 529, 490-498, doi:10.1016/j.jhydrol.2014.11.005.
- Thomas, E. R., J. S. Hosking, R. R. Tuckwell, R. A. Warren, and E. C. Ludlow, 2015: Twentieth century increase in snowfall in coastal West Antarctica. Geophysical Research Letters, 42, 9387-9393, doi:10.1002/2015GL065750.
- Thompson, D. M., J. E. Cole, G. T. Shen, A. W. Tudhope, and G. A. Meehl, 2015: Early twentieth-century warming linked to tropical Pacific wind strength. Nature Geoscience, 8, 117-121, doi:10.1038/NGEO2321.
- Tian, B., and K. Fan, 2015: A Skillful Prediction Model for Winter NAO Based on Atlantic Sea Surface Temperature and Eurasian Snow Cover. Weather Forecast, 30, 197-205, doi:10.1175/WAF-D-14-00100.1.
- Tian, D., S. Asseng, C. J. Martinez, V. Misra, D. Cammarano, and B. V. Ortiz, 2015: Does decadal climate variation influence wheat and maize production in the southeast USA? Agricultural and Forest Meteorology, 204, 1-9, doi:10.1016/j.agrformet.2015.01.013.
- Turney, C. S. M., C. J. Fogwill, A. R. Klekociuk, T. D. van Ommen, M. A. J. Curran, A. D. Moy, and J. G. Palmer, 2015: Tropical and mid-latitude forcing of continental Antarctic temperatures. Cryosphere, 9, 2405-2415, doi:10.5194/tc-9-2405-2015.
- Uotila, P., T. Vihma, and J. Haapala, 2015: Atmospheric and oceanic conditions and the extremely low Bothnian Bay sea ice extent in 2014/2015. Geophysical Research Letters, 42, 7740-7749, doi:10.1002/2015GL064901.
- Vance, T. R., J. L. Roberts, C. T. Plummer, A. S. Kiem, and T. D. van Ommen, 2015: Interdecadal Pacific variability and eastern Australian megadroughts over the last millennium. Geophysical Research Letters, 42, 129-137, doi:10.1002/2014GL062447.
- Vijayakumar, D. B. I. P., F. Raulier, P. Y. Bernier, S. Gauthier, Y. Bergeron, and D. Pothier, 2015: Lengthening the historical records of fire history over large areas of boreal forest in eastern Canada using empirical relationships. Forest Ecology and Management, 347, 30-39, doi:10.1016/j.foreco.2015.03.011.
- Villamayor, J., and E. Mohino, 2015: Robust Sahel drought due to the Interdecadal Pacific Oscillation in CMIP5 simulations. Geophysical Research Letters, 42, 1214-1222, doi:10.1002/2014GL062473.
- Wadey, M. P., and Coauthors, 2015: A comparison of the 31 January-1 February 1953 and 5-6 December 2013 coastal flood events around the UK. Frontiers in Marine Science, 2, doi:10.3389/fmars.2015.00084.
- Wahl, T., S. Jain, J. Bender, S. D. Meyers, and M. E. Luther, 2015: Increasing risk of compound flooding from storm surge and rainfall for major US cities. Nature Climate Change, 5, 1093-+, doi:10.1038/NCLIMATE2736.
- Wahl, T., and N. G. Plant, 2015: Changes in erosion and flooding risk due to long-term and cyclic oceanographic trends. Geophysical Research Letters, 42, 2943-2950, doi:10.1002/2015GL063876.
- Walker, J. M., S. Bordoni, and T. Schneider, 2015: Interannual Variability in the Large-Scale Dynamics of the South Asian Summer Monsoon. J. Clim., 28, 3731-3750, doi:10.1175/JCLI-D-14-00612.1.
- Wang, B., B. Xiang, J. Li, P. J. Webster, M. N. Rajeevan, J. Liu, and K.-J. Ha, 2015: Rethinking Indian monsoon rainfall prediction in the context of recent global warming. Nature Communications, 6, doi:10.1038/ncomms8154.
- Wang, C., 2015: Anthropogenic aerosols and the distribution of past large-scale precipitation change. Geophysical Research Letters, 42, 10876-10884, doi:10.1002/2015GL066416.
- Wang, X., C. Wang, L. Zhang, and X. Wang, 2015: Multidecadal Variability of Tropical Cyclone Rapid Intensification in the Western North Pacific. J. Clim., 28, 3806-3820, doi:10.1175/JCLI-D-14-00400.1.
- Wapler, K., and P. James, 2015: Thunderstorm occurrence and characteristics in Central Europe under different synoptic conditions. Atmospheric Research, 158, 231-244, doi:10.1016/j.atmosres.2014.07.011.
- Way, R. G., and P. P. Bonnaventure, 2015: Testing a reanalysis-based infilling method for areas with sparse discontinuous air temperature data in northeastern Canada. Atmospheric Science Letters, 16, 398-407, doi:10.1002/asl2.574.
- Wee, T. K., and Y. H. Kuo, 2015: A perspective on the fundamental quality of GPS radio occultation data. Atmos Meas Tech, 8, 4281-4294, doi:10.5194/amt-8-4281-2015.
- Welker, C., and O. Martius, 2015: Large-scale atmospheric flow conditions and sea surface temperatures associated with hazardous winds in Switzerland. Climate Dynamics, 44, 1857-1869, doi:10.1007/s00382-014-2404-1.
- Wilton, D. J., G. R. Bigg, and E. Hanna, 2015: Modelling twentieth century global ocean circulation and iceberg flux at 48 degrees N: implications for west Greenland iceberg discharge. Prog Oceanogr, 138, 194-210, doi:10.1016/j.pocean.2015.07.003.
- Winter, A., and Coauthors, 2015: Persistent drying in the tropics linked to natural forcing. Nature Communications, 6, doi:10.1038/ncomms8627.
- Wise, E. K., 2015: Short Communication Tropical Pacific and Northern Hemisphere influences on the coherence of Pacific Decadal Oscillation reconstructions. International Journal of Climatology, 35, 154-160, doi:10.1002/joc.3966.
- Wise, E. K., M. L. Wrzesien, M. P. Dannenberg, and D. L. McGinnis, 2015: Cool-Season Precipitation Patterns Associated with Teleconnection Interactions in the United States. Journal of Applied Meteorology and Climatology, 54, 494-505, doi:10.1175/JAMC-D-14-0040.1.
- Woollings, T., C. Franzke, D. L. R. Hodson, B. Dong, E. A. Barnes, C. C. Raible, and J. G. Pinto, 2015: Contrasting interannual and multidecadal NAO variability. Climate Dynamics, 45, 539-556, doi:10.1007/s00382-014-2237-y.
- Wright, W. E., B. T. Guan, Y. H. Tseng, E. R. Cook, K. Y. Wei, and S. T. Chang, 2015: Reconstruction of the springtime East Asian Subtropical Jet and Western Pacific pattern from a millennial-length Taiwanese tree-ring chronology. Climate Dynamics, 44, 1645-1659, doi:10.1007/s00382-014-2402-3.
- Wu, L., and C. Wang, 2015: Has the Western Pacific Subtropical High Extended Westward since the Late 1970s? J. Clim., 28, 5406-5413, doi:10.1175/JCLI-D-14-00618.1.
- Xing, L., and Coauthors, 2015: TEX86 paleothermometer as an indication of bottom water temperature in the Yellow Sea. Organic Geochemistry, 86, 19-31, doi:10.1016/j.orggeochem.2015.05.007.
- Yan, L., and G. Li, 2015: Change in the Relationship between the Southern Subtropical Dipole Modes and the Southern Annular Mode in the Mid-1980s. J. Clim., 28, 9235-9249, doi:10.1175/JCLI-D-15-0134.1.
- Yang, J., Z.-H. Wang, and K. E. Kaloush, 2015: Environmental impacts of reflective materials: Is high albedo a 'silver bullet' for mitigating urban heat island? Renewable & Sustainable Energy Reviews, 47, 830-843, doi:10.1016/j.rser.2015.03.092.
- Yang, Y., S.-P. Xie, Y. Du, and H. Tokinaga, 2015: Interdecadal Difference of Interannual Variability Characteristics of South China Sea SSTs Associated with ENSO. J. Clim., 28, 7145-7160, doi:10.1175/JCLI-D-15-0057.1.
- Yi, D. L., L. Zhang, and L. Wu, 2015: On the mechanisms of decadal variability of the North Pacific Gyre Oscillation over the 20th century. Journal of Geophysical Research-Oceans, 120, 6114-6129, doi:10.1002/2014JC010660.
- Yokoi, S., 2015: Multireanalysis Comparison of Variability in Column Water Vapor and Its Analysis Increment Associated with the Madden-Julian Oscillation. J. Clim., 28, 793-808, doi:10.1175/JCLI-D-14-00465.1.
- Yoon, J.-H., S. Y. S. Wang, R. R. Gillies, B. Kravitz, L. Hipps, and P. J. Rasch, 2015: Increasing water cycle extremes in California and in relation to ENSO cycle under global warming. Nature Communications, 6, doi:10.1038/ncomms9657.
- Yoshimura, K., 2015: Stable Water Isotopes in Climatology, Meteorology, and Hydrology: A Review. Journal of the Meteorological Society of Japan, 93, 513-533, doi:10.2151/jmsj.2015-036.
- You, Q., J. Min, W. Zhang, N. Pepin, and S. Kang, 2015: Comparison of multiple datasets with gridded precipitation observations over the Tibetan Plateau. Climate Dynamics, 45, 791-806, doi:10.1007/s00382-014-2310-6.
- Yu, J.-Y., P.-K. Kao, H. Paek, H.-H. Hsu, C.-W. Hung, M.-M. Lu, and S.-I. An, 2015: Linking Emergence of the Central Pacific El Nino to the Atlantic Multidecadal Oscillation. J. Clim., 28, 651-662, doi:10.1175/JCLI-D-14-00347.1.
- Yun, K.-S., S.-W. Yeh, and K.-J. Ha, 2015: Covariability of western tropical Pacific-North Pacific atmospheric circulation during summer. Scientific Reports, 5, doi:10.1038/srep16980.
- Zampieri, M., E. Scoccimarro, S. Gualdi, and A. Navarra, 2015: Observed shift towards earlier spring discharge in the main Alpine rivers. Science of the Total Environment, 503, 222-232, doi:10.1016/j.scitotenv.2014.06.036.
- Zanchettin, D., O. Bothe, F. Lehner, P. Ortega, C. C. Raible, and D. Swingedouw, 2015: Reconciling reconstructed and simulated features of the winter Pacific/North American pattern in the early 19th century. Climate of the Past, 11, 939-958, doi:10.5194/cp-11-939-2015.
- Zaninelli, P. G., A. F. Carril, and C. G. Menéndez, 2015: Explorando temperaturas máximas y mínimas en diferentes reanálisis: Parte 1: campos medios estacionales. Meteorologica, 40, 43-58, doi:Zhang, L., and T. L. Delworth, 2015: Analysis of the Characteristics and Mechanisms of the Pacific Decadal Oscillation in a Suite of Coupled Models from the Geophysical Fluid Dynamics Laboratory. J. Clim., 28, 7678-7701, doi:10.1175/JCLI-D-14-00647.1.
- Zhang, Q., K. Holmgren, and H. Sundqvist, 2015: Decadal Rainfall Dipole Oscillation over Southern Africa Modulated by Variation of Austral Summer Land-Sea Contrast along the East Coast of Africa. J Atmos Sci, 72, 1827-1836, doi:10.1175/JAS-D-14-0079.1.
- Zhang, X., L. Jin, and N. Li, 2015: Asynchronous variation in the East Asian winter monsoon during the Holocene. Journal of Geophysical Research-Atmospheres, 120, 5357-5370, doi:10.1002/2014JD022585.
- Zhao, T., J. Wang, and A. Dai, 2015: Evaluation of atmospheric precipitable water from reanalysis products using homogenized radiosonde observations over China. Journal of Geophysical Research-Atmospheres, 120, 10703-10727, doi:10.1002/2015JD023906.
2014
- 2014: The Global Climate System and Causes of Climate Change. Osterreichischer Sachstandsbericht Klimawandel 2014, Bd 1-3, 137-171.
- Abatzoglou, J. T., D. E. Rupp, and P. W. Mote, 2014: Questionable evidence of natural warming of the northwestern United States. Proceedings of the National Academy of Sciences of the United States of America, 111, E5605-E5606, doi:10.1073/pnas.1421311112.
- Abatzoglou, J. T., D. E. Rupp, and P. W. Mote, 2014: Seasonal Climate Variability and Change in the Pacific Northwest of the United States. J. Clim., 27, 2125-2142, doi:10.1175/JCLI-D-13-00218.1.
- Adam, O., T. Schneider, and N. Harnik, 2014: Role of Changes in Mean Temperatures versus Temperature Gradients in the Recent Widening of the Hadley Circulation. J. Clim., 27, 7450-7461, doi:10.1175/JCLI-D-14-00140.1.
- Adolphi, F., and Coauthors, 2014: Persistent link between solar activity and Greenland climate during the Last Glacial Maximum. Nature Geoscience, 7, 662-666, doi:10.1038/NGEO2225.
- Alexander, M. A., K. H. Kilbourne, and J. A. Nye, 2014: Climate variability during warm and cold phases of the Atlantic Multidecadal Oscillation (AMO) 1871-2008. Journal of Marine Systems, 133, 14-26, doi:10.1016/j.jmarsys.2013.07.017.
- Allen, R. J., J. R. Norris, and M. Kovilakam, 2014: Influence of anthropogenic aerosols and the Pacific Decadal Oscillation on tropical belt width. Nature Geoscience, 7, 270-274, doi:10.1038/ngeo2091.
- Amaya, D. J., and G. R. Foltz, 2014: Impacts of canonical and Modoki El Nino on tropical Atlantic SST. Journal of Geophysical Research-Oceans, 119, 777-789, doi:10.1002/2013JC009476.
- Andrews, J. T., G. R. Bigg, and D. J. Wilton, 2014: Holocene ice-rafting and sediment transport from the glaciated margin of East Greenland (67-70 degrees N) to the N Iceland shelves: detecting and modelling changing sediment sources. Quaternary Science Reviews, 91, 204-217, doi:10.1016/j.quascirev.2013.08.019.
- Arizmendi, F., A. C. Marti, and M. Barreiro, 2014: Evolution of atmospheric connectivity in the 20th century. Nonlinear Proc Geoph, 21, 825-839, doi:10.5194/npg-21-825-2014.
- Ashcroft, L., J. Gergis, and D. J. Karoly, 2014: A historical climate dataset for southeastern Australia, 1788-1859. Geoscience Data Journal, 1, 158-178, doi:10.1002/gdj3.19.
- Ashcroft, L., D. J. Karoly, and J. Gergis, 2014: Southeastern Australian climate variability 1860-2009: a multivariate analysis. International Journal of Climatology, 34, 1928-1944, doi:10.1002/joc.3812.
- Barbu, N., V. Cuculeanu, and S. Stefan, 2014: Modeling the Precipitation Amounts Dynamics for Different Time Scales in Romania Using Multiple Regression Approach. Romanian Journal of Physics, 59, 1127-1149, doi:Barreiro, M., N. Diaz, and M. Renom, 2014: Role of the global oceans and land-atmosphere interaction on summertime interdecadal variability over northern Argentina. Climate Dynamics, 42, 1733-1753, doi:10.1007/s00382-014-2088-6.
- Barriopedro, D., D. Gallego, M. Carmen Alvarez-Castro, R. Garcia-Herrera, D. Wheeler, C. Pena-Ortiz, and S. M. Barbosa, 2014: Witnessing North Atlantic westerlies variability from ships' logbooks (1685-2008). Climate Dynamics, 43, 939-955, doi:10.1007/s00382-013-1957-8. Basu, S., C. G. Nunalee, P. He, S. T. Fiorino, and M. A. Vorontsov, 2014: Reconstructing the Prevailing Meteorological and Optical Environment during the Time of the Titanic Disaster. Laser Communication and Propagation through the Atmosphere and Oceans Iii.
- Begueria, S., S. M. Vicente-Serrano, F. Reig, and B. Latorre, 2014: Standardized precipitation evapotranspiration index (SPEI) revisited: parameter fitting, evapotranspiration models, tools, datasets and drought monitoring. International Journal of Climatology, 34, 3001-3023, doi:10.1002/joc.3887.
- Beitsch, A., J. H. Jungclaus, and D. Zanchettin, 2014: Patterns of decadal-scale Arctic warming events in simulated climate. Climate Dynamics, 43, 1773-1789, doi:10.1007/s00382-013-2004-5.
- Bichet, A., D. Folini, M. Wild, and C. Schaer, 2014: Enhanced Central European summer precipitation in the late 19th century: a link to the Tropics. Quarterly Journal of the Royal Meteorological Society, 140, 111-123, doi:10.1002/qj.2111.
- Bigg, G. R., H. L. Wei, D. J. Wilton, Y. Zhao, S. A. Billings, E. Hanna, and V. Kadirkamanathan, 2014: A century of variation in the dependence of Greenland iceberg calving on ice sheet surface mass balance and regional climate change. Proceedings of the Royal Society a-Mathematical Physical and Engineering Sciences, 470, doi:10.1098/rspa.2013.0662.
- Bigg, G. R., and D. J. Wilton, 2014: Iceberg risk in the Titanic year of 1912: was it exceptional? Weather, 69, 100-104, doi:10.1002/wea.2238. Bindoff, N. L., and Coauthors, 2014: Detection and Attribution of Climate Change: from Global to Regional. Climate Change 2013: The Physical Science Basis, 867-952.
- Blunden, J., and Coauthors, 2014: State of the Climate in 2013. Bulletin of the American Meteorological Society, 95, S1-S257, doi:10.1175/2014BAMSStateoftheClimate.1.
- Boe, J., and F. Habets, 2014: Multi-decadal river flow variations in France. Hydrology and Earth System Sciences, 18, 691-708, doi:10.5194/hess-18-691-2014.
- Bojinski, S., M. Verstraete, T. C. Peterson, C. Richter, A. Simmons, and M. Zemp, 2014: The Concept of Essential Climate Variables in Support of Climate Research, Applications, and Policy. Bulletin of the American Meteorological Society, 95, 1431-1443, doi:10.1175/BAMS-D-13-00047.1.
- Borchi, F., and Y. M. Tourre, 2014: Influences of atmospheric and oceanic low-frequency climate fluctuations on European winter surface air temperatures (1870-2010). Climate Research, 59, 117-124, doi:10.3354/cr01209.
- Breilh, J.-F., X. Bertin, E. Chaumillon, N. Giloy, and T. Sauzeau, 2014: How frequent is storm-induced flooding in the central part of the Bay of Biscay? Global and Planetary Change, 122, 161-175, doi:10.1016/j.gloplacha.2014.08.013.
- Breitenmoser, P., S. Broennimann, and D. Frank, 2014: Forward modelling of tree-ring width and comparison with a global network of tree-ring chronologies. Climate of the Past, 10, 437-449, doi:10.5194/cp-10-437-2014.
- Breivik, O., O. J. Aarnes, S. Abdalla, J.-R. Bidlot, and P. A. E. M. Janssen, 2014: Wind and wave extremes over the world oceans from very large ensembles. Geophysical Research Letters, 41, 5122-5131, doi:10.1002/2014GL060997.
- Calafat, F. M., D. P. Chambers, and M. N. Tsimplis, 2014: On the ability of global sea level reconstructions to determine trends and variability. Journal of Geophysical Research-Oceans, 119, 1572-1592, doi:10.1002/2013JC009298.
- Camus, P., and Coauthors, 2014: A weather-type statistical downscaling framework for ocean wave climate. Journal of Geophysical Research-Oceans, 119, 7389-7405, doi:10.1002/2014JC010141.
- Capa-Morocho, M., B. Rodriguez-Fonseca, and M. Ruiz-Ramos, 2014: Crop yield as a bioclimatic index of El Nino impact in Europe: Crop forecast implications. Agricultural and Forest Meteorology, 198, 42-52, doi:10.1016/j.agrformet.2014.07.012.
- Chappell, P. R., and A. M. Lorrey, 2014: Identifying New Zealand, Southeast Australia, and Southwest Pacific historical weather data sources using Ian Nicholson's Log of Logs. Geoscience Data Journal, 1, 49-60, doi:10.1002/gdj3.1.
- Chen, S., K. Wei, W. Chen, and L. Song, 2014: Regional changes in the annual mean Hadley circulation in recent decades. Journal of Geophysical Research-Atmospheres, 119, doi:10.1002/2014JD021540.
- Chen, W., R. Lu, and B. Dong, 2014: Intensified anticyclonic anomaly over the western North Pacific during El Nino decaying summer under a weakened Atlantic thermohaline circulation. Journal of Geophysical Research-Atmospheres, 119, 13637-13650, doi:10.1002/2014JD022199.
- Chepurin, G. A., J. A. Carton, and E. Leuliette, 2014: Sea level in ocean reanalyses and tide gauges. Journal of Geophysical Research-Oceans, 119, 147-155, doi:10.1002/2013JC009365.
- Chowdary, J. S., N. John, and C. Gnanaseelan, 2014: Interannual variability of surface air-temperature over India: impact of ENSO and Indian Ocean Sea surface temperature. International Journal of Climatology, 34, 416-429, doi:10.1002/joc.3695.
- Ciancarelli, B., C. L. Castro, C. Woodhouse, F. Dominguez, H.-I. Chang, C. Carrillo, and D. Griffin, 2014: Dominant patterns of US warm season precipitation variability in a fine resolution observational record, with focus on the southwest. International Journal of Climatology, 34, 687-707, doi:10.1002/joc.3716.
- Comas-Bru, L., and F. McDermott, 2014: Impacts of the EA and SCA patterns on the European twentieth century NAO-winter climate relationship. Quarterly Journal of the Royal Meteorological Society, 140, 354-363, doi:10.1002/qj.2158.
- Cook, B. I., R. Seager, and J. E. Smerdon, 2014: The worst North American drought year of the last millennium: 1934. Geophysical Research Letters, 41, 7298-7305, doi:10.1002/2014GL061661.
- Cornes, R. C., 2014: Historic storms of the northeast Atlantic since circa 1700: a brief review of recent research. Weather, 69, 121-125, doi:10.1002/wea.2289.
- Cowtan, K., and R. G. Way, 2014: Coverage bias in the HadCRUT4 temperature series and its impact on recent temperature trends. Quarterly Journal of the Royal Meteorological Society, 140, 1935-1944, doi:10.1002/qj.2297.
- Cropper, T. E., and E. Hanna, 2014: An analysis of the climate of Macaronesia, 1865-2012. International Journal of Climatology, 34, 604-622, doi:10.1002/joc.3710.
- Cropper, T. E., E. Hanna, and G. R. Bigg, 2014: Spatial and temporal seasonal trends in coastal upwelling off Northwest Africa, 1981-2012. Deep-Sea Research Part I-Oceanographic Research Papers, 86, 94-111, doi:10.1016/j.dsr.2014.01.007.
- Dangendorf, S., F. M. Calafat, A. Arns, T. Wahl, I. D. Haigh, and J. Jensen, 2014: Mean sea level variability in the North Sea: Processes and implications. Journal of Geophysical Research-Oceans, 119, 6820-6841, doi:10.1002/2014JC009901.
- Dangendorf, S., S. Mueller-Navarra, J. Jensen, F. Schenk, T. Wahl, and R. Weisse, 2014: North Sea Storminess from a Novel Storm Surge Record since AD 1843. J. Clim., 27, 3582-3595, doi:10.1175/JCLI-D-13-00427.1.
- Dangendorf, S., D. Rybski, C. Mudersbach, A. Mueller, E. Kaufmann, E. Zorita, and J. Jensen, 2014: Evidence for long-term memory in sea level. Geophysical Research Letters, 41, 5530-5537, doi:10.1002/2014GL060538.
- Dangendorf, S., T. Wahl, E. Nilson, B. Klein, and J. Jensen, 2014: A new atmospheric proxy for sea level variability in the southeastern North Sea: observations and future ensemble projections. Climate Dynamics, 43, 447-467, doi:10.1007/s00382-013-1932-4.
- Davy, R., and I. Esau, 2014: Surface air temperature variability in global climate models. Atmospheric Science Letters, 15, 13-20, doi:10.1002/asl2.456.
- de Boer, G., and Coauthors, 2014: Near-surface meteorology during the Arctic Summer Cloud Ocean Study (ASCOS): evaluation of reanalyses and global climate models. Atmospheric Chemistry and Physics, 14, 427-445, doi:10.5194/acp-14-427-2014.
- de Boisseson, E., M. A. Balmaseda, S. Abdalla, E. Kaellen, and P. A. E. M. Janssen, 2014: How robust is the recent strengthening of the Tropical Pacific trade winds? Geophysical Research Letters, 41, 4398-4405, doi:10.1002/2014GL060257.
- Dee, D. P., M. Balmaseda, G. Balsam, R. Engelen, A. J. Simmons, and J. N. Thepaut, 2014: Toward a Consistent Reanalysis of the Climate System. Bulletin of the American Meteorological Society, 95, 1235-1248, doi:10.1175/BAMS-D-13-00043.1.
- Deser, C., A. S. Phillips, M. A. Alexander, and B. V. Smoliak, 2014: Projecting North American Climate over the Next 50 Years: Uncertainty due to Internal Variability*. J. Clim., 27, 2271-2296, doi:10.1175/JCLI-D-13-00451.1.
- Dole, R., and Coauthors, 2014: The Making of an Extreme Event. Bulletin of the American Meteorological Society, 95, 427-440, doi:10.1175/BAMS-D-12-00069.1.
- Dotto, T. S., R. Kerr, M. M. Mata, M. Azaneu, I. Wainer, E. Fahrbach, and G. Rohardt, 2014: Assessment of the structure and variability of Weddell Sea water masses in distinct ocean reanalysis products. Ocean Science, 10, 523-546, doi:10.5194/os-10-523-2014.
- Dowdy, A. J., 2014: Long-term changes in Australian tropical cyclone numbers. Atmospheric Science Letters, 15, 292-298, doi:10.1002/asl2.502.
- Drenkard, E. J., and K. B. Karnauskas, 2014: Strengthening of the Pacific Equatorial Undercurrent in the SODA Reanalysis: Mechanisms, Ocean Dynamics, and Implications. J. Clim., 27, 2405-2416, doi:10.1175/JCLI-D-13-00359.1.
- Drobyshev, I., M. Niklasson, M. J. Mazerolle, and Y. Bergeron, 2014: Reconstruction of a 253-year long mast record of European beech reveals its association with large scale temperature variability and no long-term trend in mast frequencies. Agricultural and Forest Meteorology, 192, 9-17, doi:10.1016/j.agrformet.2014.02.010.
- England, M. H., and Coauthors, 2014: Recent intensification of wind-driven circulation in the Pacific and the ongoing warming hiatus. Nature Climate Change, 4, 222-227, doi:10.1038/NCLIMATE2106.
- Fang, K., D. Chen, J. Li, and H. Seppa, 2014: Covarying Hydroclimate Patterns between Monsoonal Asia and North America over the Past 600 Years. J. Clim., 27, 8017-8033, doi:10.1175/JCLI-D-13-00364.1.
- Feng, X., and P. Houser, 2014: An examination of potential seasonal predictability in recent reanalyses. Atmospheric Science Letters, 15, 266-274, doi:10.1002/asl2.498.
- Feng, X.-L., H. Zhi, P.-F. Lin, and H.-L. Liu, 2014: Assessment of Historical Climate Trends of Surface Air Temperature in CMIPS Models. Atmospheric and Oceanic Science Letters, 7, 137-142, doi:10.3878/j.issn.1674-2834.13.0081.
- Ferguson, C. R., and G. Villarini, 2014: An evaluation of the statistical homogeneity of the Twentieth Century Reanalysis. Climate Dynamics, 42, 2841-2866, doi:10.1007/s00382-013-1996-1.
- Filippi, L., E. Palazzi, J. von Hardenberg, and A. Provenzale, 2014: Multidecadal Variations in the Relationship between the NAO and Winter Precipitation in the Hindu Kush-Karakoram. J. Clim., 27, 7890-7902, doi:10.1175/JCLI-D-14-00286.1.
- Francois, B., and Coauthors, 2014: Integrating hydropower and intermittent climate-related renewable energies: a call for hydrology. Hydrological Processes, 28, 5465-5468, doi:10.1002/hyp.10274.
- Fussell, E., L. M. Hunter, and C. L. Gray, 2014: Measuring the environmental dimensions of human migration: The demographer's toolkit. Global Environmental Change-Human and Policy Dimensions, 28, 182-191, doi:10.1016/j.gloenvcha.2014.07.001.
- Gan, B., and L. Wu, 2014: Centennial trends in Northern Hemisphere winter storm tracks over the twentieth century. Quarterly Journal of the Royal Meteorological Society, 140, 1945-1957, doi:10.1002/qj.2263.
- Gehne, M., R. Kleeman, and K. E. Trenberth, 2014: Irregularity and decadal variation in ENSO: a simplified model based on Principal Oscillation Patterns. Climate Dynamics, 43, 3327-3350, doi:10.1007/s00382-014-2108-6.
- Goes, M., I. Wainer, and N. Signorelli, 2014: Investigation of the causes of historical changes in the subsurface salinity minimum of the South Atlantic. Journal of Geophysical Research-Oceans, 119, 5654-5675, doi:10.1002/2014JC009812.
- Gordon, A. L., and C. F. Giulivi, 2014: Ocean eddy freshwater flux convergence into the North Atlantic subtropics. Journal of Geophysical Research-Oceans, 119, 3327-3335, doi:10.1002/2013JC009596.
- Grainger, S., C. S. Frederiksen, and X. Zheng, 2014: Assessment of Modes of Interannual Variability of Southern Hemisphere Atmospheric Circulation in CMIP5 Models. J. Clim., 27, 8107-8125, doi:10.1175/JCLI-D-14-00251.1.
- Grooms, I., Y. Lee, and A. J. Majda, 2014: Ensemble Kalman filters for dynamical systems with unresolved turbulence. Journal of Computational Physics, 273, 435-452, doi:10.1016/j.jcp.2014.05.037.
- Grumm, R., J. M. Arnott, and J. Halblaub, 2014: The Epic Eastern North American Warm Episode of March 2012. J Oper Meteorol, 2, 36-50, doi:10.15191/nwajom.2014.0204.
- Han, J.-P., G. Liu, and Y.-F. Xin, 2014: A Dipole Pattern of Summer Precipitation over Mid-high Latitude Asia and Related Snow Cover Anomalies in the Preceding Spring. Atmospheric and Oceanic Science Letters, 7, 364-368, doi:10.3878/j.issn.1674-2834.14.0012. Hartmann, D. L., and Coauthors, 2014: Observations: Atmosphere and Surface. Climate Change 2013: The Physical Science Basis, 159-254.
- Hartten, L. M., and P. E. Johnston, 2014: Stratocumulus-Topped Marine Boundary Layer Processes Revealed by the Absence of Profiler Reflectivity. Journal of Applied Meteorology and Climatology, 53, 1775-1789, doi:10.1175/JAMC-D-12-0308.1.
- Hastenrath, S., and D. Polzin, 2014: Variability of circulation and Sahel rainfall in the twentieth century. International Journal of Climatology, 34, 1693-1698, doi:10.1002/joc.3740. Hewitson, B., and Coauthors, 2014: Regional Context. Climate Change 2014: Impacts, Adaptation, and Vulnerability, Pt B: Regional Aspects: Working Group Ii Contribution to the Fifth Assessment Report of the Intergovernmental Panel on Climate Change, 1133-1197.
- Hong, L., L. Zhang, Z. Chen, and L. Wu, 2014: Linkage between the Pacific Decadal Oscillation and the low frequency variability of the Pacific Subtropical Cell. Journal of Geophysical Research-Oceans, 119, 3464-3477, doi:10.1002/2013JC009650.
- Hwang, S., W. D. Graham, J. S. Geurink, and A. Adams, 2014: Hydrologic implications of errors in bias-corrected regional reanalysis data for west central Florida. Journal of Hydrology, 510, 513-529, doi:10.1016/j.jhydrol.2013.11.042.
- Ionita, M., S. Chelcea, N. Rimbu, and M.-J. Adler, 2014: Spatial and temporal variability of winter streamflow over Romania and its relationship to large-scale atmospheric circulation. Journal of Hydrology, 519, 1339-1349, doi:10.1016/j.jhydrol.2014.09.024.
- Ionita, M., T. Felis, G. Lohmann, N. Rimbu, and J. Paetzold, 2014: Distinct modes of East Asian Winter Monsoon documented by a southern Red Sea coral record. Journal of Geophysical Research-Oceans, 119, 1517-1533, doi:10.1002/2013JC009203.
- Izumo, T., M. Lengaigne, J. Vialard, J.-J. Luo, T. Yamagata, and G. Madec, 2014: Influence of Indian Ocean Dipole and Pacific recharge on following year's El Nino: interdecadal robustness. Climate Dynamics, 42, 291-310, doi:10.1007/s00382-012-1628-1.
- Jacques-Coper, M., and S. Broennimann, 2014: Summer temperature in the eastern part of southern South America: its variability in the twentieth century and a teleconnection with Oceania. Climate Dynamics, 43, 2111-2130, doi:10.1007/s00382-013-2038-8.
- Jensen, J., S. Dangendorf, T. Wahl, and H. Steffen, 2014: Sea level changes in the North Sea region: recent developments and future challenges with focus on the German Bight. Hydrologie Und Wasserbewirtschaftung, 58, 304-323, doi:10.5675/HyWa_2014,6_1.
- Johnstone, J. A., and N. J. Mantua, 2014: Atmospheric controls on northeast Pacific temperature variability and change, 1900-2012. Proceedings of the National Academy of Sciences of the United States of America, 111, 14360-14365, doi:10.1073/pnas.1318371111.
- Jones, P. D., T. J. Osborn, C. Harpham, and K. R. Briffa, 2014: The development of Lamb weather types: from subjective analysis of weather charts to objective approaches using reanalyses. Weather, 69, 128-132, doi:10.1002/wea.2255.
- Jorda, G., 2014: Detection time for global and regional sea level trends and accelerations. Journal of Geophysical Research-Oceans, 119, 7164-7174, doi:10.1002/2014JC010005.
- Kayano, M. T., and V. B. Capistrano, 2014: How the Atlantic multidecadal oscillation (AMO) modifies the ENSO influence on the South American rainfall. International Journal of Climatology, 34, 162-178, doi:10.1002/joc.3674.
- Kent, E. C., D. I. Berry, J. Prytherch, and J. B. Roberts, 2014: A comparison of global marine surface-specific humidity datasets from in situ observations and atmospheric reanalysis. International Journal of Climatology, 34, 355-376, doi:10.1002/joc.3691.
- Kim, D., M.-I. Lee, D. Kim, S. D. Schubert, D. E. Waliser, and B. Tian, 2014: Representation of tropical subseasonal variability of precipitation in global reanalyses. Climate Dynamics, 43, 517-534, doi:10.1007/s00382-013-1890-x.
- Kim, W., and W. Cai, 2014: The importance of the eastward zonal current for generating extreme El Nio. Climate Dynamics, 42, 3005-3014, doi:10.1007/s00382-013-1792-y.
- King, A. D., N. P. Klingaman, L. V. Alexander, M. G. Donat, N. C. Jourdain, and P. Maher, 2014: Extreme Rainfall Variability in Australia: Patterns, Drivers, and Predictability. J. Clim., 27, 6035-6050, doi:10.1175/JCLI-D-13-00715.1.
- Kobayashi, C., and Coauthors, 2014: Preliminary Results of the JRA-55C, an Atmospheric Reanalysis Assimilating Conventional Observations Only. Sola, 10, 78-82, doi:10.2151/sola.2014-016.
- Konecky, B., J. Russell, M. Vuille, and K. Rehfeld, 2014: The Indian Ocean Zonal Mode over the past millennium in observed and modeled precipitation isotopes. Quaternary Science Reviews, 103, 1-18, doi:10.1016/j.quascirev.2014.08.019.
- Kravtsov, S., M. G. Wyatt, J. A. Curry, and A. A. Tsonis, 2014: Two contrasting views of multidecadal climate variability in the twentieth century. Geophysical Research Letters, 41, 6881-6888, doi:10.1002/2014GL061416.
- Krishnamurthy, L., and V. Krishnamurthy, 2014: Influence of PDO on South Asian summer monsoon and monsoon-ENSO relation. Climate Dynamics, 42, 2397-2410, doi:10.1007/s00382-013-1856-z.
- Krueger, O., F. Feser, L. Barring, E. Kaas, T. Schmith, H. Tuomenvirta, and H. von Storch, 2014: Comment on "Trends and low frequency variability of extra-tropical cyclone activity in the ensemble of twentieth century reanalysis" by Xiaolan L. Wang, Y. Feng, G. P. Compo, V. R. Swail, F. W. Zwiers, R. J. Allan, and P. D. Sardeshmukh, Climate Dynamics, 2012. Climate Dynamics, 42, 1127-1128, doi:10.1007/s00382-013-1814-9.
- Kruschke, T., H. W. Rust, C. Kadow, G. C. Leckebusch, and U. Ulbrich, 2014: Evaluating decadal predictions of northern hemispheric cyclone frequencies. Tellus Series a-Dynamic Meteorology and Oceanography, 66, doi:10.3402/tellusa.v66.22830.
- Kuwano-Yoshida, A., 2014: Using the Local Deepening Rate to Indicate Extratropical Cyclone Activity. Sola, 10, 199-203, doi:10.2151/sola.2014-042.
- Lahoz, W. A., and P. Schneider, 2014: Data assimilation: making sense of Earth Observation. Frontiers in Environmental Science, 2, doi:10.3389/fenvs.2014.00016.
- Langford, S., S. Stevenson, and D. Noone, 2014: Analysis of Low-Frequency Precipitation Variability in CMIP5 Historical Simulations for Southwestern North America. J. Clim., 27, 2735-2756, doi:10.1175/JCLI-D-13-00317.1. Lavers, D. A., D. M. Hannah, and C. Bradley, 2014: Linking variations in large-scale climatic circulation and high groundwater levels in southern England. Hydrology in a Changing World: Environmental and Human Dimensions, 102-106.
- Lee, D. E., and M. Biasutti, 2014: Climatology and Variability of Precipitation in the Twentieth-Century Reanalysis. J. Clim., 27, 5964-5981, doi:10.1175/JCLI-D-13-00630.1.
- Lee, J.-Y., and B. Wang, 2014: Future change of global monsoon in the CMIP5. Climate Dynamics, 42, 101-119, doi:10.1007/s00382-012-1564-0.
- Lee, S.-K., P. N. DiNezio, E.-S. Chung, S.-W. Yeh, A. T. Wittenberg, and C. Wang, 2014: Spring persistence, transition, and resurgence of El Nino. Geophysical Research Letters, 41, 8578-8585, doi:10.1002/2014GL062484.
- Lei, L., and J. L. Anderson, 2014: Impacts of Frequent Assimilation of Surface Pressure Observations on Atmospheric Analyses. Monthly Weather Review, 142, 4477-4483, doi:10.1175/MWR-D-14-00097.1.
- Liberato, M. L. R., 2014: The 19 January 2013 windstorm over the North Atlantic: large-scale dynamics and impacts on Iberia. Weather and Climate Extremes, 5-6, 16-28, doi:10.1016/j.wace.2014.06.002.
- Lindsay, R., M. Wensnahan, A. Schweiger, and J. Zhang, 2014: Evaluation of Seven Different Atmospheric Reanalysis Products in the Arctic*. J. Clim., 27, 2588-2606, doi:10.1175/JCLI-D-13-00014.1.
- Liu, Y., L. Wang, W. Zhou, and W. Chen, 2014: Three Eurasian teleconnection patterns: spatial structures, temporal variability, and associated winter climate anomalies. Climate Dynamics, 42, 2817-2839, doi:10.1007/s00382-014-2163-z.
- Liu, Z., K. Yoshimura, G. J. Bowen, N. H. Buenning, C. Risi, J. M. Welker, and F. Yuan, 2014: Paired oxygen isotope records reveal modern North American atmospheric dynamics during the Holocene. Nature Communications, 5, doi:10.1038/ncomms4701.
- Lucas, C., B. Timbal, and H. Nguyen, 2014: The expanding tropics: a critical assessment of the observational and modeling studies. Wiley Interdisciplinary Reviews-Climate Change, 5, 89-112, doi:10.1002/wcc.251.
- Luebbecke, J. F., N. J. Burls, C. J. C. Reason, and M. J. McPhaden, 2014: Variability in the South Atlantic Anticyclone and the Atlantic Nino Mode. J. Clim., 27, 8135-8150, doi:10.1175/JCLI-D-14-00202.1.
- Lyon, B., A. G. Barnston, and D. G. DeWitt, 2014: Tropical pacific forcing of a 1998-1999 climate shift: observational analysis and climate model results for the boreal spring season. Climate Dynamics, 43, 893-909, doi:10.1007/s00382-013-1891-9.
- MacLeod, D. A., and A. P. Morse, 2014: Visualizing the uncertainty in the relationship between seasonal average climate and malaria risk. Scientific Reports, 4, doi:10.1038/srep07264(2014).
- Madaus, L. E., G. J. Hakim, and C. F. Mass, 2014: Utility of Dense Pressure Observations for Improving Mesoscale Analyses and Forecasts. Monthly Weather Review, 142, 2398-2413, doi:10.1175/MWR-D-13-00269.1.
- Manzanas, R., L. K. Amekudzi, K. Preko, S. Herrera, and J. M. Gutierrez, 2014: Precipitation variability and trends in Ghana: An intercomparison of observational and reanalysis products. Climatic Change, 124, 805-819, doi:10.1007/s10584-014-1100-9.
- Mariani, I., A. Eichler, T. M. Jenk, S. Broennimann, R. Auchmann, M. C. Leuenberger, and M. Schwikowski, 2014: Temperature and precipitation signal in two Alpine ice cores over the period 1961-2001. Climate of the Past, 10, 1093-1108, doi:10.5194/cp-10-1093-2014.
- Martin-Rey, M., B. Rodriguez-Fonseca, I. Polo, and F. Kucharski, 2014: On the Atlantic-Pacific Ninos connection: a multidecadal modulated mode. Climate Dynamics, 43, 3163-3178, doi:10.1007/s00382-014-2305-3.
- Massa, C., M. Doyle, and R. Callico Fortunato, 2014: On how Cattle Egret (Bubulcus ibis) spread to the Americas: meteorological tools to assess probable colonization trajectories. International Journal of Biometeorology, 58, 1879-1891, doi:10.1007/s00484-014-0790-z.
- Matthews, T., C. Murphy, R. L. Wilby, and S. Harrigan, 2014: Stormiest winter on record for Ireland and UK. Nature Climate Change, 4, 738-740, doi:10.1038/nclimate2336.
- Mauro Vargas-Hernandez, J., S. Wijffels, G. Meyers, and N. J. Holbrook, 2014: Evaluating SODA for Indo-Pacific Ocean decadal climate variability studies. Journal of Geophysical Research-Oceans, 119, 7854-7868, doi:10.1002/2014JC010175.
- McAfee, S. A., 2014: Consistency and the Lack Thereof in Pacific Decadal Oscillation Impacts on North American Winter Climate. J. Clim., 27, 7410-7431, doi:10.1175/JCLI-D-14-00143.1.
- McGregor, S., A. Timmermann, M. F. Stuecker, M. H. England, M. Merrifield, F.-F. Jin, and Y. Chikamoto, 2014: Recent Walker circulation strengthening and Pacific cooling amplified by Atlantic warming. Nature Climate Change, 4, 888-892, doi:10.1038/NCLIMATE2330.
- Mortin, J., R. G. Graversen, and G. Svensson, 2014: Evaluation of pan-Arctic melt-freeze onset in CMIP5 climate models and reanalyses using surface observations. Climate Dynamics, 42, 2239-2257, doi:10.1007/s00382-013-1811-z.
- Mueller, W. A., H. Pohlmann, F. Sienz, and D. Smith, 2014: Decadal climate predictions for the period 1901-2010 with a coupled climate model. Geophysical Research Letters, 41, 2100-2107, doi:10.1002/2014GL059259.
- Muthers, S., and Coauthors, 2014: The coupled atmosphere-chemistry-ocean model SOCOL-MPIOM. Geoscientific Model Development, 7, 2157-2179, doi:10.5194/gmd-7-2157-2014.
- Nag, B., V. Misra, and S. Bastola, 2014: Validating ENSO Teleconnections on Southeastern US Winter Hydrology. Earth Interactions, 18, doi:10.1175/EI-D-14-0007.1.
- Neff, W., G. P. Compo, F. M. Ralph, and M. D. Shupe, 2014: Continental heat anomalies and the extreme melting of the Greenland ice surface in 2012 and 1889. Journal of Geophysical Research-Atmospheres, 119, 6520-6536, doi:10.1002/2014JD021470.
- Nicholson, S. E., 2014: Spatial teleconnections in African rainfall: A comparison of 19th and 20th century patterns. Holocene, 24, 1840-1848, doi:10.1177/0959683614551230.
- Nordli, O., R. Przybylak, A. E. J. Ogilvie, and K. Isaksen, 2014: Long-term temperature trends and variability on Spitsbergen: the extended Svalbard Airport temperature series, 1898-2012. Polar Research, 33, doi:10.3402/polar.v33.21349.
- Omstedt, A., J. Elken, A. Lehmann, M. Lepparanta, H. E. M. Meier, K. Myrberg, and A. Rutgersson, 2014: Progress in physical oceanography of the Baltic Sea during the 2003-2014 period. Prog Oceanogr, 128, 139-171, doi:10.1016/j.pocean.2014.08.010.
- Ortega, P., and Coauthors, 2014: Characterizing atmospheric circulation signals in Greenland ice cores: insights from a weather regime approach. Climate Dynamics, 43, 2585-2605, doi:10.1007/s00382-014-2074-z.
- Osterberg, E. C., P. A. Mayewski, D. A. Fisher, K. J. Kreutz, K. A. Maasch, S. B. Sneed, and E. Kelsey, 2014: Mount Logan ice core record of tropical and solar influences on Aleutian Low variability: 500-1998 AD. Journal of Geophysical Research-Atmospheres, 119, 11189-11204, doi:10.1002/2014JD021847.
- Pang, H., S. Hou, S. Kaspari, and P. A. Mayewski, 2014: Influence of regional precipitation patterns on stable isotopes in ice cores from the central Himalayas. Cryosphere, 8, 289-301, doi:10.5194/tc-8-289-2014.
- Paris, F., S. Lecacheux, D. Idier, and E. Charles, 2014: Assessing wave climate trends in the Bay of Biscay through an intercomparison of wave hindcasts and reanalyses. Ocean Dynamics, 64, 1247-1267, doi:10.1007/s10236-014-0746-1.
- Partasenok, I. S., P. Y. Groisman, G. S. Chekan, and V. I. Melnik, 2014: Winter cyclone frequency and following freshet streamflow formation on the rivers in Belarus. Environmental Research Letters, 9, doi:10.1088/1748-9326/9/9/095005.
- Peings, Y., and G. Magnusdottir, 2014: Forcing of the wintertime atmospheric circulation by the multidecadal fluctuations of the North Atlantic ocean. Environmental Research Letters, 9, doi:10.1088/1748-9326/9/3/034018.
- Pena Rabadan, J. C., and L. Schulte, 2014: Effects of solar activity and climate variability on large floods in Switzerland. Boletin De La Asociacion De Geografos Espanoles, 249-270, doi:10.21138/bage.1752.
- Perez, J., M. Menendez, F. J. Mendez, and I. J. Losada, 2014: Evaluating the performance of CMIP3 and CMIP5 global climate models over the north-east Atlantic region. Climate Dynamics, 43, 2663-2680, doi:10.1007/s00382-014-2078-8.
- Polzin, D., and S. Hastenrath, 2014: Climate of Brazil's nordeste and tropical atlantic sector: preferred time scales of variability tempo das variabilidades preferenciais. Revista Brasileira de Meteorologia, 29, 153-160, doi:10.1590/S0102-77862014000200001.
- Porter, S. E., and E. Mosley-Thompson, 2014: Exploring seasonal accumulation bias in a west central Greenland ice core with observed and reanalyzed data. Journal of Glaciology, 60, 1065-1074, doi:10.3189/2014JoG13J233.
- Porter, T. J., and Coauthors, 2014: Spring-summer temperatures since AD 1780 reconstructed from stable oxygen isotope ratios in white spruce tree-rings from the Mackenzie Delta, northwestern Canada. Climate Dynamics, 42, 771-785, doi:10.1007/s00382-013-1674-3.
- Pralungo, L. R., and L. Haimberger, 2014: A "Global Radiosonde and tracked-balloon Archive on Sixteen Pressure levels" (GRASP) going back to 1905-Part 2: homogeneity adjustments for pilot balloon and radiosonde wind data. Earth System Science Data, 6, 297-316, doi:10.5194/essd-6-297-2014.
- Pralungo, L. R., L. Haimberger, A. Stickler, and S. Broennimann, 2014: A global radiosonde and tracked balloon archive on 16 pressure levels (GRASP) back to 1905-Part 1: Merging and interpolation to 00:00 and 12:00GMT. Earth System Science Data, 6, 185-200, doi:10.5194/essd-6-185-2014.
- Qian, C., and T. Zhou, 2014: Multidecadal Variability of North China Aridity and Its Relationship to PDO during 1900-2010. J. Clim., 27, 1210-1222, doi:10.1175/JCLI-D-13-00235.1.
- Raible, C. C., F. Lehner, J. F. Gonzalez-Rouco, and L. Fernandez-Donado, 2014: Changing correlation structures of the Northern Hemisphere atmospheric circulation from 1000 to 2100 AD. Climate of the Past, 10, 537-550, doi:10.5194/cp-10-537-2014.
- Ratnam, M. V., Y. D. Santhi, P. Kishore, and S. V. B. Rao, 2014: Solar cycle effects on Indian summer monsoon dynamics. Journal of Atmospheric and Solar-Terrestrial Physics, 121, 145-156, doi:10.1016/j.jastp.2014.06.012. Redmond, K. T., and J. T. Abatzoglou, 2014: Current Climate and Recent Trends. Climate Change in North America, 53-94.
- Rennie, J. J., and Coauthors, 2014: The international surface temperature initiative global land surface databank: monthly temperature data release description and methods. Geoscience Data Journal, 1, 75-102, doi:10.1002/gdj3.8. Rhein, M., and Coauthors, 2014: Observations: Ocean. Climate Change 2013: The Physical Science Basis, 255-315.
- Rimbu, N., G. Lohmann, and M. Ionita, 2014: Interannual to multidecadal Euro-Atlantic blocking variability during winter and its relationship with extreme low temperatures in Europe. Journal of Geophysical Research-Atmospheres, 119, 13621-13636, doi:10.1002/2014JD021983.
- Roberts, J. F., and Coauthors, 2014: The XWS open access catalogue of extreme European windstorms from 1979 to 2012. Natural Hazards and Earth System Sciences, 14, 2487-2501, doi:10.5194/nhess-14-2487-2014.
- Robertson, F. R., and Coauthors, 2014: Consistency of Estimated Global Water Cycle Variations over the Satellite Era. J. Clim., 27, 6135-6154, doi:10.1175/JCLI-D-13-00384.1.
- Robson, J., R. Sutton, and D. Smith, 2014: Decadal predictions of the cooling and freshening of the North Atlantic in the 1960s and the role of ocean circulation. Climate Dynamics, 42, 2353-2365, doi:10.1007/s00382-014-2115-7.
- Ruiz Alvarez, V., A. Sanchez-Lorenzo, and R. Garcia Marin, 2014: Creation of a database with long series of precipitation in the Region of Murcia (Southeast Spain) and temporal analysis of the annual average series, 1914-2013. Revista De Climatologia, 14, 81-97, doi:Rutgersson, A., J. Jaagus, F. Schenk, and M. Stendel, 2014: Observed changes and variability of atmospheric parameters in the Baltic Sea region during the last 200 years. Climate Research, 61, 177-190, doi:10.3354/cr01244.
- Saarnak, E., H. Bergstrom, and S. Soderberg, 2014: Uncertainties Connected to Long-term Correction of Wind Observations. Wind Engineering, 38, 233-248, doi:10.1260/0309-524X.38.3.233.
- Sachindra, D. A., F. Huang, A. Barton, and B. J. C. Perera, 2014: Statistical downscaling of general circulation model outputs to catchment scale hydroclimatic variables: issues, challenges and possible solutions. Journal of Water and Climate Change, 5, 496-525, doi:10.2166/wcc.2014.056.
- Salvatteci, R., and Coauthors, 2014: The response of the Peruvian Upwelling Ecosystem to centennial-scale global change during the last two millennia. Climate of the Past, 10, 715-731, doi:10.5194/cp-10-715-2014.
- Sandeep, S., F. Stordal, P. D. Sardeshmukh, and G. P. Compo, 2014: Pacific Walker Circulation variability in coupled and uncoupled climate models. Climate Dynamics, 43, 103-117, doi:10.1007/s00382-014-2135-3.
- Schimanke, S., C. Dieterich, and H. E. M. Meier, 2014: An algorithm based on sea-level pressure fluctuations to identify major Baltic inflow events. Tellus Series a-Dynamic Meteorology and Oceanography, 66, doi:10.3402/tellusa.v66.23452.
- Schindelegger, M., and R. D. Ray, 2014: Surface Pressure Tide Climatologies Deduced from a Quality-Controlled Network of Barometric Observations. Monthly Weather Review, 142, 4872-4889, doi:10.1175/MWR-D-14-00217.1.
- Schmidt, G. A., and Coauthors, 2014: Using palaeo-climate comparisons to constrain future projections in CMIP5. Climate of the Past, 10, 221-250, doi:10.5194/cp-10-221-2014.
- Seager, R., and M. Hoerling, 2014: Atmosphere and Ocean Origins of North American Droughts. J. Clim., 27, 4581-4606, doi:10.1175/JCLI-D-13-00329.1. Serreze, M. C., and R. G. Barry, 2014: Arctic Climate System, 2nd Edition. Arctic Climate System, 2nd Edition, 1-404.
- Seubert, S., and Coauthors, 2014: Mediterranean climate extremes in synoptic downscaling assessments. Theoretical and Applied Climatology, 117, 257-275, doi:10.1007/s00704-013-0993-y.
- Shan, H., Y. Guan, and J. Huang, 2014: Surface air temperature patterns on a decadal scale in China using self-organizing map and their relationship to Indo-Pacific warm pool. International Journal of Climatology, 34, 3752-3765, doi:10.1002/joc.3943.
- Shi, N., and H. Nakamura, 2014: Multi-decadal modulations in the Aleutian-Icelandic Low seesaw and the axial symmetry of the Arctic Oscillation signature, as revealed in the 20th century reanalysis. Tellus Series a-Dynamic Meteorology and Oceanography, 66, doi:10.3402/tellusa.v66.22660.
- Shukla, S. P., M. J. Puma, and B. I. Cook, 2014: The response of the South Asian Summer Monsoon circulation to intensified irrigation in global climate model simulations. Climate Dynamics, 42, 21-36, doi:10.1007/s00382-013-1786-9.
- Simmons, A. J., P. Poli, D. P. Dee, P. Berrisford, H. Hersbach, S. Kobayashi, and C. Peubey, 2014: Estimating low-frequency variability and trends in atmospheric temperature using ERA-Interim. Quarterly Journal of the Royal Meteorological Society, 140, 329-353, doi:10.1002/qj.2317.
- Skliris, N., R. Marsh, S. A. Josey, S. A. Good, C. Liu, and R. P. Allan, 2014: Salinity changes in the World Ocean since 1950 in relation to changing surface freshwater fluxes. Climate Dynamics, 43, 709-736, doi:10.1007/s00382-014-2131-7.
- Smith, C. A., G. P. Compo, and D. K. Hooper, 2014: Web-Based Reanalysis Intercomparison Tools (WRIT) for Analysis and Comparison of Reanalyses and Other Datasets. Bulletin of the American Meteorological Society, 95, 1671-1678, doi:10.1175/BAMS-D-13-00192.1.
- Staten, P. W., and T. Reichler, 2014: On the ratio between shifts in the eddy-driven jet and the Hadley cell edge. Climate Dynamics, 42, 1229-1242, doi:10.1007/s00382-013-1905-7.
- Steiger, N. J., G. J. Hakim, E. J. Steig, D. S. Battisti, and G. H. Roe, 2014: Assimilation of Time-Averaged Pseudoproxies for Climate Reconstruction. J. Clim., 27, 426-441, doi:10.1175/JCLI-D-12-00693.1.
- Stickler, A., and Coauthors, 2014: Description of the ERA-CLIM historical upper-air data. Earth System Science Data, 6, 29-48, doi:10.5194/essd-6-29-2014.
- Stickler, A., and Coauthors, 2014: ERA-CLIM Historical Surface and Upper-Air Data for Future Reanalyses. Bulletin of the American Meteorological Society, 95, 1419-1430, doi:10.1175/BAMS-D-13-00147.1.
- Stucki, P., S. Brnoenimann, O. Martius, C. Welker, M. Imhof, N. von Wattenwyl, and N. Philipp, 2014: A catalog of high-impact windstorms in Switzerland since 1859. Natural Hazards and Earth System Sciences, 14, 2867-2882, doi:10.5194/nhess-14-2867-2014.
- Sviderskyte, G., G. Stankunavicius, and E. Rimkus, 2014: Weather conditions during a transatlantic flight of Lituanica on July 15-17, 1933. Baltica, 27, 119-130, doi:10.5200/baltica.2014.27.21.
- Swart, N. C., J. C. Fyfe, O. A. Saenko, and M. Eby, 2014: Wind-driven changes in the ocean carbon sink. Biogeosciences, 11, 6107-6117, doi:10.5194/bg-11-6107-2014.
- Tardif, R., G. J. Hakim, and C. Snyder, 2014: Coupled atmosphere-ocean data assimilation experiments with a low-order climate model. Climate Dynamics, 43, 1631-1643, doi:10.1007/s00382-013-1989-0.
- Terzago, S., J. von Hardenberg, E. Palazzi, and A. Provenzale, 2014: Snowpack Changes in the Hindu Kush-Karakoram-Himalaya from CMIP5 Global Climate Models. Journal of Hydrometeorology, 15, 2293-2313, doi:10.1175/JHM-D-13-0196.1.
- Thibeault, J. M., and A. Seth, 2014: A Framework for Evaluating Model Credibility for Warm-Season Precipitation in Northeastern North America: A Case Study of CMIP5 Simulations and Projections. J. Clim., 27, 493-510, doi:10.1175/JCLI-D-12-00846.1.
- Tian, X.-J., 2014: A Local Implementation of the POD-Based Ensemble 4DVar with R-Localization. Atmospheric and Oceanic Science Letters, 7, 11-16, doi:10.3878/j.issn.1674-2834.13.0046.
- Ting, M., Y. Kushnir, and C. Li, 2014: North Atlantic Multidecadal SST Oscillation: External forcing versus internal variability. Journal of Marine Systems, 133, 27-38, doi:10.1016/j.jmarsys.2013.07.006.
- Titchner, H. A., and N. A. Rayner, 2014: The Met Office Hadley Centre sea ice and sea surface temperature data set, version 2: 1. Sea ice concentrations. Journal of Geophysical Research-Atmospheres, 119, 2864-2889, doi:10.1002/2013JD020316.
- Traeger-Chatterjee, C., R. W. Mueller, and J. Bendix, 2014: Analysis and Discussion of Atmospheric Precursor of European Heat Summers. Advances in Meteorology, doi:10.1155/2014/427916.
- Trigo, R. M., and Coauthors, 2014: The record precipitation and flood event in Iberia in December 1876: description and synoptic analysis. Frontiers in Earth Science, 2, doi:10.3389/feart.2014.00003.
- Turco, M., R. Marcos, P. Quintana-Segui, and M. C. Llasat, 2014: Testing instrumental and downscaled reanalysis time series for temperature trends in NE of Spain in the last century. Regional Environmental Change, 14, 1811-1823, doi:10.1007/s10113-012-0363-9.
- Ulate, M., J. Dudhia, and C. Zhang, 2014: Sensitivity of the water cycle over the Indian Ocean and Maritime Continent to parameterized physics in a regional model. Journal of Advances in Modeling Earth Systems, 6, 1095-1120, doi:10.1002/2014MS000313.
- Villafuerte, M. Q., II, J. Matsumoto, I. Akasaka, H. G. Takahashi, H. Kubota, and T. A. Cinco, 2014: Long-term trends and variability of rainfall extremes in the Philippines. Atmospheric Research, 137, 1-13, doi:10.1016/j.atmosres.2013.09.021.
- Wagman, B. M., C. S. Jackson, F. Yao, S. E. Zedler, and I. Hoteit, 2014: Metric of the 2-6 day sea-surface temperature response to wind stress in the Tropical Pacific and its sensitivity to the K-Profile Parameterization of vertical mixing. Ocean Modelling, 79, 54-64, doi:10.1016/j.ocemod.2014.04.003.
- Wahl, E. R., H. F. Diaz, J. E. Smerdon, and C. M. Ammann, 2014: Late winter temperature response to large tropical volcanic eruptions in temperate western North America: Relationship to ENSO phases. Global and Planetary Change, 122, 238-250, doi:10.1016/j.gloplacha.2014.08.005.
- Wahl, T., F. M. Calafat, and M. E. Luther, 2014: Rapid changes in the seasonal sea level cycle along the US Gulf coast from the late 20th century. Geophysical Research Letters, 41, 491-498, doi:10.1002/2013GL058777.
- Wang, B., S.-Y. Yim, J.-Y. Lee, J. Liu, and K.-J. Ha, 2014: Future change of Asian-Australian monsoon under RCP 4.5 anthropogenic warming scenario. Climate Dynamics, 42, 83-100, doi:10.1007/s00382-013-1769-x.
- Wang, H., and S. Schubert, 2014: The Precipitation Response over the Continental United States to Cold Tropical Pacific Sea Surface Temperatures. J. Clim., 27, 5036-5055, doi:10.1175/JCLI-D-13-00453.1.
- Wang, P. X., B. Wang, H. Cheng, J. Fasullo, Z. T. Guo, T. Kiefer, and Z. Y. Liu, 2014: The global monsoon across timescales: coherent variability of regional monsoons. Climate of the Past, 10, 2007-2052, doi:10.5194/cp-10-2007-2014.
- Wang, S. Y., L. Hipps, R. R. Gillies, and J.-H. Yoon, 2014: Probable causes of the abnormal ridge accompanying the 2013-2014 California drought: ENSO precursor and anthropogenic warming footprint. Geophysical Research Letters, 41, 3220-3226, doi:10.1002/2014GL059748.
- Wang, X., and C. Wang, 2014: Different impacts of various El Nino events on the Indian Ocean Dipole. Climate Dynamics, 42, 991-1005, doi:10.1007/s00382-013-1711-2.
- Wang, X. L., Y. Feng, G. P. Compo, F. W. Zwiers, R. J. Allan, V. R. Swail, and P. D. Sardeshmukh, 2014: Is the storminess in the Twentieth Century Reanalysis really inconsistent with observations? A reply to the comment by Krueger et al. (2013b). Climate Dynamics, 42, 1113-1125, doi:10.1007/s00382-013-1828-3.
- Wang, Y.-H., G. Magnusdottir, H. Stern, X. Tian, and Y. Yu, 2014: Uncertainty Estimates of the EOF-Derived North Atlantic Oscillation. J. Clim., 27, 1290-1301, doi:10.1175/JCLI-D-13-00230.1.
- Welker, C., M. Bieli, N. Piaget, and M. Sprenger, 2014: The D-Day landing of June 1944: extratropical cyclones and surface winds in June 1944 compared with a climatology based on the Twentieth Century Reanalysis. Weather, 69, 176-180, doi:10.1002/wea.2339.
- Welker, C., and O. Martius, 2014: Decadal-scale variability in hazardous winds in northern Switzerland since end of the 19th century. Atmospheric Science Letters, 15, 86-91, doi:10.1002/asl2.467.
- Wilson, A. M., and J. A. Silander, Jr., 2014: Estimating uncertainty in daily weather interpolations: a Bayesian framework for developing climate surfaces. International Journal of Climatology, 34, 2573-2584, doi:10.1002/joc.3859.
- Wise, E. K., and M. P. Dannenberg, 2014: Persistence of pressure patterns over North America and the North Pacific since AD 1500. Nature Communications, 5, doi:10.1038/ncomms5912.
- Woillez, M. N., G. Levavasseur, A. L. Daniau, M. Kageyama, D. H. Urrego, M. F. Sanchez-Goni, and V. Hanquiez, 2014: Impact of precession on the climate, vegetation and fire activity in southern Africa during MIS4. Climate of the Past, 10, 1165-1182, doi:10.5194/cp-10-1165-2014.
- Woodworth, P. L., M. A. M. Maqueda, V. M. Roussenov, R. G. Williams, and C. W. Hughes, 2014: Mean sea-level variability along the northeast American Atlantic coast and the roles of the wind and the overturning circulation. Journal of Geophysical Research-Oceans, 119, 8916-8935, doi:10.1002/2014JC010520.
- Woollings, T., C. Czuchnicki, and C. Franzke, 2014: Twentieth century North Atlantic jet variability. Quarterly Journal of the Royal Meteorological Society, 140, 783-791, doi:10.1002/qj.2197.
- Wu, L., X. L. Wang, and Y. Feng, 2014: Historical wave height trends in the South and East China Seas, 1911-2010. Journal of Geophysical Research-Oceans, 119, 4399-4409, doi:10.1002/2014JC010087.
- Wu, Y., and O. Pauluis, 2014: Midlatitude Tropopause and Low-Level Moisture. J Atmos Sci, 71, 1187-1200, doi:10.1175/JAS-D-13-0154.1.
- Xie, A., I. Allison, C. Xiao, S. Wang, J. Ren, and D. Qin, 2014: Assessment of surface pressure between Zhongshan and Dome A in East Antarctica from different meteorological reanalyses. Arct Antarct Alp Res, 46, 669-681, doi:10.1657/1938-4246-46.3.669.
- Xie, A., I. Allison, C. Xiao, S. Wang, J. Ren, and D. Qin, 2014: Assessment of air temperatures from different meteorological reanalyses for the East Antarctic region between Zhongshan and Dome A. Science China-Earth Sciences, 57, 1538-1550, doi:10.1007/s11430-013-4684-4.
- Xin, Y.-F., G. Liu, and Q.-H. Jin, 2014: Individual Variations of Winter Surface Air Temperature over Northwest and Northeast China and Their Respective Preceding Factors. Atmospheric and Oceanic Science Letters, 7, 346-351, doi:10.3878/j.issn.1674-2834.14.0010.
- Yang, C., B. S. Giese, and L. Wu, 2014: Ocean dynamics and tropical Pacific climate change in ocean reanalyses and coupled climate models. Journal of Geophysical Research-Oceans, 119, 7066-7077, doi:10.1002/2014JC009979.
- Yeo, S.-R., and K.-Y. Kim, 2014: Global warming, low-frequency variability, and biennial oscillation: an attempt to understand the physical mechanisms driving major ENSO events. Climate Dynamics, 43, 771-786, doi:10.1007/s00382-013-1862-1.
- Ying, K.-R., T.-B. Zhao, and X.-G. Zheng, 2014: Slow and Intraseasonal Modes of the Boreal Winter Atmospheric Circulation Simulated by CMIP5 Models. Atmospheric and Oceanic Science Letters, 7, 34-41, doi:10.3878/j.issn.1674-2834.13.0058.
- Yiou, P., and Coauthors, 2014: Ensemble meteorological reconstruction using circulation analogues of 1781-1785. Climate of the Past, 10, 797-809, doi:10.5194/cp-10-797-2014.
- Yu, B., X. L. Wang, X. B. Zhang, J. Cole, and Y. Feng, 2014: Decadal Covariability of the Northern Wintertime Land Surface Temperature and Atmospheric Circulation. J. Clim., 27, 633-651, doi:10.1175/JCLI-D-13-00266.1.
- Zhai, F., D. Hu, Q. Wang, and F. Wang, 2014: Long-term trend of Pacific South Equatorial Current bifurcation over 1950-2010. Geophysical Research Letters, 41, 3172-3180, doi:10.1002/2014GL059934.
- Zhang, L., C. Wang, and S.-K. Lee, 2014: Potential role of Atlantic Warm Pool-induced freshwater forcing in the Atlantic Meridional Overturning Circulation: ocean-sea ice model simulations. Climate Dynamics, 43, 553-574, doi:10.1007/s00382-013-2034-z.
- Zhao, P., and Coauthors, 2014: Trend of Surface Air Temperature in Eastern China and Associated Large-Scale Climate Variability over the Last 100 Years. J. Clim., 27, 4693-4703, doi:10.1175/JCLI-D-13-00397.1.
- Zinke, J., and Coauthors, 2014: Corals record long-term Leeuwin current variability including Ningaloo Nino/Nina since 1795. Nature Communications, 5, doi:10.1038/ncomms4607.
2013
- Ambrosino, C., and R. E. Chandler, 2013: A Nonparametric Approach to the Removal of Documented Inhomogeneities in Climate Time Series. Journal of Applied Meteorology and Climatology, 52, 1139-1146, doi:10.1175/JAMC-D-12-0166.1.
- Anderson, B. T., J. C. Furtado, K. M. Cobb, and E. Di Lorenzo, 2013: Extratropical forcing of El Nino-Southern Oscillation asymmetry. Geophysical Research Letters, 40, 4916-4921, doi:10.1002/grl.50951.
- Araujo, I. B., M. S. Bos, L. C. Bastos, and M. M. Cardoso, 2013: Analysing the 100 year sea level record of Leixoes, Portugal. Journal of Hydrology, 481, 76-84, doi:10.1016/j.jhydrol.2012.12.019.
- Arns, A., T. Wahl, S. Dangendorf, C. Mudersbach, and J. Jensen, 2013: Determination of regionalised extreme water levels for the North Sea Coast of Schleswig-Holstein. Hydrologie Und Wasserbewirtschaftung, 57, 264-278, doi:10.5675/HyWa_2013,6_1.
- Barrier, N., A.-M. Treguier, C. Cassou, and J. Deshayes, 2013: Impact of the winter North-Atlantic weather regimes on subtropical sea-surface height variability. Climate Dynamics, 41, 1159-1171, doi:10.1007/s00382-012-1578-7.
- Belleflamme, A., X. Fettweis, C. Lang, and M. Erpicum, 2013: Current and future atmospheric circulation at 500 hPa over Greenland simulated by the CMIP3 and CMIP5 global models. Climate Dynamics, 41, 2061-2080, doi:10.1007/s00382-012-1538-2.
- Benestad, R. E., 2013: Are there persistent physical atmospheric responses to galactic cosmic rays? Environmental Research Letters, 8, doi:10.1088/1748-9326/8/3/035049.
- Bengtsson, L., 2013: What is the climate system able to do 'on its own'? Tellus Series B-Chemical and Physical Meteorology, 65, doi:10.3402/tellusb.v65i0.20189.
- Bertin, X., E. Prouteau, and C. Letetrel, 2013: A significant increase in wave height in the North Atlantic Ocean over the 20th century. Global and Planetary Change, 106, 77-83, doi:10.1016/j.gloplacha.2013.03.009.
- Bett, P. E., H. E. Thornton, and R. T. Clark, 2013: European wind variability over 140 yr. Advances in Science and Research, 10, 51-58, doi:10.5194/asr-10-51-2013.
- Bhend, J., and P. Whetton, 2013: Consistency of simulated and observed regional changes in temperature, sea level pressure and precipitation. Climatic Change, 118, 799-810, doi:10.1007/s10584-012-0691-2.
- Blunden, J., and Coauthors, 2013: State of the Climate in 2012. Bulletin of the American Meteorological Society, 94, S1-S240, doi:10.1175/2013BAMSStateoftheClimate.1.
- Box, J. E., 2013: Greenland Ice Sheet Mass Balance Reconstruction. Part II: Surface Mass Balance (1840-2010). J. Clim., 26, 6974-6989, doi:10.1175/JCLI-D-12-00518.1.
- Brigode, P., P. Bernardara, J. Gailhard, F. Garavaglia, P. Ribstein, and R. Merz, 2013: Optimization of the geopotential heights information used in a rainfall-based weather patterns classification over Austria. International Journal of Climatology, 33, 1563-1573, doi:10.1002/joc.3535.
- Brigode, P., Z. Micovic, P. Bernardara, E. Paquet, F. Garavaglia, J. Gailhard, and P. Ribstein, 2013: Linking ENSO and heavy rainfall events over coastal British Columbia through a weather pattern classification. Hydrology and Earth System Sciences, 17, 1455-1473, doi:10.5194/hess-17-1455-2013.
- Broennimann, S., and Coauthors, 2013: A global historical ozone data set and prominent features of stratospheric variability prior to 1979. Atmospheric Chemistry and Physics, 13, 9623-9639, doi:10.5194/acp-13-9623-2013.
- Broennimann, S., I. Mariani, M. Schwikowski, R. Auchmann, and A. Eichler, 2013: Simulating the temperature and precipitation signal in an Alpine ice core. Climate of the Past, 9, 2013-2022, doi:10.5194/cp-9-2013-2013.
- Broennimann, S., and A. Stickler, 2013: Aerological observations in the Tropics in the Early Twentieth Century. Meteorologische Zeitschrift, 22, 349-358, doi:10.1127/0941-2948/2013/0458.
- Brooks, H. E., 2013: Severe thunderstorms and climate change. Atmospheric Research, 123, 129-138, doi:10.1016/j.atmosres.2012.04.002.
- Brown, P. J., and A. T. DeGaetano, 2013: Trends in U.S. Surface Humidity, 1930-2010. Journal of Applied Meteorology and Climatology, 52, 147-163, doi:10.1175/JAMC-D-12-035.1.
- Brugnara, Y., S. Broennimann, J. Luterbacher, and E. Rozanov, 2013: Influence of the sunspot cycle on the Northern Hemisphere wintertime circulation from long upper-air data sets. Atmospheric Chemistry and Physics, 13, 6275-6288, doi:10.5194/acp-13-6275-2013.
- Bumbaco, K. A., K. D. Dello, and N. A. Bond, 2013: History of Pacific Northwest Heat Waves: Synoptic Pattern and Trends. Journal of Applied Meteorology and Climatology, 52, 1618-1631, doi:10.1175/JAMC-D-12-094.1.
- Capotondi, A., 2013: ENSO diversity in the NCAR CCSM4 climate model. Journal of Geophysical Research-Oceans, 118, 4755-4770, doi:10.1002/jgrc.20335.
- Cattiaux, J., B. Quesada, A. Arakelian, F. Codron, R. Vautard, and P. Yiou, 2013: North-Atlantic dynamics and European temperature extremes in the IPSL model: sensitivity to atmospheric resolution. Climate Dynamics, 40, 2293-2310, doi:10.1007/s00382-012-1529-3.
- Chakravorty, S., J. S. Chowdary, and C. Gnanaseelan, 2013: Spring asymmetric mode in the tropical Indian Ocean: role of El Nino and IOD. Climate Dynamics, 40, 1467-1481, doi:10.1007/s00382-012-1340-1.
- Chen, H. W., Q. Zhang, H. Kornich, and D. Chen, 2013: A robust mode of climate variability in the Arctic: The Barents Oscillation. Geophysical Research Letters, 40, 2856-2861, doi:10.1002/grl.50551.
- Chernokulsky, A., I. I. Mokhov, and N. Nikitina, 2013: Winter cloudiness variability over Northern Eurasia related to the Siberian High during 1966-2010. Environmental Research Letters, 8, doi:10.1088/1748-9326/8/4/045012.
- Chung, E.-S., B. J. Soden, B. J. Sohn, and J. Schmetz, 2013: An assessment of the diurnal variation of upper tropospheric humidity in reanalysis data sets. Journal of Geophysical Research-Atmospheres, 118, 3425-3430, doi:10.1002/jgrd.50345.
- Compo, G. P., P. D. Sardeshmukh, J. S. Whitaker, P. Brohan, P. D. Jones, and C. McColl, 2013: Independent confirmation of global land warming without the use of station temperatures. Geophysical Research Letters, 40, 3170-3174, doi:10.1002/grl.50425.
- Cornes, R. C., and P. D. Jones, 2013: How well does the ERA-Interim reanalysis replicate trends in extremes of surface temperature across Europe? Journal of Geophysical Research-Atmospheres, 118, 10262-10276, doi:10.1002/jgrd.50799.
- Cortesi, N., R. M. Trigo, J. C. Gonzalez-Hidalgo, and A. M. Ramos, 2013: Modelling monthly precipitation with circulation weather types for a dense network of stations over Iberia. Hydrology and Earth System Sciences, 17, 665-678, doi:10.5194/hess-17-665-2013.
- Dai, A., H. Li, Y. Sun, L.-C. Hong, L. Ho, C. Chou, and T. Zhou, 2013: The relative roles of upper and lower tropospheric thermal contrasts and tropical influences in driving Asian summer monsoons. Journal of Geophysical Research-Atmospheres, 118, 7024-7045, doi:10.1002/jgrd.50565.
- Dangendorf, S., C. Mudersbach, J. Jensen, G. Anette, and H. Heinrich, 2013: Seasonal to decadal forcing of high water level percentiles in the German Bight throughout the last century. Ocean Dynamics, 63, 533-548, doi:10.1007/s10236-013-0614-4.
- Dangendorf, S., C. Mudersbach, T. Wahl, and J. Jensen, 2013: Characteristics of intra-, inter-annual and decadal sea-level variability and the role of meteorological forcing: the long record of Cuxhaven. Ocean Dynamics, 63, 209-224, doi:10.1007/s10236-013-0598-0.
- Dangendorf, S., T. Wahl, C. Mudersbach, and J. Jensen, 2013: The Seasonal Mean Sea Level Cycle in the Southeastern North Sea. Journal of Coastal Research, 1915-1920, doi:10.2112/SI65-324.1.
- Dannenberg, M. P., and E. K. Wise, 2013: Performance of climate field reconstruction methods over multiple seasons and climate variables. Journal of Geophysical Research-Atmospheres, 118, 9595-9610, doi:10.1002/jgrd.50765.
- de Winter, R. C., A. Sterl, and B. G. Ruessink, 2013: Wind extremes in the North Sea Basin under climate change: An ensemble study of 12 CMIP5 GCMs. Journal of Geophysical Research-Atmospheres, 118, 1601-1612, doi:10.1002/jgrd.50147.
- Diamond, H. J., A. M. Lorrey, and J. A. Renwick, 2013: A Southwest Pacific Tropical Cyclone Climatology and Linkages to the El Nino-Southern Oscillation. J. Clim., 26, 3-25, doi:10.1175/JCLI-D-12-00077.1.
- Diaz, H. F., and T. W. Swetnam, 2013: THE WILDFIRES OF 1910 Climatology of an Extreme Early Twentieth-Century Event and Comparison with More Recent Extremes. Bulletin of the American Meteorological Society, 94, 1361-1370, doi:10.1175/BAMS-D-12-00150.1.
- Dieppois, B., and Coauthors, 2013: Quasi-decadal signals of Sahel rainfall and West African monsoon since the mid-twentieth century. Journal of Geophysical Research-Atmospheres, 118, 12587-12599, doi:10.1002/2013JD019681. Dijkstra, H. A., 2013: Nonlinear Climate Dynamics. Nonlinear Climate Dynamics, 1-357.
- Dominguez-Castro, F., R. M. Trigo, and J. M. Vaquero, 2013: The first meteorological measurements in the Iberian Peninsula: evaluating the storm of November 1724. Climatic Change, 118, 443-455, doi:10.1007/s10584-012-0628-9.
- Du, Y., W. Cai, and Y. Wu, 2013: A New Type of the Indian Ocean Dipole since the Mid-1970s. J. Clim., 26, 959-972, doi:10.1175/JCLI-D-12-00047.1.
- Dunstone, N. J., D. M. Smith, B. B. B. Booth, L. Hermanson, and R. Eade, 2013: Anthropogenic aerosol forcing of Atlantic tropical storms. Nature Geoscience, 6, 534-539, doi:10.1038/NGEO1854.
- El Fadli, K. I., and Coauthors, 2013: WORLD METEOROLOGICAL ORGANIZATION ASSESSMENT OF THE PURPORTED WORLD RECORD 58 degrees C TEMPERATURE EXTREME AT EL AZIZIA, LIBYA (13 SEPTEMBER 1922). Bulletin of the American Meteorological Society, 94, 199-204, doi:10.1175/BAMS-D-12-00093.1.
- Emanuel, K., and A. Sobel, 2013: Response of tropical sea surface temperature, precipitation, and tropical cyclone-related variables to changes in global and local forcing. Journal of Advances in Modeling Earth Systems, 5, 447-458, doi:10.1002/jame.20032.
- Emanuel, K., S. Solomon, D. Folini, S. Davis, and C. Cagnazzo, 2013: Influence of Tropical Tropopause Layer Cooling on Atlantic Hurricane Activity. J. Clim., 26, 2288-2301, doi:10.1175/JCLI-D-12-00242.1.
- Evans, M. N., S. E. Tolwinski-Ward, D. M. Thompson, and K. J. Anchukaitis, 2013: Applications of proxy system modeling in high resolution paleoclimatology. Quaternary Science Reviews, 76, 16-28, doi:10.1016/j.quascirev.2013.05.024.
- Fan, K., and H. Liu, 2013: Evaluation of Atmospheric Circulation in the Southern Hemisphere in 20CRv2. Atmospheric and Oceanic Science Letters, 6, 337-342, doi:10.3878/j.issn.1674-2834.13.0009.
- Feliks, Y., A. Groth, A. W. Robertson, and M. Ghil, 2013: Oscillatory Climate Modes in the Indian Monsoon, North Atlantic, and Tropical Pacific. J. Clim., 26, 9528-9544, doi:10.1175/JCLI-D-13-00105.1.
- Feng, S., and Q. Fu, 2013: Expansion of global drylands under a warming climate. Atmospheric Chemistry and Physics, 13, 10081-10094, doi:10.5194/acp-13-10081-2013.
- Franke, J., D. Frank, C. C. Raible, J. Esper, and S. Broennimann, 2013: Spectral biases in tree-ring climate proxies. Nature Climate Change, 3, 360-364, doi:10.1038/NCLIMATE1816.
- Frankignoul, C., G. Gastineau, and Y.-O. Kwon, 2013: The Influence of the AMOC Variability on the Atmosphere in CCSM3. J. Clim., 26, 9774-9790, doi:10.1175/JCLI-D-12-00862.1.
- Galbraith, P. S., and P. Larouche, 2013: Trends and variability in air and sea surface temperatures in eastern Canada. Canadian Technical Report of Fisheries and Aquatic Sciences, 3045, 1-18, doi:Gan, B., and L. Wu, 2013: Seasonal and Long-Term Coupling between Wintertime Storm Tracks and Sea Surface Temperature in the North Pacific. J. Clim., 26, 6123-6136, doi:10.1175/JCLI-D-12-00724.1.
- Garcia-Reyes, M., W. J. Sydeman, B. A. Black, R. R. Rykaczewski, D. S. Schoeman, S. A. Thompson, and S. J. Bograd, 2013: Relative influence of oceanic and terrestrial pressure systems in driving upwelling-favorable winds. Geophysical Research Letters, 40, 5311-5315, doi:10.1002/2013GL057729.
- Gastineau, G., F. D'Andrea, and C. Frankignoul, 2013: Atmospheric response to the North Atlantic Ocean variability on seasonal to decadal time scales. Climate Dynamics, 40, 2311-2330, doi:10.1007/s00382-012-1333-0.
- Gill, E. C., T. N. Chase, R. A. Pielke, Sr., and K. Wolter, 2013: Northern Hemisphere summer temperature and specific humidity anomalies from two reanalyses. Journal of Geophysical Research-Atmospheres, 118, 8297-8305, doi:10.1002/jgrd.50635.
- Gillett, N. P., and J. C. Fyfe, 2013: Annular mode changes in the CMIP5 simulations. Geophysical Research Letters, 40, 1189-1193, doi:10.1002/grl.50249.
- Gillett, N. P., J. C. Fyfe, and D. E. Parker, 2013: Attribution of observed sea level pressure trends to greenhouse gas, aerosol, and ozone changes. Geophysical Research Letters, 40, 2302-2306, doi:10.1002/grl.50500.
- Gillies, R. R., S.-Y. Wang, Y. Sun, and O.-Y. Chung, 2013: Supportive empirical modelling for the forecast of monsoon precipitation in Nepal. International Journal of Climatology, 33, 3047-3054, doi:10.1002/joc.3649.
- Givati, A., and D. Rosenfeld, 2013: The Arctic Oscillation, climate change and the effects on precipitation in Israel. Atmospheric Research, 132, 114-124, doi:10.1016/j.atmosres.2013.05.001.
- Grainger, S., C. S. Frederiksen, and X. Zheng, 2013: Modes of interannual variability of Southern Hemisphere atmospheric circulation in CMIP3 models: assessment and projections. Climate Dynamics, 41, 479-500, doi:10.1007/s00382-012-1659-7.
- Gregory, J. M., and Coauthors, 2013: Twentieth-Century Global-Mean Sea Level Rise: Is the Whole Greater than the Sum of the Parts? J. Clim., 26, 4476-4499, doi:10.1175/JCLI-D-12-00319.1.
- Gulev, S. K., M. Latif, N. Keenlyside, W. Park, and K. P. Koltermann, 2013: North Atlantic Ocean control on surface heat flux on multidecadal timescales. Nature, 499, 464-+, doi:10.1038/nature12268.
- Guo, F., Q. Liu, X.-T. Zheng, and S. Sun, 2013: The role of barrier layer in southeastern Arabian Sea during the development of positive Indian Ocean Dipole events. Journal of Ocean University of China, 12, 245-252, doi:10.1007/s11802-013-2170-4.
- Hanna, E., J. M. Jones, J. Cappelen, S. H. Mernild, L. Wood, K. Steffen, and P. Huybrechts, 2013: The influence of North Atlantic atmospheric and oceanic forcing effects on 1900-2010 Greenland summer climate and ice melt/runoff. International Journal of Climatology, 33, 862-880, doi:10.1002/joc.3475.
- Hastenrath, S., and D. Polzin, 2013: Climatic variations in Central America and the Caribbean. International Journal of Climatology, 33, 1348-1356, doi:10.1002/joc.3515.
- Hawkins, E., and P. D. Jones, 2013: On increasing global temperatures: 75 years after Callendar. Quarterly Journal of the Royal Meteorological Society, 139, 1961-1963, doi:10.1002/qj.2178.
- He, S., and H. Wang, 2013: Oscillating Relationship between the East Asian Winter Monsoon and ENSO. J. Clim., 26, 9819-9838, doi:10.1175/JCLI-D-13-00174.1.
- Hoy, A., M. Sepp, and J. Matschullat, 2013: Large-scale atmospheric circulation forms and their impact on air temperature in Europe and northern Asia. Theoretical and Applied Climatology, 113, 643-658, doi:10.1007/s00704-012-0813-9.
- Hoy, A., M. Sepp, and J. Matschullat, 2013: Atmospheric circulation variability in Europe and northern Asia (1901 to 2010). Theoretical and Applied Climatology, 113, 105-126, doi:10.1007/s00704-012-0770-3.
- Hu, Y., L. Tao, and J. Liu, 2013: Poleward expansion of the hadley circulation in CMIP5 simulations. Advances in Atmospheric Sciences, 30, 790-795, doi:10.1007/s00376-012-2187-4.
- Hwang, Y.-T., D. M. W. Frierson, and S. M. Kang, 2013: Anthropogenic sulfate aerosol and the southward shift of tropical precipitation in the late 20th century. Geophysical Research Letters, 40, 2845-2850, doi:10.1002/grl.50502.
- Jones, P. D., C. Harpham, and K. R. Briffa, 2013: Lamb weather types derived from reanalysis products. International Journal of Climatology, 33, 1129-1139, doi:10.1002/joc.3498.
- Jung, B.-J., H. M. Kim, T. Auligne, X. Zhang, X. Zhang, and X.-Y. Huang, 2013: Adjoint-Derived Observation Impact Using WRF in the Western North Pacific. Monthly Weather Review, 141, 4080-4097, doi:10.1175/MWR-D-12-00197.1.
- Jury, M. R., 2013: A return to wet conditions over Africa: 1995-2010. Theoretical and Applied Climatology, 111, 471-481, doi:10.1007/s00704-012-0677-z.
- Jury, M. R., 2013: Climate trends in southern Africa. South African Journal of Science, 109, 1-11, doi:Jury, M. R., 2013: Climate trends in southern Africa. South African Journal of Science, 109, 53-63, doi:10.1590/sajs.2013/980.
- Katsumata, K., and S. Masuda, 2013: Variability in Southern Hemisphere Ocean Circulation from the 1980s to the 2000s. J Phys Oceanogr, 43, 1981-2007, doi:10.1175/JPO-D-12-0209.1.
- Katsumata, K., B. M. Sloyan, and S. Masuda, 2013: Diapycnal and Isopycnal Transports in the Southern Ocean Estimated by a Box Inverse Model. J Phys Oceanogr, 43, 2270-2287, doi:10.1175/JPO-D-12-0210.1.
- Kent, E. C., S. Fangohr, and D. I. Berry, 2013: A comparative assessment of monthly mean wind speed products over the global ocean. International Journal of Climatology, 33, 2520-2541, doi:10.1002/joc.3606.
- Kent, E. C., N. A. Rayner, D. I. Berry, M. Saunby, B. I. Moat, J. J. Kennedy, and D. E. Parker, 2013: Global analysis of night marine air temperature and its uncertainty since 1880: The HadNMAT2 data set. Journal of Geophysical Research-Atmospheres, 118, 1281-1298, doi:10.1002/jgrd.50152.
- Kim, W., and W. Cai, 2013: Second peak in the far eastern Pacific sea surface temperature anomaly following strong El Nino events. Geophysical Research Letters, 40, 4751-4755, doi:10.1002/grl.50697.
- King, A. D., L. V. Alexander, and M. G. Donat, 2013: Asymmetry in the response of eastern Australia extreme rainfall to low-frequency Pacific variability. Geophysical Research Letters, 40, 2271-2277, doi:10.1002/grl.50427.
- Kirchner-Bossi, N., L. Prieto, R. Garcia-Herrera, L. Carro-Calvo, and S. Salcedo-Sanz, 2013: Multi-decadal variability in a centennial reconstruction of daily wind. Applied Energy, 105, 30-46, doi:10.1016/j.apenergy.2012.11.072.
- Klingaman, N. P., S. J. Woolnough, and J. Syktus, 2013: On the drivers of inter-annual and decadal rainfall variability in Queensland, Australia. International Journal of Climatology, 33, 2413-2430, doi:10.1002/joc.3593.
- Krueger, O., F. Schenk, F. Feser, and R. Weisse, 2013: Inconsistencies between Long-Term Trends in Storminess Derived from the 20CR Reanalysis and Observations. J. Clim., 26, 868-874, doi:10.1175/JCLI-D-12-00309.1. Kuentz, A., T. Mathevet, J. Gailhard, C. Perret, and V. Andreassian, 2013: Over 100 years of climatic and hydrologic variability of a Mediterranean and mountainous watershed: the Durance River. Cold and Mountain Region Hydrological Systems under Climate Change: Towards Improved Projections, 19-25.
- Lagler, K., M. Schindelegger, J. Boehm, H. Krasna, and T. Nilsson, 2013: GPT2: Empirical slant delay model for radio space geodetic techniques. Geophysical Research Letters, 40, 1069-1073, doi:10.1002/grl.50288.
- Lavers, D. A., R. P. Allan, G. Villarini, B. Lloyd-Hughes, D. J. Brayshaw, and A. J. Wade, 2013: Future changes in atmospheric rivers and their implications for winter flooding in Britain. Environmental Research Letters, 8, doi:10.1088/1748-9326/8/3/034010.
- Lee, M.-Y., and H.-H. Hsu, 2013: Identification of the Eurasian-North Pacific Multidecadal Oscillation and Its Relationship to the AMO. J. Clim., 26, 8139-8153, doi:10.1175/JCLI-D-13-00041.1.
- Li, Y., and L. R. Leung, 2013: Potential Impacts of the Arctic on Interannual and Interdecadal Summer Precipitation over China. J. Clim., 26, 899-917, doi:10.1175/JCLI-D-12-00075.1.
- Lin, X., C. Zhu, and J. Lu, 2013: Decadal change of the East Asian summer monsoon and its related surface temperature in Asia-Pacific during 1880-2004. Chinese Science Bulletin, 58, 4497-4503, doi:10.1007/s11434-013-5969-x.
- Liu, H., C. Wang, S.-K. Lee, and D. Enfield, 2013: Atlantic Warm Pool Variability in the CMIP5 Simulations. J. Clim., 26, 5315-5336, doi:10.1175/JCLI-D-12-00556.1.
- Lohmann, G., and B. R. Schoene, 2013: Climate signatures on decadal to interdecadal time scales as obtained from mollusk shells (Arctica islandica) from Iceland. Palaeogeography Palaeoclimatology Palaeoecology, 373, 152-162, doi:10.1016/j.palaeo.2012.08.006.
- Lopez-Cristoffanini, C., F. Tellier, R. Otaiza, J. A. Correa, and L. Contreras-Porcia, 2013: Tolerance to air exposure: a feature driving the latitudinal distribution of two sibling kelp species. Botanica Marina, 56, 431-440, doi:10.1515/bot-2013-0042.
- Lovejoy, S., D. Schertzer, and D. Varon, 2013: Do GCMs predict the climate ... or macroweather? Earth System Dynamics, 4, 439-454, doi:10.5194/esd-4-439-2013.
- Luebken, F. J., U. Berger, and G. Baumgarten, 2013: Temperature trends in the midlatitude summer mesosphere. Journal of Geophysical Research-Atmospheres, 118, 13347-13360, doi:10.1002/2013JD020576.
- Marcos, M., B. Puyol, F. M. Calafat, and G. Woppelmann, 2013: Sea level changes at Tenerife Island (NE Tropical Atlantic) since 1927. Journal of Geophysical Research-Oceans, 118, 4899-4910, doi:10.1002/jgrc.20377.
- Mayer, M., K. E. Trenberth, L. Haimberger, and J. T. Fasullo, 2013: The Response of Tropical Atmospheric Energy Budgets to ENSO. J. Clim., 26, 4710-4724, doi:10.1175/JCLI-D-12-00681.1.
- McGregor, S., N. Ramesh, P. Spence, M. H. England, M. J. McPhaden, and A. Santoso, 2013: Meridional movement of wind anomalies during ENSO events and their role in event termination. Geophysical Research Letters, 40, 749-754, doi:10.1002/grl.50136.
- Menary, M. B., and Coauthors, 2013: Mechanisms of aerosol-forced AMOC variability in a state of the art climate model. Journal of Geophysical Research-Oceans, 118, 2087-2096, doi:10.1002/jgrc.20178.
- Michaelis, A. C., and G. M. Lackmann, 2013: Numerical modeling of a historic storm: Simulating the Blizzard of 1888. Geophysical Research Letters, 40, 4092-4097, doi:10.1002/grl.50750.
- Misios, S., and H. Schmidt, 2013: The role of the oceans in shaping the tropospheric response to the 11 year solar cycle. Geophysical Research Letters, 40, 6373-6377, doi:10.1002/2013GL058439.
- Misra, V., S. M. DiNapoli, and S. Bastola, 2013: Dynamic downscaling of the twentieth-century reanalysis over the southeastern United States. Regional Environmental Change, 13, S15-S23, doi:10.1007/s10113-012-0372-8.
- Mitchell, L., and G. A. Gottwald, 2013: Controlling model error of underdamped forecast models in sparse observational networks using a variance-limiting Kalman filter. Quarterly Journal of the Royal Meteorological Society, 139, 212-225, doi:10.1002/qj.1968.
- Monier, E., J. R. Scott, A. P. Sokolov, C. E. Forest, and C. A. Schlosser, 2013: An integrated assessment modeling framework for uncertainty studies in global and regional climate change: the MIT IGSM-CAM (version 1.0). Geoscientific Model Development, 6, 2063-2085, doi:10.5194/gmd-6-2063-2013.
- Monier, E., A. Sokolov, A. Schlosser, J. Scott, and X. Gao, 2013: Probabilistic projections of 21st century climate change over Northern Eurasia. Environmental Research Letters, 8, doi:10.1088/1748-9326/8/4/045008.
- Moore, G. W. K., 2013: Tibetan ice core evidence for an intensification of the East Asian jet stream since the 1870s. Atmospheric Science Letters, 14, 235-242, doi:10.1002/asl2.445.
- Moore, G. W. K., I. A. Renfrew, and R. S. Pickart, 2013: Multidecadal Mobility of the North Atlantic Oscillation. J. Clim., 26, 2453-2466, doi:10.1175/JCLI-D-12-00023.1.
- Nadiga, B. T., W. R. Casper, and P. W. Jones, 2013: Ensemble-based global ocean data assimilation. Ocean Modelling, 72, 210-230, doi:10.1016/j.ocemod.2013.09.002.
- Nakamura, J., U. Lall, Y. Kushnir, A. W. Robertson, and R. Seager, 2013: Dynamical Structure of Extreme Floods in the US Midwest and the United Kingdom. Journal of Hydrometeorology, 14, 485-504, doi:10.1175/JHM-D-12-059.1.
- Newman, M., 2013: ATMOSPHERIC SCIENCE Winds of change. Nature Climate Change, 3, 538-539, doi:10.1038/nclimate1915.
- Nguyen, H., A. Evans, C. Lucas, I. Smith, and B. Timbal, 2013: The Hadley Circulation in Reanalyses: Climatology, Variability, and Change. J. Clim., 26, 3357-3376, doi:10.1175/JCLI-D-12-00224.1.
- Nidheesh, A. G., M. Lengaigne, J. Vialard, A. S. Unnikrishnan, and H. Dayan, 2013: Decadal and long-term sea level variability in the tropical Indo-Pacific Ocean. Climate Dynamics, 41, 381-402, doi:10.1007/s00382-012-1463-4.
- Nyadjro, E. S., B. Subrahmanyam, and B. S. Giese, 2013: Variability of salt flux in the Indian Ocean during 1960-2008. Remote Sens Environ, 134, 175-193, doi:10.1016/j.rse.2013.03.005.
- Paek, H., and H.-P. Huang, 2013: Centennial Trend and Decadal-to-Interdecadal Variability of Atmospheric Angular Momentum in CMIP3 and CMIP5 Simulations. J. Clim., 26, 3846-3864, doi:10.1175/JCLI-D-12-00515.1.
- Peings, Y., E. Brun, V. Mauvais, and H. Douville, 2013: How stationary is the relationship between Siberian snow and Arctic Oscillation over the 20th century? Geophysical Research Letters, 40, 183-188, doi:10.1029/2012GL054083.
- Pena-Ortiz, C., D. Gallego, P. Ribera, P. Ordonez, and M. Del Carmen Alvarez-Castro, 2013: Observed trends in the global jet stream characteristics during the second half of the 20th century. Journal of Geophysical Research-Atmospheres, 118, 2702-2713, doi:10.1002/jgrd.50305.
- Pfeiffer, M., A. Spessa, and J. O. Kaplan, 2013: A model for global biomass burning in preindustrial time: LPJ-LMfire (v1.0). Geoscientific Model Development, 6, 643-685, doi:10.5194/gmd-6-643-2013. Pielke, R. A., 2013: Mesoscale Meteorological Modeling, 3rd Edition. Mesoscale Meteorological Modeling, 3rd Edition, 1-726.
- Pisoft, P., and Coauthors, 2013: Manifestation of reanalyzed QBO and SSC signals. Theoretical and Applied Climatology, 112, 637-646, doi:10.1007/s00704-012-0752-5.
- Price, D. T., and Coauthors, 2013: Anticipating the consequences of climate change for Canada's boreal forest ecosystems. Environmental Reviews, 21, 322-365, doi:10.1139/er-2013-0042.
- Prive, N. C., and R. M. Errico, 2013: The role of model and initial condition error in numerical weather forecasting investigated with an observing system simulation experiment. Tellus Series a-Dynamic Meteorology and Oceanography, 65, doi:10.3402/tellusa.v65i0.21740.
- Przybylak, R., P. Wyszynski, Z. Vizi, and J. Jankowska, 2013: Atmospheric pressure changes in the Arctic from 1801 to 1920. International Journal of Climatology, 33, 1730-1760, doi:10.1002/joc.3546.
- Purich, A., T. Cowan, S.-K. Min, and W. Cai, 2013: Autumn Precipitation Trends over Southern Hemisphere Midlatitudes as Simulated by CMIP5 Models. J. Clim., 26, 8341-8356, doi:10.1175/JCLI-D-13-00007.1. Rao, M. V. S. R., J. Sanjay, and R. Krishnan, 2013: Observed variations in the Indian monsoon hydroclimate during recent decades. Climate and Land Surface Changes in Hydrology, 253-259.
- Richard, Y., and Coauthors, 2013: Temperature changes in the mid- and high- latitudes of the Southern Hemisphere. International Journal of Climatology, 33, 1948-1963, doi:10.1002/joc.3563.
- Rotstayn, L. D., M. A. Collier, A. Chrastansky, S. J. Jeffrey, and J. J. Luo, 2013: Projected effects of declining aerosols in RCP4.5: unmasking global warming? Atmospheric Chemistry and Physics, 13, 10883-10905, doi:10.5194/acp-13-10883-2013.
- Santos, J. A., T. Woollings, and J. G. Pinto, 2013: Are the Winters 2010 and 2012 Archetypes Exhibiting Extreme Opposite Behavior of the North Atlantic Jet Stream? Monthly Weather Review, 141, 3626-3640, doi:10.1175/MWR-D-13-00024.1.
- Sheffield, J., and Coauthors, 2013: North American Climate in CMIP5 Experiments. Part I: Evaluation of Historical Simulations of Continental and Regional Climatology. J. Clim., 26, 9209-9245, doi:10.1175/JCLI-D-12-00592.1.
- Sheffield, J., and Coauthors, 2013: North American Climate in CMIP5 Experiments. Part II: Evaluation of Historical Simulations of Intraseasonal to Decadal Variability. J. Clim., 26, 9247-9290, doi:10.1175/JCLI-D-12-00593.1.
- Soon, W., and D. R. Legates, 2013: Solar irradiance modulation of Equator-to-Pole (Arctic) temperature gradients: Empirical evidence for climate variation on multi-decadal timescales. Journal of Atmospheric and Solar-Terrestrial Physics, 93, 45-56, doi:10.1016/j.jastp.2012.11.015.
- Stagge, J. H., and G. E. Moglen, 2013: A nonparametric stochastic method for generating daily climate-adjusted streamflows. Water Resources Research, 49, 6179-6193, doi:10.1002/wrcr.20448.
- Stahle, D. K., D. J. Burnette, and D. W. Stahle, 2013: A Moisture Balance Reconstruction for the Drainage Basin of Albemarle Sound, North Carolina. Estuaries and Coasts, 36, 1340-1353, doi:10.1007/s12237-013-9643-y.
- Sun, C., J. Li, F.-F. Jin, and R. Ding, 2013: Sea surface temperature inter-hemispheric dipole and its relation to tropical precipitation. Environmental Research Letters, 8, doi:10.1088/1748-9326/8/4/044006.
- Thomas, E. R., T. J. Bracegirdle, J. Turner, and E. W. Wolff, 2013: A 308 year record of climate variability in West Antarctica. Geophysical Research Letters, 40, 5492-5496, doi:10.1002/2013GL057782.
- Toreti, A., M. Schneuwly-Bollschweiler, M. Stoffel, and J. Luterbacher, 2013: Atmospheric Forcing of Debris Flows in the Southern Swiss Alps. Journal of Applied Meteorology and Climatology, 52, 1554-1560, doi:10.1175/JAMC-D-13-077.1.
- Trouet, V., and G. J. Van Oldenborgh, 2013: Knmi Climate Explorer: A Web-Based Research Tool for High-Resolution Paleoclimatology. Tree-Ring Research, 69, 3-13, doi:10.3959/1536-1098-69.1.3.
- Truchelut, R. E., R. E. Hart, and B. Luthman, 2013: Global Identification of Previously Undetected Pre-Satellite-Era Tropical Cyclone Candidates in NOAA/CIRES Twentieth-Century Reanalysis Data. Journal of Applied Meteorology and Climatology, 52, 2243-2259, doi:10.1175/JAMC-D-12-0276.1.
- van der Schrier, G., E. J. M. van den Besselaar, A. M. G. K. Tank, and G. Verver, 2013: Monitoring European average temperature based on the E-OBS gridded data set. Journal of Geophysical Research-Atmospheres, 118, 5120-5135, doi:10.1002/jgrd.50444.
- van Haren, R., G. J. van Oldenborgh, G. Lenderink, and W. Hazeleger, 2013: Evaluation of modeled changes in extreme precipitation in Europe and the Rhine basin. Environmental Research Letters, 8, doi:10.1088/1748-9326/8/1/014053.
- van Oldenborgh, G. J., A. T. J. de Laat, J. Luterbacher, W. J. Ingram, and T. J. Osborn, 2013: Claim of solar influence is on thin ice: are 11-year cycle solar minima associated with severe winters in Europe? Environmental Research Letters, 8, doi:10.1088/1748-9326/8/2/024014.
- Varikoden, H., and B. Preethi, 2013: Wet and dry years of Indian summer monsoon and its relation with Indo-Pacific sea surface temperatures. International Journal of Climatology, 33, 1761-1771, doi:10.1002/joc.3547.
- Vavrus, S. J., 2013: Extreme Arctic cyclones in CMIP5 historical simulations. Geophysical Research Letters, 40, 6208-6212, doi:10.1002/2013GL058161.
- Wahl, T., I. D. Haigh, S. Dangendorf, and J. Jensen, 2013: Inter-annual and long-term mean sea level changes along the North Sea coastline. Journal of Coastal Research, 1987-1992, doi:10.2112/SI65-336.1.
- Wahl, T., and Coauthors, 2013: Observed mean sea level changes around the North Sea coastline from 1800 to present. Earth-Science Reviews, 124, 51-67, doi:10.1016/j.earscirev.2013.05.003.
- Wang, B., J. Liu, H.-J. Kim, P. J. Webster, S.-Y. Yim, and B. Xiang, 2013: Northern Hemisphere summer monsoon intensified by mega-El Nino/southern oscillation and Atlantic multidecadal oscillation. Proceedings of the National Academy of Sciences of the United States of America, 110, 5347-5352, doi:10.1073/pnas.1219405110.
- Wang, C., and X. Wang, 2013: Classifying El Nino Modoki I and II by Different Impacts on Rainfall in Southern China and Typhoon Tracks. J. Clim., 26, 1322-1338, doi:10.1175/JCLI-D-12-00107.1.
- Wang, C., and L. Zhang, 2013: Multidecadal Ocean Temperature and Salinity Variability in the Tropical North Atlantic: Linking with the AMO, AMOC, and Subtropical Cell. J. Clim., 26, 6137-6162, doi:10.1175/JCLI-D-12-00721.1.
- Wang, C., L. Zhang, and S.-K. Lee, 2013: Response of Freshwater Flux and Sea Surface Salinity to Variability of the Atlantic Warm Pool. J. Clim., 26, 1249-1267, doi:10.1175/JCLI-D-12-00284.1.
- Wang, G., and W. Cai, 2013: Climate-change impact on the 20th-century relationship between the Southern Annular Mode and global mean temperature. Scientific Reports, 3, doi:10.1038/srep02039.
- Wang, J., Z. Yan, P. D. Jones, and J. Xia, 2013: On "observation minus reanalysis" method: A view from multidecadal variability. Journal of Geophysical Research-Atmospheres, 118, 7450-7458, doi:10.1002/jgrd.50574.
- Wang, R., and L. Wu, 2013: Climate Changes of Atlantic Tropical Cyclone Formation Derived from Twentieth-Century Reanalysis. J. Clim., 26, 8995-9005, doi:10.1175/JCLI-D-13-00056.1.
- Wang, S., M. Xue, and J. Min, 2013: A four-dimensional asynchronous ensemble square-root filter (4DEnSRF) algorithm and tests with simulated radar data. Quarterly Journal of the Royal Meteorological Society, 139, 805-819, doi:10.1002/qj.1987.
- Wang, S.-Y., and R. R. Gillies, 2013: Influence of the Pacific quasi-decadal oscillation on the monsoon precipitation in Nepal. Climate Dynamics, 40, 95-107, doi:10.1007/s00382-012-1376-2.
- Wang, S.-Y., M. L'Heureux, and J.-H. Yoon, 2013: Are Greenhouse Gases Changing ENSO Precursors in the Western North Pacific? J. Clim., 26, 6309-6322, doi:10.1175/JCLI-D-12-00360.1.
- Wang, X. L., Y. Feng, G. P. Compo, V. R. Swail, F. W. Zwiers, R. J. Allan, and P. D. Sardeshmukh, 2013: Trends and low frequency variability of extra-tropical cyclone activity in the ensemble of twentieth century reanalysis. Climate Dynamics, 40, 2775-2800, doi:10.1007/s00382-012-1450-9.
- Wartenburger, R., S. Broennimann, and A. Stickler, 2013: Observation errors in early historical upper-air observations. Journal of Geophysical Research-Atmospheres, 118, 12012-12028, doi:10.1002/2013JD020156.
- Willett, K. M., and Coauthors, 2013: HadISDH: an updateable land surface specific humidity product for climate monitoring. Climate of the Past, 9, 657-677, doi:10.5194/cp-9-657-2013.
- Xia, J., Z. Yan, and P. Wu, 2013: Multidecadal variability in local growing season during 1901-2009. Climate Dynamics, 41, 295-305, doi:10.1007/s00382-012-1438-5.
- Xu, J., and A. M. Powell, Jr., 2013: What happened to surface temperature with sunspot activity in the past 130 years? Theoretical and Applied Climatology, 111, 609-622, doi:10.1007/s00704-012-0694-y.
- Yan, Q., Z. Zhang, Y. Gao, H. Wang, and O. M. Johannessen, 2013: Sensitivity of the modeled present-day Greenland Ice Sheet to climatic forcing and spin-up methods and its influence on future sea level projections. Journal of Geophysical Research-Earth Surface, 118, 2174-2189, doi:10.1002/jgrf.20156.
- Yang, C., and B. S. Giese, 2013: El Nino Southern Oscillation in an ensemble ocean reanalysis and coupled climate models. Journal of Geophysical Research-Oceans, 118, 4052-4071, doi:10.1002/jgrc.20284.
- Yang, X., and Coauthors, 2013: A Predictable AMO-Like Pattern in the GFDL Fully Coupled Ensemble Initialization and Decadal Forecasting System. J. Clim., 26, 650-661, doi:10.1175/JCLI-D-12-00231.1.
- Yiou, P., T. Salameh, P. Drobinski, L. Menut, R. Vautard, and M. Vrac, 2013: Ensemble reconstruction of the atmospheric column from surface pressure using analogues. Climate Dynamics, 41, 1333-1344, doi:10.1007/s00382-012-1626-3.
- Yoshimura, K., and M. Kanamitsu, 2013: Incremental Correction for the Dynamical Downscaling of Ensemble Mean Atmospheric Fields. Monthly Weather Review, 141, 3087-3101, doi:10.1175/MWR-D-12-00271.1.
- Zampieri, M., E. Scoccimarro, and S. Gualdi, 2013: Atlantic influence on spring snowfall over the Alps in the past 150 years. Environmental Research Letters, 8, doi:10.1088/1748-9326/8/3/034026.
- Zhai, F., D. Hu, and T. Qu, 2013: Decadal variations of the North Equatorial Current in the Pacific at 137 degrees E. Journal of Geophysical Research-Oceans, 118, 4989-5006, doi:10.1002/jgrc.20391.
- Zhai, X., and C. Wunsch, 2013: On the Variability of Wind Power Input to the Oceans with a Focus on the Subpolar North Atlantic. J. Clim., 26, 3892-3903, doi:10.1175/JCLI-D-12-00472.1.
- Zhang, G., and Z. Wang, 2013: Interannual Variability of the Atlantic Hadley Circulation in Boreal Summer and Its Impacts on Tropical Cyclone Activity. J. Clim., 26, 8529-8544, doi:10.1175/JCLI-D-12-00802.1.
- Zhang, L., L. Wu, and B. Gan, 2013: Modes and Mechanisms of Global Water Vapor Variability over the Twentieth Century. J. Clim., 26, 5578-5593, doi:10.1175/JCLI-D-12-00585.1.
- Zhang, L., and T. Zhou, 2013: A comparison of tropospheric temperature changes over China revealed by multiple data sets. Journal of Geophysical Research-Atmospheres, 118, 4217-4230, doi:10.1002/jgrd.50370.
- Zhang, Q., H. Kornich, and K. Holmgren, 2013: How well do reanalyses represent the southern African precipitation? Climate Dynamics, 40, 951-962, doi:10.1007/s00382-012-1423-z.
- Zhang, Z., W. Guo, D. Gong, and S.-J. Kim, 2013: Evaluation of the twentieth century reanalysis dataset in describing East Asian winter monsoon variability. Advances in Atmospheric Sciences, 30, 1645-1652, doi:10.1007/s00376-012-2226-1.
- Zheng, F., J. Li, R. T. Clark, and H. C. Nnamchi, 2013: Simulation and Projection of the Southern Hemisphere Annular Mode in CMIP5 Models. J. Clim., 26, 9860-9879, doi:10.1175/JCLI-D-13-00204.1.
2012
- Abarca-del-Rio, R., D. Gambis, and D. Salstein, 2012: Interdecadal oscillations in Atmospheric Angular Momentum variations. Journal of Geodetic Science, 2, 42-52, doi:10.2478/v10156-011-0025-8.
- Achberger, C., and Coauthors, 2012: STATE OF THE CLIMATE IN 2011 Special Supplement to the Bulletin of the American Meteorological Society Vol. 93, No. 7, July 2012. Bulletin of the American Meteorological Society, 93, S1-S263, doi:10.1175/2012BAMSStateoftheClimate.1.
- Backman, J., and Coauthors, 2012: On the diurnal cycle of urban aerosols, black carbon and the occurrence of new particle formation events in springtime Sao Paulo, Brazil. Atmospheric Chemistry and Physics, 12, 11733-11751, doi:10.5194/acp-12-11733-2012.
- Baker, A., and Coauthors, 2012: Millennial-length forward models and pseudoproxies of stalagmite delta O-18: an example from NW Scotland. Climate of the Past, 8, 1153-1167, doi:10.5194/cp-8-1153-2012.
- Bhend, J., J. Franke, D. Folini, M. Wild, and S. Broennimann, 2012: An ensemble-based approach to climate reconstructions. Climate of the Past, 8, 963-976, doi:10.5194/cp-8-963-2012.
- Broennimann, S., and G. P. Compo, 2012: Ozone highs and associated flow features in the first half of the twentieth century in different data sets. Meteorologische Zeitschrift, 21, 49-59, doi:10.1127/0941-2948/2012/0284.
- Broennimann, S., and Coauthors, 2012: A multi-data set comparison of the vertical structure of temperature variability and change over the Arctic during the past 100 years. Climate Dynamics, 39, 1577-1598, doi:10.1007/s00382-012-1291-6.
- Broennimann, S., and J. Luterbacher, 2012: Weather and climate extremes during the past 100 years. Meteorologische Zeitschrift, 21, 9-11, doi:10.1127/0941-2948/2012/0525.
- Broennimann, S., and Coauthors, 2012: Extreme winds at northern mid-latitudes since 1871. Meteorologische Zeitschrift, 21, 13-27, doi:10.1127/0941-2948/2012/0337.
- Cai, W., T. Cowan, and M. Thatcher, 2012: Rainfall reductions over Southern Hemisphere semi-arid regions: the role of subtropical dry zone expansion. Scientific Reports, 2, doi:10.1038/srep00702.
- Calafat, F. M., D. P. Chambers, and M. N. Tsimplis, 2012: Mechanisms of decadal sea level variability in the eastern North Atlantic and the Mediterranean Sea. Journal of Geophysical Research-Oceans, 117, doi:10.1029/2012JC008285.
- Cao, J., J. Hu, and Y. Tao, 2012: An index for the interface between the Indian summer monsoon and the East Asian summer monsoon. Journal of Geophysical Research-Atmospheres, 117, doi:10.1029/2012JD017841.
- Carton, J. A., H. F. Seidel, and B. S. Giese, 2012: Detecting historical ocean climate variability. Journal of Geophysical Research-Oceans, 117, doi:10.1029/2011JC007401.
- Chen, Z., and L. Wu, 2012: Long-term change of the Pacific North Equatorial Current bifurcation in SODA. Journal of Geophysical Research-Oceans, 117, doi:10.1029/2011JC007814.
- Chernokulsky, A., and I. I. Mokhov, 2012: Climatology of Total Cloudiness in the Arctic: An Intercomparison of Observations and Reanalyses. Advances in Meteorology, doi:10.1155/2012/542093.
- Chowdary, J. S., S.-P. Xie, H. Tokinaga, Y. M. Okumura, H. Kubota, N. Johnson, and X.-T. Zheng, 2012: Interdecadal Variations in ENSO Teleconnection to the Indo-Western Pacific for 1870-2007. J. Clim., 25, 1722-1744, doi:10.1175/JCLI-D-11-00070.1.
- Colgan, W., W. T. Pfeffer, H. Rajaram, W. Abdalati, and J. Balog, 2012: Monte Carlo ice flow modeling projects a new stable configuration for Columbia Glacier, Alaska, c. 2020. Cryosphere, 6, 1395-1409, doi:10.5194/tc-6-1395-2012.
- Dawson, A., T. N. Palmer, and S. Corti, 2012: Simulating regime structures in weather and climate prediction models. Geophysical Research Letters, 39, doi:10.1029/2012GL053284.
- Diaz, H. F., and T. W. Giambelluca, 2012: Changes in atmospheric circulation patterns associated with high and low rainfall regimes in the Hawaiian Islands region on multiple time scales. Global and Planetary Change, 98-99, 97-108, doi:10.1016/j.gloplacha.2012.08.011.
- DiNapoli, S. M., and V. Misra, 2012: Reconstructing the 20th century high-resolution climate of the southeastern United States. Journal of Geophysical Research-Atmospheres, 117, doi:10.1029/2012JD018303.
- Driscoll, S., A. Bozzo, L. J. Gray, A. Robock, and G. Stenchikov, 2012: Coupled Model Intercomparison Project 5 (CMIP5) simulations of climate following volcanic eruptions. Journal of Geophysical Research-Atmospheres, 117, doi:10.1029/2012JD017607.
- Ferguson, C. R., and G. Villarini, 2012: Detecting inhomogeneities in the Twentieth Century Reanalysis over the central United States. Journal of Geophysical Research-Atmospheres, 117, doi:10.1029/2011JD016988.
- Ferguson, C. R., E. F. Wood, and R. K. Vinukollu, 2012: A Global Intercomparison of Modeled and Observed Land-Atmosphere Coupling. Journal of Hydrometeorology, 13, 749-784, doi:10.1175/JHM-D-11-0119.1.
- Fyfe, J. C., N. P. Gillett, and G. J. Marshall, 2012: Human influence on extratropical Southern Hemisphere summer precipitation. Geophysical Research Letters, 39, doi:10.1029/2012GL054199.
- Galbraith, P. S., P. Larouche, J. Chasse, and B. Petrie, 2012: Sea-surface temperature in relation to air temperature in the Gulf of St. Lawrence: Interdecadal variability and long term trends. Deep-Sea Research Part Ii-Topical Studies in Oceanography, 77-80, 10-20, doi:10.1016/j.dsr2.2012.04.001.
- Gan, B., and L. Wu, 2012: Modulation of Atmospheric Response to North Pacific SST Anomalies under Global Warming: A Statistical Assessment. J. Clim., 25, 6554-6566, doi:10.1175/JCLI-D-11-00493.1.
- Girardin, M. P., X. J. Guo, P. Y. Bernier, F. Raulier, and S. Gauthier, 2012: Changes in growth of pristine boreal North American forests from 1950 to 2005 driven by landscape demographics and species traits. Biogeosciences, 9, 2523-2536, doi:10.5194/bg-9-2523-2012.
- Gordov, E. p., and Coauthors, 2012: Geo-information system for investigation of regional climatic changes and first results obtained. Optika atmosfery i okeana, 25, 137-143, doi:Grodsky, S. A., J. A. Carton, S. Nigam, and Y. M. Okumura, 2012: Tropical Atlantic Biases in CCSM4. J. Clim., 25, 3684-3701, doi:10.1175/JCLI-D-11-00315.1.
- Haimberger, L., C. Tavolato, and S. Sperka, 2012: Homogenization of the Global Radiosonde Temperature Dataset through Combined Comparison with Reanalysis Background Series and Neighboring Stations. J. Clim., 25, 8108-8131, doi:10.1175/JCLI-D-11-00668.1.
- Hanna, E., S. H. Mernild, J. Cappelen, and K. Steffen, 2012: Recent warming in Greenland in a long-term instrumental (1881-2012) climatic context: I. Evaluation of surface air temperature records. Environmental Research Letters, 7, doi:10.1088/1748-9326/7/4/045404.
- Harvey, B. J., L. C. Shaffrey, T. J. Woollings, G. Zappa, and K. I. Hodges, 2012: How large are projected 21st century storm track changes? Geophysical Research Letters, 39, doi:10.1029/2012GL052873.
- Hoerling, M., J. Eischeid, J. Perlwitz, X. Quan, T. Zhang, and P. Pegion, 2012: On the Increased Frequency of Mediterranean Drought. J. Clim., 25, 2146-2161, doi:10.1175/JCLI-D-11-00296.1.
- Ionita, M., G. Lohmann, N. Rimbu, and S. Chelcea, 2012: Interannual Variability of Rhine River Streamflow and Its Relationship with Large-Scale Anomaly Patterns in Spring and Autumn. Journal of Hydrometeorology, 13, 172-188, doi:10.1175/JHM-D-11-063.1.
- Ionita, M., G. Lohmann, N. Rimbu, S. Chelcea, and M. Dima, 2012: Interannual to decadal summer drought variability over Europe and its relationship to global sea surface temperature. Climate Dynamics, 38, 363-377, doi:10.1007/s00382-011-1028-y.
- Ionita, M., G. Lohmann, N. Rimbu, and P. Scholz, 2012: Dominant modes of Diurnal Temperature Range variability over Europe and their relationships with large-scale atmospheric circulation and sea surface temperature anomaly patterns. Journal of Geophysical Research-Atmospheres, 117, doi:10.1029/2011JD016669.
- Keller, K. M., and Coauthors, 2012: Variability of the ocean carbon cycle in response to the North Atlantic Oscillation. Tellus Series B-Chemical and Physical Meteorology, 64, doi:10.3402/tellusb.v64i0.18738.
- Kunkel, K. E., D. R. Easterling, D. A. R. Kristvich, B. Gleason, L. Stoecker, and R. Smith, 2012: Meteorological Causes of the Secular Variations in Observed Extreme Precipitation Events for the Conterminous United States. Journal of Hydrometeorology, 13, 1131-1141, doi:10.1175/JHM-D-11-0108.1.
- Lavers, D. A., G. Villarini, R. P. Allan, E. F. Wood, and A. J. Wade, 2012: The detection of atmospheric rivers in atmospheric reanalyses and their links to British winter floods and the large-scale climatic circulation. Journal of Geophysical Research-Atmospheres, 117, doi:10.1029/2012JD018027.
- Lehner, F., C. C. Raible, D. Hofer, and T. F. Stocker, 2012: The freshwater balance of polar regions in transient simulations from 1500 to 2100 AD using a comprehensive coupled climate model. Climate Dynamics, 39, 347-363, doi:10.1007/s00382-011-1199-6.
- Lehner, F., C. C. Raible, and T. F. Stocker, 2012: Testing the robustness of a precipitation proxy-based North Atlantic Oscillation reconstruction. Quaternary Science Reviews, 45, 85-94, doi:10.1016/j.quascirev.2012.04.025.
- Liu, C., and L. Wu, 2012: An intensification trend of South Pacific Mode Water subduction rates over the 20th century. Journal of Geophysical Research-Oceans, 117, doi:10.1029/2011JC007755.
- Liu, H., C. Wang, S.-K. Lee, and D. Enfield, 2012: Atlantic Warm-Pool Variability in the IPCC AR4 CGCM Simulations. J. Clim., 25, 5612-5628, doi:10.1175/JCLI-D-11-00376.1.
- Liu, J., M. Song, Y. Hu, and X. Ren, 2012: Changes in the strength and width of the Hadley Circulation since 1871. Climate of the Past, 8, 1169-1175, doi:10.5194/cp-8-1169-2012.
- Lohmann, G., and K. H. Wiltshire, 2012: Winter atmospheric circulation signature for the timing of the spring bloom of diatoms in the North Sea. Marine Biology, 159, 2573-2581, doi:10.1007/s00227-012-1993-7.
- Lorrey, A., G. Dalu, J. Renwick, H. Diamond, and M. Gaetani, 2012: Reconstructing the South Pacific Convergence Zone Position during the Presatellite Era: A La Nina Case Study. Monthly Weather Review, 140, 3653-3668, doi:10.1175/MWR-D-11-00228.1.
- Lovejoy, S., J. Pinel, and D. Schertzer, 2012: The global space-time cascade structure of precipitation: Satellites, gridded gauges and reanalyses. Advances in Water Resources, 45, 37-50, doi:10.1016/j.advwatres.2012.03.024. Lovejoy, S., and D. Schertzer, 2012: Low-Frequency Weather and the Emergence of the Climate. Extreme Events and Natural Hazards: The Complexity Perspective, 231-254.
- Ma, Y., and R. T. Pinker, 2012: Modeling shortwave radiative fluxes from satellites. Journal of Geophysical Research-Atmospheres, 117, doi:10.1029/2012JD018332.
- Moncrieff, M. W., D. E. Waliser, M. J. Miller, M. A. Shapiro, G. R. Asrar, and J. Caughey, 2012: Multiscale Convective Organization and the Yotc Virtual Global Field Campaign. Bulletin of the American Meteorological Society, 93, 1171-1187, doi:10.1175/BAMS-D-11-00233.1.
- Moore, G. W. K., 2012: Surface pressure record of Tibetan Plateau warming since the 1870s. Quarterly Journal of the Royal Meteorological Society, 138, 1999-2008, doi:10.1002/qj.1948.
- Mueller, W. A., and Coauthors, 2012: Forecast skill of multi-year seasonal means in the decadal prediction system of the Max Planck Institute for Meteorology. Geophysical Research Letters, 39, doi:10.1029/2012GL053326.
- Neukom, R., and J. Gergis, 2012: Southern Hemisphere high-resolution palaeoclimate records of the last 2000 years. Holocene, 22, 501-524, doi:10.1177/0959683611427335.
- Nicholson, S. E., D. Klotter, and A. K. Dezfuli, 2012: Spatial reconstruction of semi-quantitative precipitation fields over Africa during the nineteenth century from documentary evidence and gauge data. Quaternary Research, 78, 13-23, doi:10.1016/j.yqres.2012.03.012.
- Oliver, E. C. J., and K. R. Thompson, 2012: A Reconstruction of Madden-Julian Oscillation Variability from 1905 to 2008. J. Clim., 25, 1996-2019, doi:10.1175/JCLI-D-11-00154.1.
- Paek, H., and H.-P. Huang, 2012: A comparison of the interannual variability in atmospheric angular momentum and length-of-day using multiple reanalysis data sets. Journal of Geophysical Research-Atmospheres, 117, doi:10.1029/2012JD018105.
- Paek, H., and H.-P. Huang, 2012: A Comparison of Decadal-to-Interdecadal Variability and Trend in Reanalysis Datasets Using Atmospheric Angular Momentum. J. Clim., 25, 4750-4758, doi:10.1175/JCLI-D-11-00358.1. Pielke, R. A., Sr., and Coauthors, 2012: Dealing With Complexity and Extreme Events Using a Bottom-Up, Resource-Based Vulnerability Perspective. Extreme Events and Natural Hazards: The Complexity Perspective, 345-359.
- Pohl, B., and N. Fauchereau, 2012: The Southern Annular Mode Seen through Weather Regimes. J. Clim., 25, 3336-3354, doi:10.1175/JCLI-D-11-00160.1.
- Ray, S., and B. S. Giese, 2012: Historical changes in El Nino and La Nina characteristics in an ocean reanalysis. Journal of Geophysical Research-Oceans, 117, doi:10.1029/2012JC008031.
- Sakov, P., F. Counillon, L. Bertino, K. A. Lisaeter, P. R. Oke, and A. Korablev, 2012: TOPAZ4: an ocean-sea ice data assimilation system for the North Atlantic and Arctic. Ocean Science, 8, 633-656, doi:10.5194/os-8-633-2012.
- Seager, R., and N. Naik, 2012: A Mechanisms-Based Approach to Detecting Recent Anthropogenic Hydroclimate Change. J. Clim., 25, 236-261, doi:10.1175/JCLI-D-11-00056.1.
- Seager, R., N. Pederson, Y. Kushnir, J. Nakamura, and S. Jurburg, 2012: The 1960s Drought and the Subsequent Shift to a Wetter Climate in the Catskill Mountains Region of the New York City Watershed. J. Clim., 25, 6721-6742, doi:10.1175/JCLI-D-11-00518.1.
- Shen, S. S. P., C. K. Lee, and J. Lawrimore, 2012: Uncertainties, Trends, and Hottest and Coldest Years of US Surface Air Temperature since 1895: An Update Based on the USHCN V2 TOB Data. J. Clim., 25, 4185-4203, doi:10.1175/JCLI-D-11-00102.1.
- Sirocko, F., H. Brunck, and S. Pfahl, 2012: Solar influence on winter severity in central Europe. Geophysical Research Letters, 39, doi:10.1029/2012GL052412.
- Soares, P. M. M., R. M. Cardoso, P. M. A. Miranda, J. de Medeiros, M. Belo-Pereira, and F. Espirito-Santo, 2012: WRF high resolution dynamical downscaling of ERA-Interim for Portugal. Climate Dynamics, 39, 2497-2522, doi:10.1007/s00382-012-1315-2.
- Solomon, A., and M. Newman, 2012: Reconciling disparate twentieth-century Indo-Pacific ocean temperature trends in the instrumental record. Nature Climate Change, 2, 691-699, doi:10.1038/NCLIMATE1591.
- Stucki, P., R. Rickli, S. Broennimann, O. Martius, H. Wanner, D. Grebner, and J. Luterbacher, 2012: Weather patterns and hydro-climatological precursors of extreme floods in Switzerland since 1868. Meteorologische Zeitschrift, 21, 531-550, doi:10.1127/0941-2948/2012/368.
- Swart, N. C., and J. C. Fyfe, 2012: Observed and simulated changes in the Southern Hemisphere surface westerly wind-stress. Geophysical Research Letters, 39, doi:10.1029/2012GL052810.
- Swart, N. C., and J. C. Fyfe, 2012: Ocean carbon uptake and storage influenced by wind bias in global climate models. Nature Climate Change, 2, 47-52, doi:10.1038/NCLIMATE1289.
- Tokinaga, H., S.-P. Xie, C. Deser, Y. Kosaka, and Y. M. Okumura, 2012: Slowdown of the Walker circulation driven by tropical Indo-Pacific warming. Nature, 491, 439-443, doi:10.1038/nature11576.
- Trouet, V., M. P. Panayotov, A. Ivanova, and D. Frank, 2012: A pan-European summer teleconnection mode recorded by a new temperature reconstruction from the northeastern Mediterranean (ad 1768-2008). Holocene, 22, 887-898, doi:10.1177/0959683611434225.
- Vose, R. S., S. Applequist, M. J. Menne, C. N. Williams, Jr., and P. Thorne, 2012: An intercomparison of temperature trends in the US Historical Climatology Network and recent atmospheric reanalyses. Geophysical Research Letters, 39, doi:10.1029/2012GL051387.
- Wallace, J. M., Q. Fu, B. V. Smoliak, P. Lin, and C. M. Johanson, 2012: Simulated versus observed patterns of warming over the extratropical Northern Hemisphere continents during the cold season. Proceedings of the National Academy of Sciences of the United States of America, 109, 14337-14342, doi:10.1073/pnas.1204875109.
- Wang, C., S. Dong, A. T. Evan, G. R. Foltz, and S.-K. Lee, 2012: Multidecadal Covariability of North Atlantic Sea Surface Temperature, African Dust, Sahel Rainfall, and Atlantic Hurricanes. J. Clim., 25, 5404-5415, doi:10.1175/JCLI-D-11-00413.1.
- Wang, J.-S., and L. Zhao, 2012: Statistical tests for a correlation between decadal variation in June precipitation in China and sunspot number. Journal of Geophysical Research-Atmospheres, 117, doi:10.1029/2012JD018074.
- Wang, S.-Y., R. R. Gillies, and T. Reichler, 2012: Multidecadal Drought Cycles in the Great Basin Recorded by the Great Salt Lake: Modulation from a Transition-Phase Teleconnection. J. Clim., 25, 1711-1721, doi:10.1175/2011JCLI4225.1.
- Wang, X. L., Y. Feng, and V. R. Swail, 2012: North Atlantic wave height trends as reconstructed from the 20th century reanalysis. Geophysical Research Letters, 39, doi:10.1029/2012GL053381.
- Wang, Y. H., G. Magnusdottir, H. Stern, X. Tian, and Y. Yu, 2012: Decadal variability of the NAO: Introducing an augmented NAO index. Geophysical Research Letters, 39, doi:10.1029/2012GL053413.
- Woehrnschimmel, H., P. Tay, H. von Waldow, H. Hung, Y.-F. Li, M. MacLeod, and K. Hungerbuhler, 2012: Comparative Assessment of the Global Fate of alpha- and beta-Hexachlorocyclohexane before and after Phase-Out. Environmental Science & Technology, 46, 2047-2054, doi:10.1021/es203109q.
- Wu, L., and Coauthors, 2012: Enhanced warming over the global subtropical western boundary currents. Nature Climate Change, 2, 161-166, doi:10.1038/NCLIMATE1353.
- Xu, J., and A. M. Powell, Jr., 2012: Uncertainty estimation of the global temperature trends for multiple radiosondes, reanalyses, and CMIP3/IPCC climate model simulations. Theoretical and Applied Climatology, 108, 505-518, doi:10.1007/s00704-011-0548-z.
- Zhang, L., A. Kumar, and W. Wang, 2012: Influence of changes in observations on precipitation: A case study for the Climate Forecast System Reanalysis (CFSR). Journal of Geophysical Research-Atmospheres, 117, doi:10.1029/2011JD017347.
- Zhang, L., and C. Wang, 2012: Remote influences on freshwater flux variability in the Atlantic warm pool region. Geophysical Research Letters, 39, doi:10.1029/2012GL053530.
- Zhang, L., C. Wang, and L. Wu, 2012: Low-frequency modulation of the Atlantic warm pool by the Atlantic multidecadal oscillation. Climate Dynamics, 39, 1661-1671, doi:10.1007/s00382-011-1257-0.
- Zib, B. J., X. Dong, B. Xi, and A. Kennedy, 2012: Evaluation and Intercomparison of Cloud Fraction and Radiative Fluxes in Recent Reanalyses over the Arctic Using BSRN Surface Observations. J. Clim., 25, 2291-2305, doi:10.1175/JCLI-D-11-00147.1.
2011
- Achberger, C., and Coauthors, 2011: State of the Climate in 2010. Bulletin of the American Meteorological Society, 92, S1-S236, doi:10.1175/1520-0477-92.6.S1.
- Allan, R., P. Brohan, G. P. Compo, R. Stone, J. Luterbacher, and S. Broennimann, 2011: The International Atmospheric Circulation Reconstructions over the Earth (ACRE) Initiative. Bulletin of the American Meteorological Society, 92, 1421-1425, doi:10.1175/2011BAMS3218.1.
- Barbero, R., and V. Moron, 2011: Seasonal to decadal modulation of the impact of El Nino-Southern Oscillation on New Caledonia (SW Pacific) rainfall (1950-2010). Journal of Geophysical Research-Atmospheres, 116, doi:10.1029/2011JD016577.
- Barriopedro, D., E. M. Fischer, J. Luterbacher, R. Trigo, and R. Garcia-Herrera, 2011: The Hot Summer of 2010: Redrawing the Temperature Record Map of Europe. Science, 332, 220-224, doi:10.1126/science.1201224.
- Broennimann, S., G. P. Compo, R. Spadin, R. Allan, and W. Adam, 2011: Early ship-based upper-air data and comparison with the Twentieth Century Reanalysis. Climate of the Past, 7, 265-276, doi:10.5194/cp-7-265-2011.
- Bye, J., K. Fraedrich, E. Kirk, S. Schubert, and X. Zhu, 2011: Random walk lengths of about 30 years in global climate. Geophysical Research Letters, 38, doi:10.1029/2010GL046333.
- Cook, B. I., R. Seager, and R. L. Miller, 2011: On the Causes and Dynamics of the Early Twentieth-Century North American Pluvial. J. Clim., 24, 5043-5060, doi:10.1175/2011JCLI4201.1.
- Cornes, R. C., and P. D. Jones, 2011: An examination of storm activity in the northeast Atlantic region over the 1851-2003 period using the EMULATE gridded MSLP data series. Journal of Geophysical Research-Atmospheres, 116, doi:10.1029/2011JD016007.
- Dee, D. P., and Coauthors, 2011: The ERA-Interim reanalysis: configuration and performance of the data assimilation system. Quarterly Journal of the Royal Meteorological Society, 137, 553-597, doi:10.1002/qj.828.
- Dole, R., and Coauthors, 2011: Was there a basis for anticipating the 2010 Russian heat wave? Geophysical Research Letters, 38, doi:10.1029/2010GL046582.
- Donat, M. G., D. Renggli, S. Wild, L. V. Alexander, G. C. Leckebusch, and U. Ulbrich, 2011: Reanalysis suggests long-term upward trends in European storminess since 1871. Geophysical Research Letters, 38, doi:10.1029/2011GL047995.
- Ebita, A., and Coauthors, 2011: The Japanese 55-year Reanalysis "JRA-55": An Interim Report. Sola, 7, 149-152, doi:10.2151/sola.2011-038.
- Feng, M., C. Boening, A. Biastoch, E. Behrens, E. Weller, and Y. Masumoto, 2011: The reversal of the multi-decadal trends of the equatorial Pacific easterly winds, and the Indonesian Throughflow and Leeuwin Current transports. Geophysical Research Letters, 38, doi:10.1029/2011GL047291.
- Gottwald, G. A., L. Mitchell, and S. Reich, 2011: Controlling Overestimation of Error Covariance in Ensemble Kalman Filters with Sparse Observations: A Variance-Limiting Kalman Filter. Monthly Weather Review, 139, 2650-2667, doi:10.1175/2011MWR3557.1.
- Grunseich, G., B. Subrahmanyam, V. S. N. Murty, and B. S. Giese, 2011: Sea surface salinity variability during the Indian Ocean Dipole and ENSO events in the tropical Indian Ocean. Journal of Geophysical Research-Oceans, 116, doi:10.1029/2011JC007456.
- Haekkinen, S., P. B. Rhines, and D. L. Worthen, 2011: Atmospheric Blocking and Atlantic Multidecadal Ocean Variability. Science, 334, 655-659, doi:10.1126/science.1205683.
- Hanna, E., and Coauthors, 2011: Greenland Ice Sheet surface mass balance 1870 to 2010 based on Twentieth Century Reanalysis, and links with global climate forcing. Journal of Geophysical Research-Atmospheres, 116, doi:10.1029/2011JD016387.
- Hao, Z., J. Zheng, Q. Ge, and W.-C. Wang, 2011: Historical analogues of the 2008 extreme snow event over Central and Southern China. Climate Research, 50, 161-170, doi:10.3354/cr01052.
- Klotzbach, P. J., 2011: A simplified Atlantic basin seasonal hurricane prediction scheme from 1 August. Geophysical Research Letters, 38, doi:10.1029/2011GL048603.
- Lavers, D. A., R. P. Allan, E. F. Wood, G. Villarini, D. J. Brayshaw, and A. J. Wade, 2011: Winter floods in Britain are connected to atmospheric rivers. Geophysical Research Letters, 38, doi:10.1029/2011GL049783.
- Lee, S.-K., and Coauthors, 2011: What caused the significant increase in Atlantic Ocean heat content since the mid-20th century? Geophysical Research Letters, 38, doi:10.1029/2011GL048856.
- Linderholm, H. W., and Coauthors, 2011: Interannual teleconnections between the summer North Atlantic Oscillation and the East Asian summer monsoon. Journal of Geophysical Research-Atmospheres, 116, doi:10.1029/2010JD015235.
- Lovejoy, S., and D. Schertzer, 2011: Space-time cascades and the scaling of ECMWF reanalyses: Fluxes and fields. Journal of Geophysical Research-Atmospheres, 116, doi:10.1029/2011JD015654.
- Luo, F., S. Li, and T. Furevik, 2011: The connection between the Atlantic Multidecadal Oscillation and the Indian Summer Monsoon in Bergen Climate Model Version 2.0. Journal of Geophysical Research-Atmospheres, 116, doi:10.1029/2011JD015848.
- Mislan, K. A. S., and D. S. Wethey, 2011: Gridded meteorological data as a resource for mechanistic macroecology in coastal environments. Ecol Appl, 21, 2678-2690, doi:10.1890/10-2049.1.
- Moore, G. W. K., J. L. Semple, and G. Hoyland, 2011: Global Warming, El Nino, and High-Impact Storms at Extreme Altitude: Historical Trends and Consequences for Mountaineers. Journal of Applied Meteorology and Climatology, 50, 2197-2209, doi:10.1175/JAMC-D-11-023.1.
- Nigam, S., B. Guan, and A. Ruiz-Barradas, 2011: Key role of the Atlantic Multidecadal Oscillation in 20th century drought and wet periods over the Great Plains. Geophysical Research Letters, 38, doi:10.1029/2011GL048650.
- Ouzeau, G., J. Cattiaux, H. Douville, A. Ribes, and D. Saint-Martin, 2011: European cold winter 2009-2010: How unusual in the instrumental record and how reproducible in the ARPEGE-Climat model? Geophysical Research Letters, 38, doi:10.1029/2011GL047667.
- Parker, D. E., 2011: Recent land surface air temperature trends assessed using the 20th Century Reanalysis. Journal of Geophysical Research-Atmospheres, 116, doi:10.1029/2011JD016438.
- Pegion, K., and P. D. Sardeshmukh, 2011: Prospects for Improving Subseasonal Predictions. Monthly Weather Review, 139, 3648-3666, doi:10.1175/MWR-D-11-00004.1.
- Rasmussen, K. L., and R. A. Houze, Jr., 2011: Orogenic Convection in Subtropical South America as Seen by the TRMM Satellite. Monthly Weather Review, 139, 2399-2420, doi:10.1175/MWR-D-10-05006.1.
- Rienecker, M. M., and Coauthors, 2011: MERRA: NASA's Modern-Era Retrospective Analysis for Research and Applications. J. Clim., 24, 3624-3648, doi:10.1175/JCLI-D-11-00015.1.
- Rimbu, N., and G. Lohmann, 2011: Winter and summer blocking variability in the North Atlantic region - evidence from long-term observational and proxy data from southwestern Greenland. Climate of the Past, 7, 543-555, doi:10.5194/cp-7-543-2011.
- Schwalm, C. R., C. A. Williams, and K. Schaefer, 2011: Carbon consequences of global hydrologic change, 1948-2009. Journal of Geophysical Research-Biogeosciences, 116, doi:10.1029/2011JG001674.
- Smith, A., N. Lott, and R. Vose, 2011: The Integrated Surface Database Recent Developments and Partnerships. Bulletin of the American Meteorological Society, 92, 704-708, doi:10.1175/2011BAMS3015.1.
- Smith, J. A., M. L. Baeck, A. A. Ntelekos, G. Villarini, and M. Steiner, 2011: Extreme rainfall and flooding from orographic thunderstorms in the central Appalachians. Water Resources Research, 47, doi:10.1029/2010WR010190.
- Soon, W., K. Dutta, D. R. Legates, V. Velasco, and W. Zhang, 2011: Variation in surface air temperature of China during the 20th century. Journal of Atmospheric and Solar-Terrestrial Physics, 73, 2331-2344, doi:10.1016/j.jastp.2011.07.007.
- Stachnik, J. P., and C. Schumacher, 2011: A comparison of the Hadley circulation in modern reanalyses. Journal of Geophysical Research-Atmospheres, 116, doi:10.1029/2011JD016677.
- Stickler, A., and S. Broennimann, 2011: Significant bias of the NCEP/NCAR and twentieth-century reanalyses relative to pilot balloon observations over the West African Monsoon region (1940-1957). Quarterly Journal of the Royal Meteorological Society, 137, 1400-1416, doi:10.1002/qj.854.
- Tardif, J. C., M. P. Girardin, and F. Conciatori, 2011: Light rings as bioindicators of climate change in Interior North America. Global and Planetary Change, 79, 134-144, doi:10.1016/j.gloplacha.2011.09.001.
- Trenberth, K. E., J. T. Fasullo, and J. Mackaro, 2011: Atmospheric Moisture Transports from Ocean to Land and Global Energy Flows in Reanalyses. J. Clim., 24, 4907-4924, doi:10.1175/2011JCLI4171.1.
- Truchelut, R. E., and R. E. Hart, 2011: Quantifying the possible existence of undocumented Atlantic warm-core cyclones in NOAA/CIRES 20th Century Reanalysis data. Geophysical Research Letters, 38, doi:10.1029/2011GL046756.
- van den Besselaar, E. J. M., M. R. Haylock, G. van der Schrier, and A. M. G. K. Tank, 2011: A European daily high-resolution observational gridded data set of sea level pressure. Journal of Geophysical Research-Atmospheres, 116, doi:10.1029/2010JD015468.
- Vicente-Serrano, S. M., and Coauthors, 2011: A multiscalar global evaluation of the impact of ENSO on droughts. Journal of Geophysical Research-Atmospheres, 116, doi:10.1029/2011JD016039.
- Villarini, G., J. A. Smith, M. L. Baeck, T. Marchok, and G. A. Vecchi, 2011: Characterization of rainfall distribution and flooding associated with US landfalling tropical cyclones: Analyses of Hurricanes Frances, Ivan, and Jeanne (2004). Journal of Geophysical Research-Atmospheres, 116, doi:10.1029/2011JD016175.
- Wang, X. L., and Coauthors, 2011: Trends and low-frequency variability of storminess over western Europe, 1878-2007. Climate Dynamics, 37, 2355-2371, doi:10.1007/s00382-011-1107-0.
- Webb, J. D. C., 2011: Violent thunderstorms in the Thames Valley and south Midlands in early June 1910. Weather, 66, 153-155, doi:10.1002/wea.799.
- Winkler, J. A., G. S. Guentchev, M. Liszewska, Perdinan, and P.-N. Tan, 2011: Climate Scenario Development and Applications for Local/Regional Climate Change Impact Assessments: An Overview for the Non-Climate Scientist. Geography Compass, 5, 301-328, doi:10.1111/j.1749-8198.2011.00426.x.
- Woollings, T., 2011: Ocean Effects of Blocking. Science, 334, 612-613, doi:10.1126/science.1214167.
- Zhang, X., L. Jin, C. Chen, D. Guan, and M. Li, 2011: Interannual and interdecadal variations in the North Atlantic Oscillation spatial shift. Chinese Science Bulletin, 56, 2621-2627, doi:10.1007/s11434-011-4607-8.
- Zhao, P., S. Yang, H. Wang, and Q. Zhang, 2011: Interdecadal Relationships between the Asian-Pacific Oscillation and Summer Climate Anomalies over Asia, North Pacific, and North America during a Recent 100 Years. J. Clim., 24, 4793-4799, doi:10.1175/JCLI-D-11-00054.1.
- Zhou, X., P. Zhao, G. Liu, and T. Zhou, 2011: Characteristics of decadal-centennial-scale changes in East Asian summer monsoon circulation and precipitation during the Medieval Warm Period and Little Ice Age and in the present day. Chinese Science Bulletin, 56, 3003-3011, doi:10.1007/s11434-011-4651-4.
pre-2011
- Broennimann, S., A. Stickler, T. Griesser, A. M. Fischer, A. Grant, T. Ewen, T. Zhou, M. Schraner, E. Rozanov, and T. Peter, 2009: Variability of large-scale atmospheric circulation indices for the Northern Hemisphere during the past 100 years. Meteorol. Z., 18, 379-396, doi:10.1127/0941-2948/2009/0389.
- Whitaker, J.S., G.P. Compo, and J.-N. Thepaut, 2009: A comparison of variational and ensemble-based data assimilation systems for reanalysis of sparse observations. Mon. Wea. Rev., 137, 1991-1999, doi:10.1175/2008MWR2781.1.
- Brown, P. J., and A.T. DeGaetano, 2013: Trends in U.S. Surface Humidity, 1930-2010. J. Appl. Meteor. Climatol., 52, 147-163, doi:10.1175/JAMC-D-12-035.
- Cook, B.I., R. Seager, and R.L. Miller, 2010: Atmospheric circulation anomalies during two persistent north american droughts: 1932-1939 and 1948-1957. Clim. Dyn., 36, 2339-2355. doi:10.1007/s00382-010-0807-1.
- de Bruin, H. and H. Van den Dool, 2010: De storm van 1894: Een ramp voor Scheveningen, en een test case voor moderne meteorologen.Zenit, August, 316-320.
- Emanuel, K., 2010: Tropical Cyclone Activity Downscaled from NOAA-CIRES Reanalysis, 1908-1958. J. Adv. Model. Earth Syst., Vol. 2, Art. #1, 12 pp., doi:10.3894/JAMES.2010.2.1.
- Giese, B.S., G.P. Compo, N.C. Slowey, P.D. Sardeshmukh, J.A. Carton, S. Ray, and J.S. Whitaker, 2010:The 1918/1919 El Ni�o. Bull. Amer. Meteor. Soc., 91, 177-183, doi:10.1175/2009BAMS2903.
- Lovejoy, S., and D. Schertzer, 2010: Towards a new synthesis for atmospheric dynamics: Space-time cascades, Atmos. Res., 96, 1-52, doi:10.1016/j.atmosres.2010.01.004.
- Wood, K. R., and J.E. Overland, 2010: Early 20th century Arctic warming in retrospect, Int. J. of Climatol., 30, 1269-1279, doi:10.1002/joc.1973.
In the News
The following external links to news articles and blogs are provided as a courtesy. Endorsement of non-NOAA sites is not implied.
 | 09/19/23 | Recovered WWII Pearl Harbor ship data aids climate study. (Interesting Engineering). |
|---|---|---|
 | 08/08/23 | How global warming favors heavy rain (Tages Anzeiger, in German). |
 | 07/20/23 | Trinity Nuclear Test’s Fallout Reached 46 States, Canada and Mexico, Study Finds (NYT from study). |
 | 11/02/22 | How centuries-old whaling logs are filling gaps in our climate knowledge (Grist). |  | 06/27/22 | Hurricane numbers are decreasing in every ocean basin except for one, study finds. (CNN). Also Tropical cyclones now ‘13% less frequent’ due to climate change (CarbonBrief), Tropical cyclones' decline a climate change sign (Manila Times), (phys.org), Tropical cyclones have decreased alongside human-caused global warming, but don't celebrate yet (Cosmos Mag), Research: Global warming contributed to decline in tropical cyclones in the 20th century (NOAA Research) |
|---|---|---|
 | 06/02/22 | Crowdsourced Weather Projects Boost Climate Science Research. (EOS). |
 | 02/22/22 | The jet stream that brought in Storm Eunice is moving northwards. (EurkAlert). |
 | 02/11/22 | 'Snow King' Blizzard, Arctic outbreak still unmatched 123 years later. (Accuweather). |
 | 12/03/21 | North Atlantic hurricanes have become more frequent amid warming - study (Reuters). |
|---|---|---|
 | 12/02/21 | Climate modeling confirms historical records showing rise in hurricane activity (Phys.org). |
 | 12/02/21 | Study finds Atlantic hurricanes becoming more frequent, destructive (Wa. Post). |
 | 05/18/21 | New Global Storm Surge Reconstructions Database Draws on CPO Investments in 20th Century Reanalysis Project (NOAA/CPO). |
 | 12/15/20 | Evaluating the Newest Version of the NOAA-CIRES-DOE 20th Century Reanalysis Product. (NOAA/CPO). |
|---|---|---|
 | 08/13/20 | Weather in the Foothills. (Crescenta Valley Weekly). |
 | 08/17/20 | Scorching Heat in Death Valley. (Wasatch Weather Weenies). |
 | 01/15/20 | Rescued Records Help us Understand Science. (CIRES Spheres). |
 | 01/15/20 | NOAA Picks Updates Its Massive Supercomputer Generated Climate Dataset. (HPC Wire). |
 | 01/12/20 | NOAA Releases Extended Version of 20th Century Reanalysis Project. (Berkeley Lab). Also [Primeur Magazine]. |


 | 11/29/18 | Inside the Seas of Knowledge Digitization Project (National Archives Foundation) |
|---|---|---|
 |
03/20/18 | C3S and NOAA cooperate on integrating historical weather data for new Climate Data Store (ECMWF Copernicus Climate Change Service) |
| 12/13/17 | The 'weather detectives' using clues from the past to study changing climate (Stuff: Science) |
|---|---|
| 03/28/17 | A Century-Old Arctic Shipwreck Could Help Us Predict Extreme Weather (FiveThirtyEight) |
| 07/15/16 | Investigating the Great Flood of 1916 (NOAA news and updates) |
|---|---|
| 06/30/16 | The discovery of diaries of an English missionary living in Northland in the 1800s reveals him as New Zealand’s first meteorologist (NIWA) |
| 06/20/16 | Symposium looks at devastation of Flood of 1916. (Citizen-Times USA Today) |
| 06/16/16 | Better bad weather with oldWeather (Old Weather Blog) |
| 06/07/16 | Upcoming PRECIS (Providing REgional Climates for Impacts Studies) workshops. (UK Met Office) |
| 05/31/16 | Too windy for Zeppelins (Old Weather Blog) |
| 01/16/16 | Climatologists find ice clues in old whaling ship logbooks (ClimateWire) |
| 03/30/15 | Exploring the NOAA/CIRES Twentieth Century Global Reanalysis Version 2c (NCAR Research Data Archive Blog) |
|---|---|
| 03/30/15 | 1938 atmospheric river that caused the Los Angeles flood of 1938 (NCAR Research Data Archive Blog) |
| 10/20/15 | Droughts and shifts in tropical circulation (The Oeschger Centre for Climate Change Research) |
| 03/17/15 | Cold-Season Storms and Extreme River Flooding in Belarus (CO2 Science) |
| 04/11/15 | Palm Sunday 1965: Southern Great Lakes ravaged by one of the worst tornado outbreaks on record (United States Tornadoes) |
Resources
At PSL
- 20th Century Reanalysis Project – A Portal to Past Weather: Handout
- International Surface Pressure Databank (ISPD): maps of observation locations through time.
- International Surface Pressure Databank (ISPD): annual and monthly maps of observation counts through time (obs used in 20CRv3).
- FACTS (FAcility for Climate AssessemenTS): Near Real-Time Tools for Weather and Climate Event Assessment
- PSL Monthly Climate Indices: Plot, analyze and obtain various ocean and atmospheric indices including the the North Atlantic Oscillation (NAO), the Arctic Oscillation (AO) the SOI and many others.
- Overview slide about the 20CR project suitable for talks.
Animations
- View custom weather event animations made at PSL
- Generate your own animations at PSL
- 20CRv3 diagnostics and animations from oldweather
- View 20CR Vimeo animations
External
- Reanalyses.org: Advancing Reanalysis
- KMNI Data Explorer
- GCOS Surface Pressure Working Group
- International Surface Pressure Databank (ISPD)
- International Comprehensive Ocean-Atmosphere Data Set
- NOAA National Centers for Environmental Information (NCEP)
- International Best Track Archive for Climate Stewardship
- NCEP/NCAR Reanalysis Project
- NOAA National Centers for Environmental Prediction (NCEI)
- National Center for Atmospheric Research (NCAR)
- Atmospheric Circulation Reconstructions over the Earth initiative (ACRE)
- IEDRO Weather Data Rescue Organization
- Synoptic maps of 20CRv3 from Wetterzentrale: 6 hourly 20CRv3 maps for SLP/500 hPa geopotential height,SLP/850T, 850 streamlines.