Ozone Measurements and Distribution
Ozone was discovered by C. F. Schönbein when observing electrical discharges in 1839 but it was not until after 1850 that it was determined to be a natural atmospheric constituent. Its name comes from the Greek word meaning "smell", a reference to ozone's distinctively pungent odour when in large concentrations. Surface ozone measurements have been made regularly since the 1860s. In 1880, experiments showed that ozone strongly absorbed radiation in the ultraviolet part of the sunlight spectrum. This led by 1913, to conclusive proof that most of the atmosphere's ozone was located in the stratosphere. It was later shown that its maximum concentration occurs between 19 and 23 km (Figure 1).
| OZONE
MEASUREMENTS AND UNITS
Total ozone is defined as being equal to the amount
of ozone contained in a vertical column of base 1 cm2
at standard pressure and temperature. It can be expressed in units
of pressure, typically about 0.3 atmosphere centimetres. The milli-
atmosphere centimetre -- m atm. cm (commonly called the Dobson Unit
corresponding to an average atmospheric concentration of approximately
one part per billion by volume (1 ppbv) of ozone, is most frequently
used. Ozone is not distributed uniformly through the vertical column. The Umkehr Effect 
An optical effect is observed when the ratio of
the measured intensities of scattered zenith skylight at two different
wavelengths (311 and 332 nm) is plotted against the increasing zenith
angle of the Sun between 60° and 90°. The ratio increases with increasing
zenith angle up to about 86°, then a reversal (Umkehr) occurs. |
Following the first quantitative total column ozone measurements in 1920, G. M. B. Dobson. an Oxford scientist, perfected an instrument to monitor total ozone routinely. The instrument was a landmark in ozone science. It is still the backbone of the Global Ozone Observing System and is continuously in use today at almost 100 observatories around the world. Amounts of ozone are regularly reported in thickness of the total column ozone, commonly known as Dobson Units (see blue box above).
Since the late 1950s, filter ozonometers at 44 stations in the former USSR have also provided valuable data. In the last decade, an automated Brewer ozone- spectrophotometer has been developed. A number of these instruments are starting to report ozone data.
Ground-based measurements are now augmented by specialized equipment on satellites, such as the Total Ozone Mapping Spectrometer (TOMS), the Stratospheric Aerosol and Gas Experiment and the Solar Backscatter Ultra Violet spectrometer.
 |
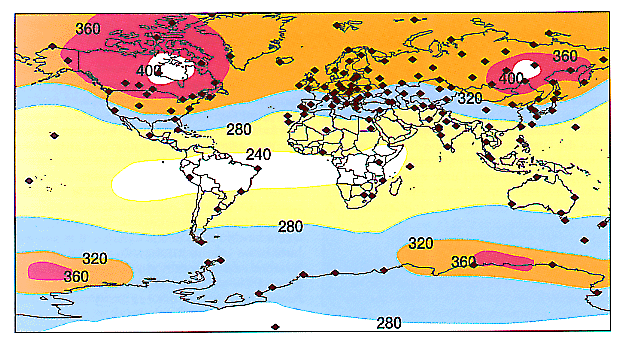
| Figure 2 -- Locations of active GO3OS stations with an indication of the average ozone distribution: low in the equatorial belt, high in the middle (and northern polar latitudes) |
In 1929, a method, called the Umkehr effect (see box above), of determining the vertical profile of ozone concentrations was discovered. It was followed in the 1930s by the development of the photochemical theory of ozone formation by Chapman. Later, balloon ozonesondes provided ozone profile data. For more on the history of ozone see "Milestones in the History of Ozone".
A global network of ozone observing stations formed part of the plans for the ambitious International Geophysical Year (IGY) of 1957. During the Year, WMO assumed responsibility for the collection of ozone data from the IGY. In collaboration with the International Ozone Commission, the Organization developed standard procedures and coordination, thereby ensuring uniform high quality ozone measurements. These activities can be said to mark the launch of the WMO Global Ozone Observing System, now part of the Global Atmosphere Watch (GAW).
Up to this point, ozone studies had been undertaken solely for scientific purposes, such as determining the role of ozone in the radiative balance or its potential for being used as a tracer for atmospheric circulation. A link between increased ultraviolet radiation and skin cancer had been suspected, but the world was still unaware of the potential for human activities to deplete the ozone layer.
Ozone is being produced all year round in the stratosphere over the equatorial belt. It is transported by air movements towards the polar latitudes. The bottom of the stratospheric reservoir, where most of the ozone resides, is determined by the height of the tropopause
Favoured by the extensive poleward air currents, ozone reaches its highest values over the Canadian Arctic and over Siberia. During winter in the southern hemisphere, a nearly symmetrical cold air polar vortex prevents the ozone- rich air from the tropics from reaching southernmost latitudes. Ozone concentration remains high over middle latitudes until the austral summer. As we will see later, these specific meteorological conditions over Antarctica and the presence of large amounts of reactive chlorine facilitate ozone destruction.
|
THE TROPOPAUSE The isothermal region separating the troposphere from the stratosphere (Figure 1), the tropopause lies at an altitude of 8-10 km at polar latitudes and nearly 18 km over the equatorial belt. |