U.S. Department of Commerce | National Oceanic & Atmospheric Administration | NOAA Research

Calendar |  People |  Publications
NOAA Logo
Earth System Research Laboratory
Global Monitoring Division
  • Home
  • About
    • About GMD
    • Organization Chart
    • Staff
    • Staff by Group
    • Contacts
    • Employment
  • Research
    Research Areas
    • Overview
    • Climate Forcing
    • Ozone Depletion
    • Baseline Air Quality
    • Central Calibration Laboratory
    Research Groups
    • Aerosols
    • Greenhouse Gases
    • Halocarbons and Trace Gases
    • Ozone and Water Vapor
    • Solar and Infrared Radiation
  • Products
    Data
    • Search for Data
    • Data Archive
    • Measurement Sites
    Tools
    • Interactive Data Viewer
    • Solar Calculator
    Products
    • Greenhouse Gas Index
    • Ozone Depletion Index
    • Trends in CO2
    • CarbonTracker
    • ObsPack
    • GLOBALVIEW
    • Barrow Snow Melt Dates
    Visualization
    • Ozone and Water Vapor
    • Radiation
    • Trace Gases
    • Aerosols
    • South Pole Ozone Hole

    More Options...
  • Observatories
    • Observatory Operations
    • Barrow, Alaska
    • Trinidad Head, California
    • Mauna Loa, Hawaii
    • American Samoa
    • South Pole
    • Summit, Greenland
  • Information
    • Education/Outreach
    • News
    • Publications
    • FAQ's
    • Seminars
    • Safety Program
    • Links
    • Visitor Information
    • Photo Gallery
    • South Pole Webcam
    • Mauna Loa Webcams
    • Barrow Webcam

    • Global Monitoring Division Review
    Global Monitoring Annual Conference
    GMAC
    The next Global Monitoring Conference is scheduled to be held May 21-22, 2013 in Boulder.
  • Site Map
  • Intranet

Education and Outreach

  • Home

Measuring Greenhouse Gases:
Behind the Scenes

  • Home

Air Sampling Network

  • Introduction
  • Surface Network
  • Aircraft
  • Tall Towers
    • Boulder Atmospheric Observatory
  • Baseline Observatories

Boulder Central Facility

  • Introduction
  • Flask Logistics Lab
    • Why Do We Measure Greenhouse Gases?
    • Why Do We Measure the 6 Gases We Do?
  • Measurement Lab
    • Gas Analyzers
    • Standards
  • Calibration Lab
    • Standards Preparation
    • Manometric System
    • Transfer Calibrations

Resources

  • Glossary
Measuring & Analyzing Greenhouse Gases: Behind the Scenes

Tall Tower Measurements

The tall tower network provides regionally representative measurements of carbon dioxide (CO2) and related gases in the continental boundary layer. Measurements began on tall towers in the 1990s in order to extend long-term carbon-cycle gas monitoring to continental areas. Existing television, radio and cell phone towers are utilized as sampling platforms for in-situ and flask sampling of CO2 and other atmospheric trace gases.


Locations of tall tower measurement sites. The yellow triange indicates a discontinued site.

Read more about the tower sites here...

Why Tall Towers?

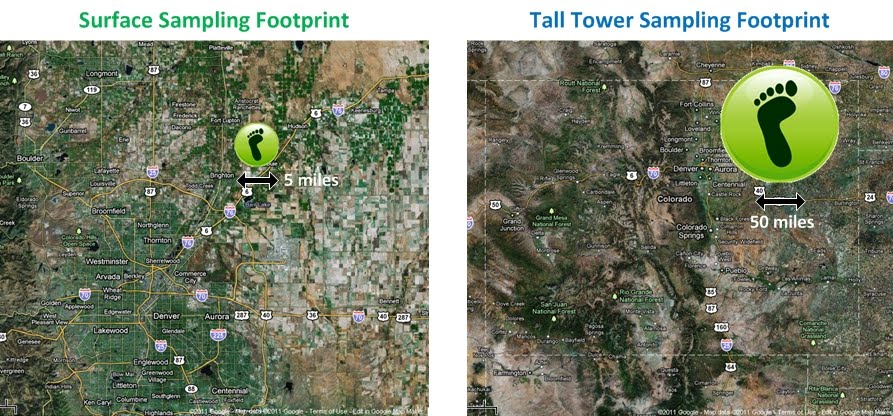
Tall tower measurements allow us to determine the flux (how much is being released or soaking up) of trace gases over larger areas than is possible by just measuring at the surface. Because air mixes upward over time, the higher you sample the air, the larger "footprint" you are sampling from. For instance, CO2 being released by a factory 20 miles away from the tower will mix with air from the surrounding area as it goes up into the sky. If you sample the air 300 meters above the ground, you may be able to detect the effects of that factory. But if you sampled the air at the ground, you would most likely not be able to detect the effects of the CO2-emitting factory 20 miles away.


Footprint Comparison: The arrows represent actual distances, and the area under the green footprint circle represents how large of an area influences the air being sampled. Tall towers can sample air that is representative of a much larger "footprint" area compared to sampling air at the surface. This is one of the benefits of having Tall Towers continuously measuring greenhouse gas concentrations because we can monitor a larger area.

How Tall Should a Tall Tower Be?

As tall as possible! The taller the tower, the larger the "footprint." However, building a new tall tower costs millions of dollars, so existing television, radio, and cell phone towers are used instead. The towers in our network reach up to 500 meters (1640 feet). Which towers we choose to use depends on what we want to research. For instance, if we want to see the effects of agriculture on the CO2 in the air, we will equip a tower located within an area that grows large amounts of corn (check out the West Branch, Iowa tower). If we want to see the effects of urban cities, we will equip a tower near or within a large city (check out the INFLUX towers in Indianapolis, IN).

What Do We Measure at the Towers?

CO2, the most important greenhouse gas, is measured continuously at all the tall towers. Most towers also measure carbon monoxide (CO) and/or methane (CH4) continuously as well. In addition, flask samples are taken daily at each tower. These flasks are sent back to the CCGG Boulder Central Facility for analysis of more than 50 greenhouse and other trace gases. These flasks are also a double check to the continuous in-situ measurements.

How Do We Make Measurements at Tall Towers?

Unlike all the other towers in our network, the Boulder Atmospheric Observatory (BAO) Tall Tower was built specifically for atmospheric research. Follow the link to take a close look at this tower and show what goes on.

Previous Next Top
U.S. Department of Commerce | National Oceanic and Atmospheric Administration
Earth System Research Laboratory | Global Monitoring Division
http://www.esrl.noaa.gov/gmd/education/behind_the_scenes/towers.html
Privacy Policy | Accessibility | Disclaimer | USA.gov
Contact Us | Webmaster
Site Map