Kawasaki Disease: A Climate Connection?
Jane C. Burns, Garrick Tong, Daniel R. Cayan, Christena L. Turner, Michael D. Dettinger, Emelia Bainto, Henry F. Diaz, Hiroshi Yanagawa,Tomisaku Kawasaki, Yosikazu Nakamura, Mayumi Yashiro, Erin Miller
University of California, San Diego, School of Medicine, Scripps Institution of Oceanography, Jichi Medical School, Tochigi, Japan, University of Southern California
Kawasaki disease is an acute systemic illness characterized by inflammation of the blood vessels. It is almost exclusively a pediatric illness. Left untreated, 15% to 25% of untreated children with Kawasaki disease suffer damage to the coronary arteries, making Kawasaki disease a leading cause of acquired heart disease in children.
The cause of Kawasaki disease is unknown. An infectious etiology is suggested for a number of reasons. First, Kawasaki disease is almost exclusively a pediatric illness; suggesting the development of passive immunity by adulthood. Geographic outbreaks occur, with an increase in the number of cases in the late winter and early spring . Lastly, children with acute Kawasaki disease have an appearance that is similar in some respects to those with other infectious diseases (i.e., scarlet fever, adenovirus). However, Kawasaki disease is not spread from person to person or "catching". Because no bacteria or virus has been proven to cause Kawasaki disease, some experts have wondered whether the inflammation in Kawasaki disease may represent a "final common pathway" and that more than one agent might be responsible. Genetic susceptibility may play a role in Kawasaki disease: 1) individuals of Japanese origin, no matter where in the world they live, are more likely to acquire Kawasaki disease; 2) brothers and sisters of children with Kawasaki disease are more likely than other neighborhood children to develop the illness at a later time; and 3) Kawasaki disease has been reported in the children of parents who themselves had been affected in childhood. Epidemiological studies have found associations between the occurrence of Kawasaki Disease and recent exposure to carpet cleaning and residence near a body of stagnant water; however, cause and effect have not been established.
Because of the factors that suggest a seasonal relationship and similarities to other infectious diseases, climate and medical researchers at the NOAA/ESRL Physical Sciences Laboratory, UCSD and elsewhere have investigated possible climate relationships with the incidence of the disease.
Climate and KD in San Diego
Although the seasonality of KD in many regions has been recognized for over two decades, the first systematic study of a KD/climate association was conducted at UCSD. During the five-year study period (1994-1998), a total of 169 San Diego residents were diagnosed and treated for KD in San Diego County. Date of admission was used to analyze the mean distribution of patients by month. Despite the temperate climate and lack of extreme seasonal temperature variation in San Diego County, a peak in KD cases was consistently noted in the late winter/early spring. This coincided with the months of lowest temperatures and greatest precipitation. Because of the substantial variation from year to year in temperature and precipitation, we analyzed the association between the number of KD patient admissions per month and mean monthly temperature and precipitation over the study period. KD incidence was inversely associated with mean monthly temperature (r=-0.47, p<0.001), and positively associated with mean monthly precipitation (r=0.52, p<0.001) during the 60-month period.
|
| Plot of annual cycle of KD onset in San Diego |
To carry this investigation further, we present here a comparison of seasonality, anomalous variability, and 700mb air circulation derived from analyzing a collection of California and Japan KD case histories.
Data and Methodology
In addition to the San Diego data set, we used the following Kawasaki disease datasets:
- Office of Statewide Health Planning and Development (OSHPD): Complete dataset of all hospital discharges for state of California and for the state of Hawaii for 1992-2000. KD patients will be identified by ICD 9 discharge code 446.1 and address and date of admission can be extracted. Date of onset will be estimated as occurring 6 days prior to admission, since this represents the average day of referral for these patients (Burns et al., 1991).
- Japanese Ministry of Health KD dataset for Japan: This data base has been maintained since 1970 and contains data on over 180,000 KD patients including place of residence (for GIS mapping) and date of disease onset.
Monthly KD Anomalies:
To remove the regular seasonal behavior from KD time series, residual "anomalies" from the long term monthly mean (LTM) was derived. LTM from North and South Japan and for Northern and Southern California The large KD epidemic years in Japan (1979-1986) were omitted from the LTM calculations. For both Japan and California, the linear trend was removed and calculated for each of the 12 months individually.
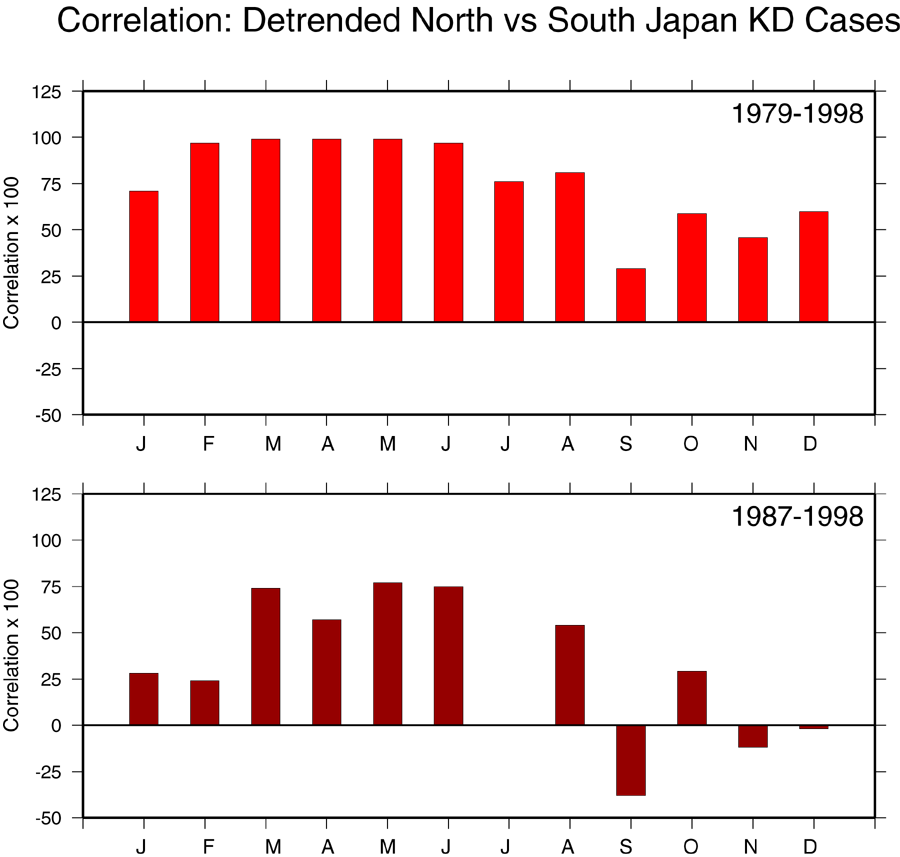 Correlation of KD cases for southern Japan versus northern
Japan for 1979-1998 (upper plot) and 1987-1998 (lower plot).
The KD time series has been detrended. Correlations indicate the high
coherence between the number of cases in southern and northern Japan.
Correlation of KD cases for southern Japan versus northern
Japan for 1979-1998 (upper plot) and 1987-1998 (lower plot).
The KD time series has been detrended. Correlations indicate the high
coherence between the number of cases in southern and northern Japan.
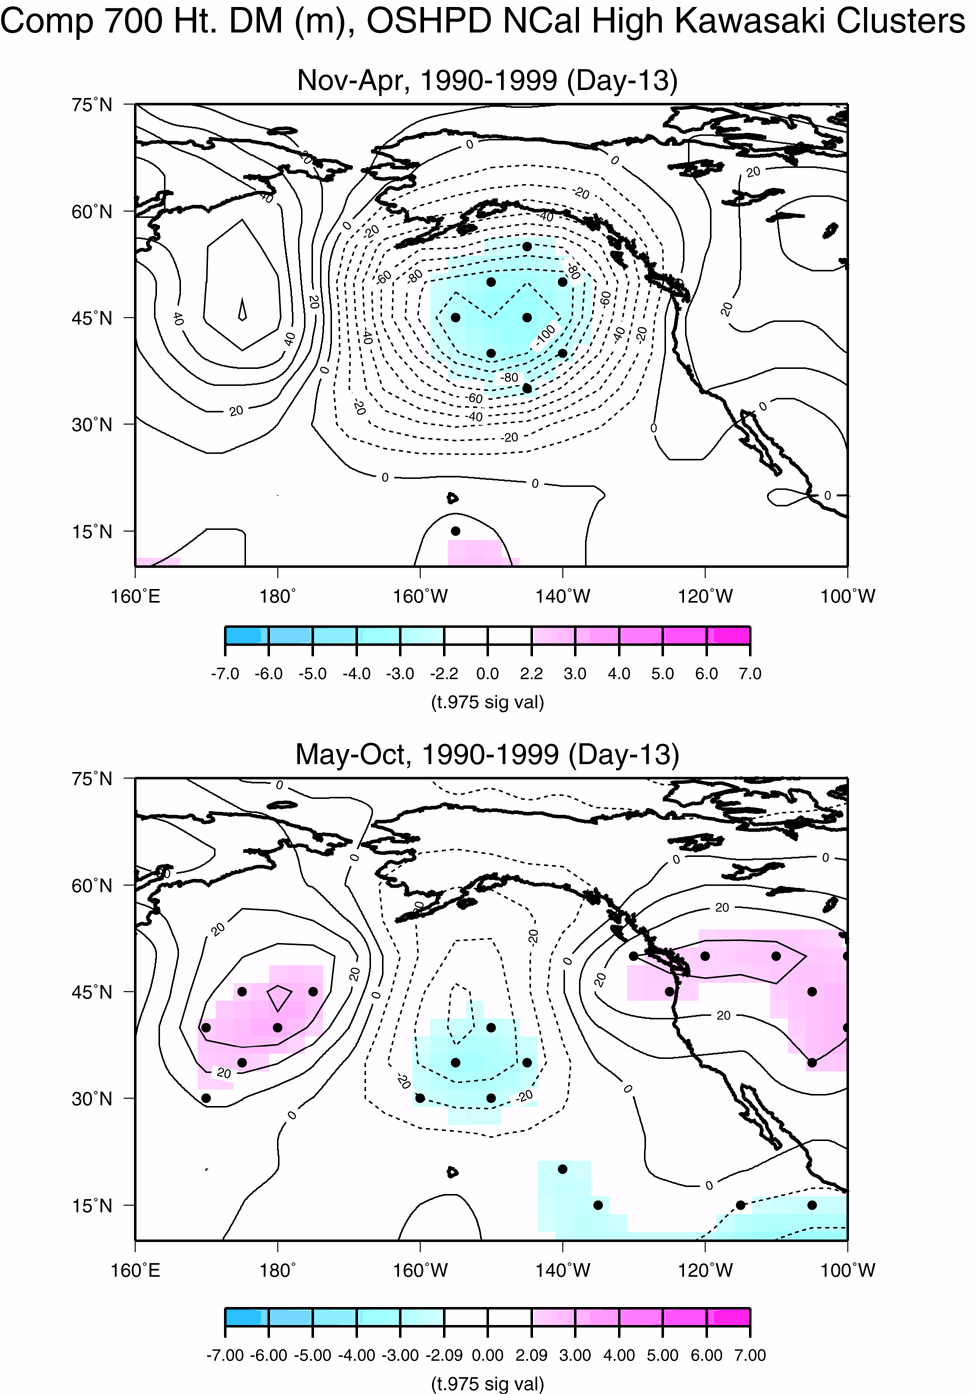
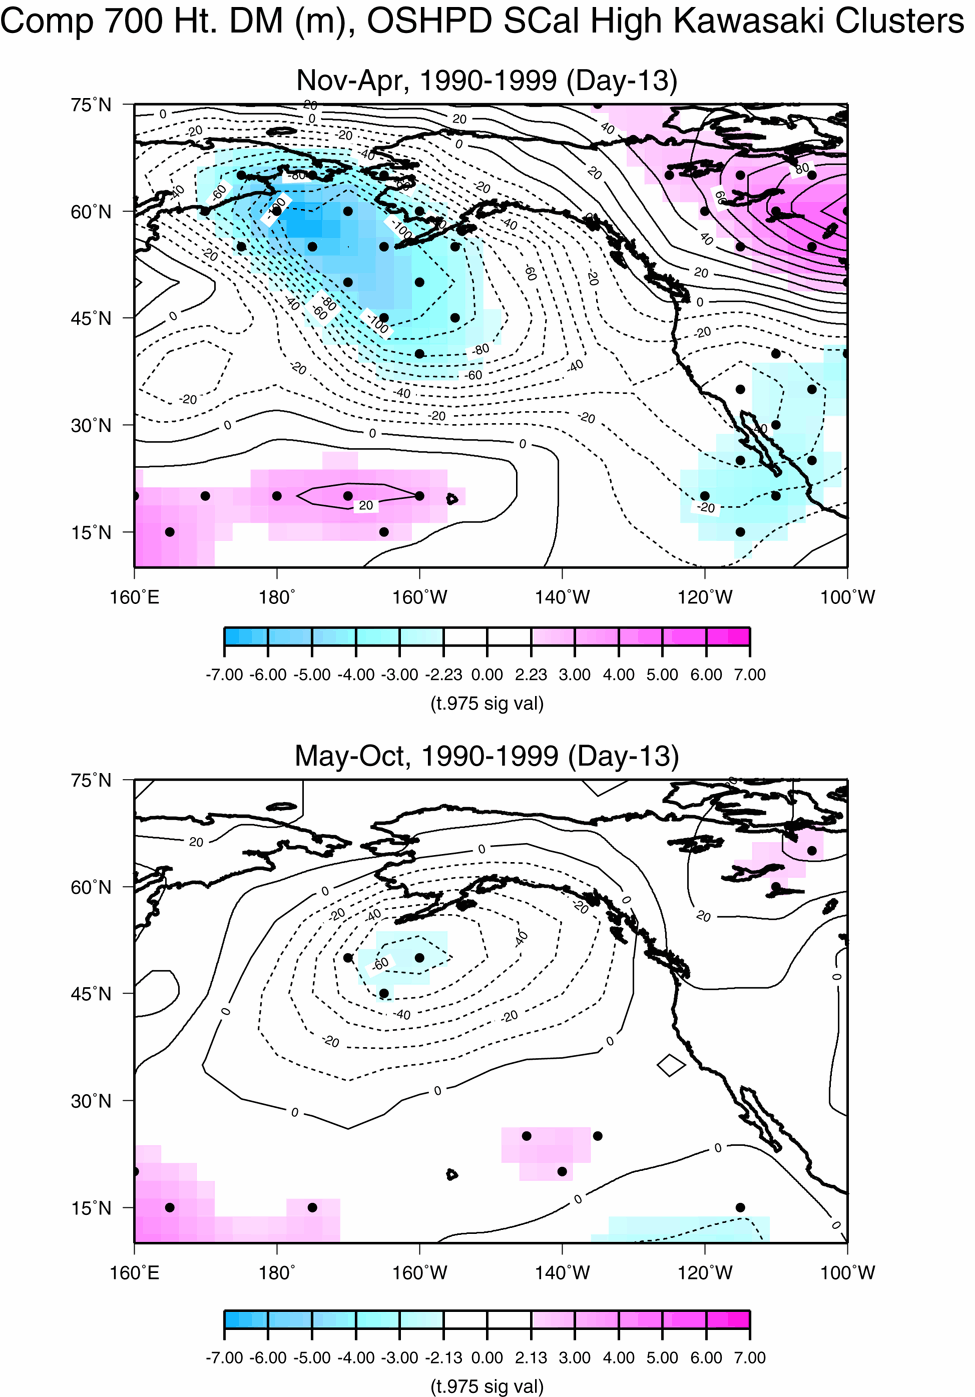
Kawasaki Clusters: We determined Kawasaki cluster dates by using a preset computer algorithmic test.�The aggregate number of Kawasaki cases falling within a preset timeframe had to pass a threshold value, in order for those days to be declared a Kawasaki "cluster" For example, the Southern California November to April composite dates were determined by meeting the requirement of having more than seven Kawasaki cases within any consecutive four day period from 1990 to 1999.The first day of that four day cluster span is then used for building the 700mb composite maps seen.
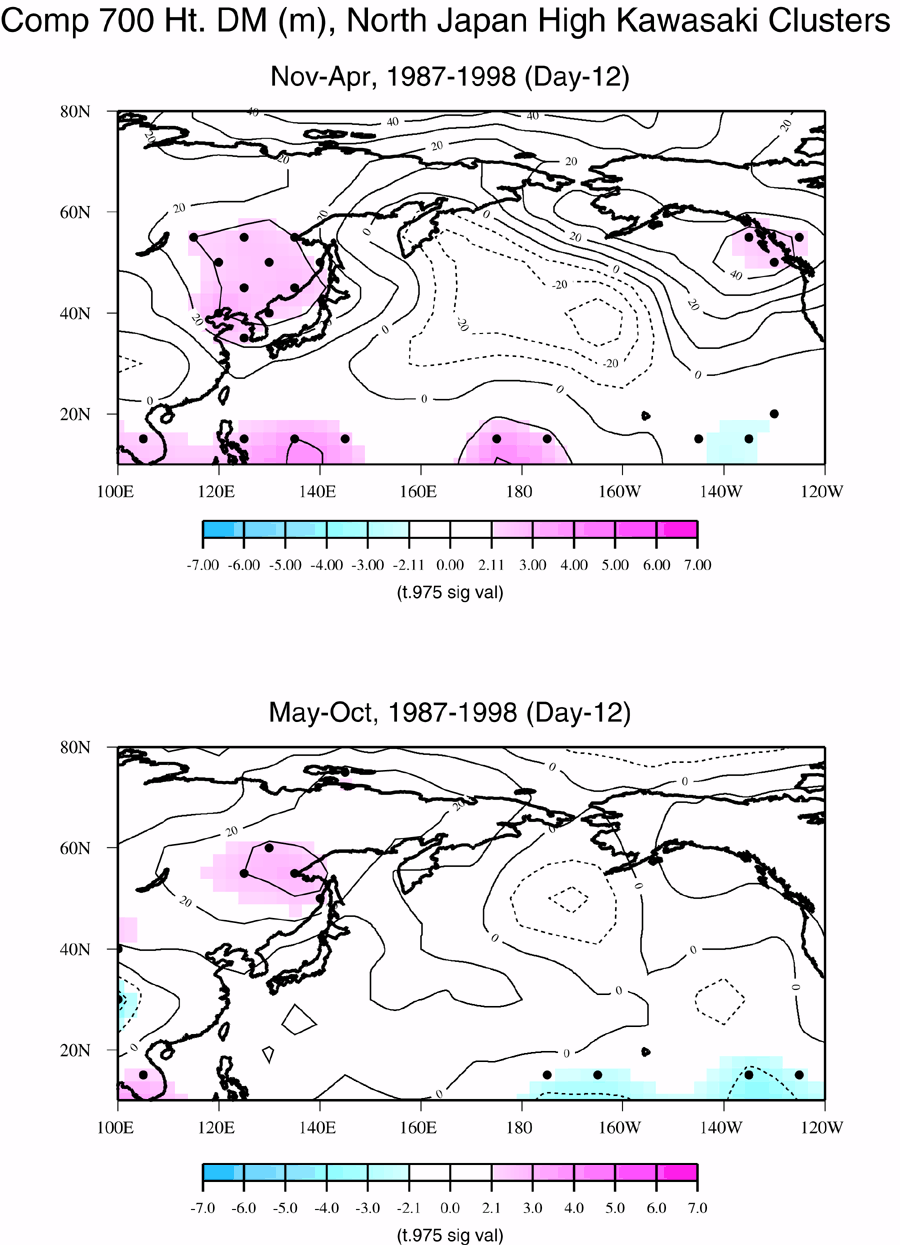
700mb Composites:
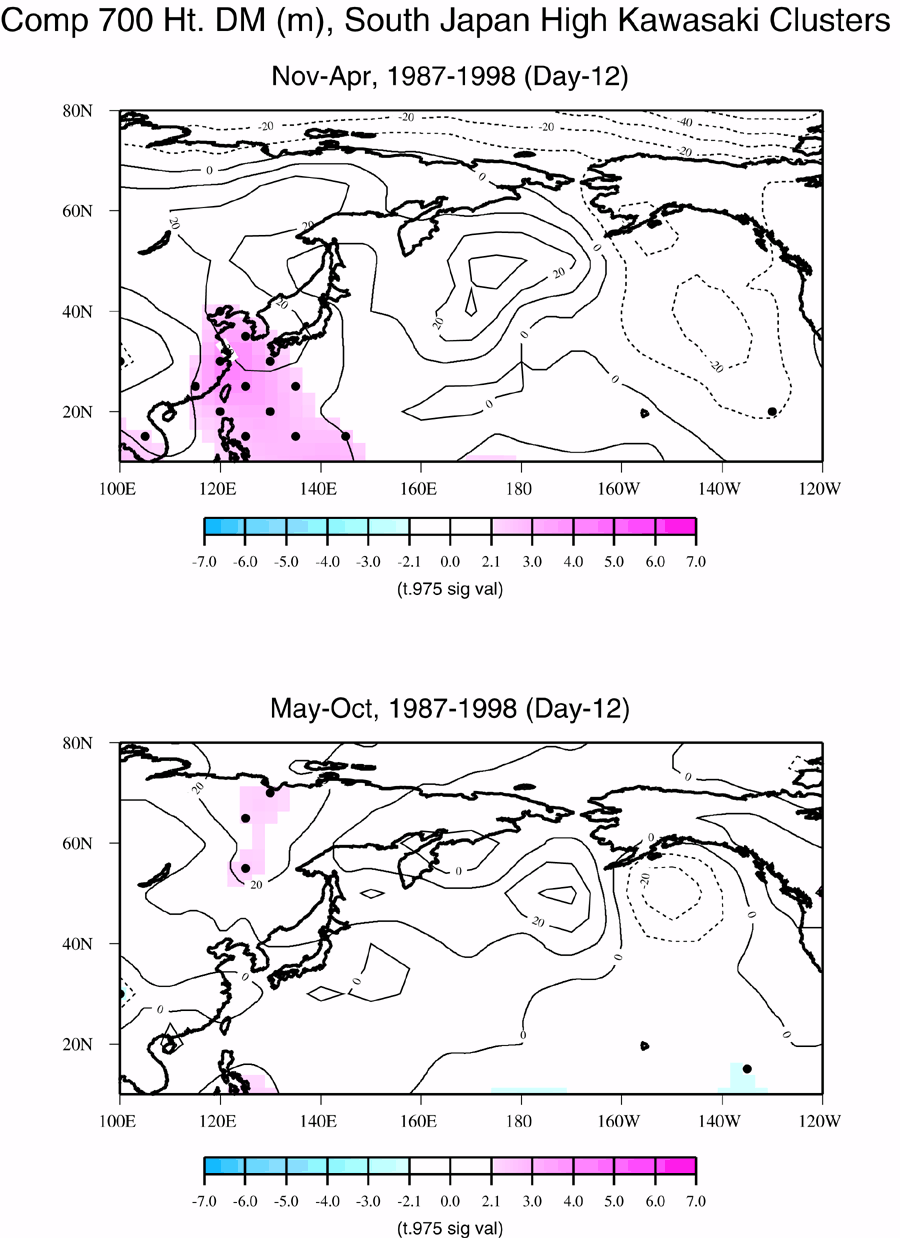
Composite 700mb geopotential height anomalies were produced by averaging several days anomalies of the 700mb height field� that corresponded in time to exceptional KD activity, each of these days defined by the beginning of separate KD cluster. The average thus takes in as its members the same number of 700mb maps as there are members of KD events selected in the set of KD clusters. The 700mb height is the height of the 700mb pressure surface,about 3km in elevation above sea level; the anomalous 700mb height is a good representation of the tropospheric pressure structure and thus the anomalous circulation of air--clockwise/counterclockwise around positive/negative height centers. Anomalies are calculated relative to a 1950-1999 dataset. Composites were actually performed for a sequence of such days, from 14 days before through 7 days after the beginning of a KD cluster. Anomalies that are statistically significant in exceeding the null hypothesis at the 95% level of confidence via a two-tailed t-test are designated by a (Recall that the beginning of a cluster can be thought of as the start of a burst of hospitalizations). The composites are thus used to determine if there is a sort of "fingerprint" for the anomalous weather pattern that leads to a KD episode.To increase the veracity of these tests, the Japan and California sample sets were divided regionally into north and south subsets and further, by time of year into winter-half and summer-half "seasons".Air Circulation on Kawasaki Days
In both the Japan and California cases, a significant anomalous regional circulation pattern occurs about 10-14 days preceding the beginning of a KD cluster event. This circulation is generally the driver that deploys storms, air masses, and in general, the mix of elements that are involved in producing a given day's weather pattern. More importantly, very similar patterns occur for north and south Japan and for northern and southern California.Also crucial is that these circulation anomalies appear to be placed geographically so as to be able to produce unusual weather patterns over both Japan and California, respectively. The anomalous pattern associated with KD clusters in Japan is a positive pressure anomaly center to the north and west of Japan. This pattern appears to produce an airflow that would introduce cool air into the country. As the pattern progresses there is some evidence that it moves east and the flow becomes more westward and thus would inject more marine air into Japan. The one to two week time scale seems realistic for a KD trigger to occur prior to date of hospitalization. Furthermore, in Japan, the winter and summer patterns are very similar, both in North and South Japan.
|
|
For California, for winter KD events, a significant anomalous weather pattern also arises about 10-14 days in advance of hospitalization, but this pattern is quite different than the pattern seen in Japan. The California pattern has negative 700mb height anomalies to the north and west of the California region, a pattern that would produce anomalous air flow from the southwest and is associated with winter storms, clouds, and usually precipitation. This is the same pattern that was identified earlier in this teams examination of a subset of KD cases taken from San Diego County (southern California) hospitals, and the significant anomaly signature occurs at about the same time scale of about 10-14 days before hospitalization. The summer patterns for California KD cases, however are quite different, with high pressure (positive 700mb height anomalies over the region or to its east, allowing a warm stable air mass aloft and potentially, air flow from the east or north. Interestingly, though, California's Mediterranean climate regime is one that very rarely receives precipitation, so other elements such as clouds, particulates and perhaps fog in areas that have a marine exposure could possibly be involved.
|
|
Conclusions
- There is a marked seasonality in KD that occurs quite consistently over the two regions. Maximum KD occurrence is in late winter-spring and minimal KD is in fall in both California and Japan.
- Anomalous variability exists such that some years have exceptionally high or low KD occurrence. A surprising degree of coherence of KD anomalies appears between the north vs. south parts of Japan, but KD anomalies in northern vs. southern California fail to correlate as strongly, but that may be due to the small sample size.
- Investigation of possible links to weather elements and anomalous components of KD produced some intriguing results--there appears to be a short term weather trigger to KD clusters, but more work is needed to determine if there is a consistent pattern, what mechanism(s) operate, whether or not there is a longer term climate link.
- Reference:
- Diaz, H. F., R. S. Kovats, A. J. McMichael, and N. Nicholls, 2001: Climate and human health linkages on multiple timescales. In History and Climate: Memories of the Future?, P. D. Jones, T. D. Davies, A. E. J. Ogilvie, and K. R. Briffa (eds.), Kluwer Academic/Plenum, New York, 267-289. [Introduction]