Is there a relationship between Climate Variability & Amphibian Declines?
By Mike Alexander and Jon Eischeid
 Over the past 25 years, the numbers of frogs and toads of many species have diminished greatly and a few appear to have
disappeared entirely. Since the early 1970s, declines in amphibian populations have occurred in North and South America,
and Australia. In some locations, clear explanations exist for amphibian declines, such as habitat destruction or
introduction of exotic species. The reasons for many of the amphibian declines, however, are not clear, although
they share common attributes: frogs and toads that live in high elevation streams appear to be the most affected.
It has recently been proposed that a fungus is directly responsible for the amphibian die-offs. Even if this hypothesis
is confirmed, many questions remain. Have environmental factors, such as climate change or pollution, stressed the
amphibians and made them more susceptible to disease or made the fungus more virulent? Is the fungus being transported
to new regions where the amphibians have not been previously exposed?
Over the past 25 years, the numbers of frogs and toads of many species have diminished greatly and a few appear to have
disappeared entirely. Since the early 1970s, declines in amphibian populations have occurred in North and South America,
and Australia. In some locations, clear explanations exist for amphibian declines, such as habitat destruction or
introduction of exotic species. The reasons for many of the amphibian declines, however, are not clear, although
they share common attributes: frogs and toads that live in high elevation streams appear to be the most affected.
It has recently been proposed that a fungus is directly responsible for the amphibian die-offs. Even if this hypothesis
is confirmed, many questions remain. Have environmental factors, such as climate change or pollution, stressed the
amphibians and made them more susceptible to disease or made the fungus more virulent? Is the fungus being transported
to new regions where the amphibians have not been previously exposed?
We explored the relationship between climate and amphibian declines in three regions: Colorado, U.S.A. (range), Costa Rica/Panama, and Queensland, Australia. These regions were chosen because they contain fairly long and reliable weather records and the time and location where amphibians disappeared are fairly well documented. In Colorado, the first major population crash of the boreal toad was first observed in 1974, although a few dead toads were noted in 1973. A second set of declines occurred in the late 1990s in the mountains of northern Colorado: several dead animals were found in Rocky Mountain National Park in 1996, followed by a more pronounced reduction in toad populations at several locations in 1999. Extinctions of local amphibian populations were observed in Central America over the past 15 years, including the complete disappearance of the golden toad in 1987; declines of many other species occurred in 1993-1994.
 |
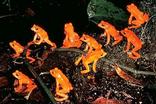 |
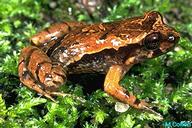
| Northern Tinker | Golden Toad |
There were three widely separated areas of declines along the east coast of Australia, beginning near Brisbane (about 27�S) in 1985 and then progressing northward over the next 10-15 years we focused on northeast Queensland (15�S-20�S), where many local populations have become extinct since 1990, including the mountain mist and northern tinker frogs.
Given the sensitivity of anurans to heat and moisture we examined time series of temperature and precipitation data including the magnitude and duration of anomalies (departure from normal conditions) in these variables during the periods when the anurans declined. The time series were obtained from the National Center for Environmental Prediction reanalysis system and station records. Both data sets represent average conditions over a region approximately 300 km on a side. The level of agreement between the two data sets provides a measure of the reliability of climate signals in regions of amphibian declines.
Temperature and Precipitation
The susceptibility of amphibians to changing climate conditions is uncertain, so several measures of temperature and precipitation variability are shown for Colorado (Fig. 1), Central America (Fig. 2), and Australia (Fig. 3), including: i) monthly values during the four year period around the time of the amphibian declines (top two panels), which can be compared to a measure of the mean seasonal cycle and spread about the mean; ii) monthly temperature and precipitation anomalies (middle two panels); and iii) the annual temperature and precipitation anomalies during the twentieth century (bottom two panels).
| Fig. 1. Temperature and precipitation values from reanalysis and station data in Central Colorado. The median (solid line) and upper (75%) and lower (25%) quartiles (dashed lines, respectively) for (a) temperature and (b) precipitation from reanalysis during the years 1948-99. Also shown in (a) are the individual monthly values for the years 1972-1975. Vertical lines indicate 3-month averages of (c) temperature and (d) precipitation anomalies and the solid line is a smoothed version of this reanalysis data using a 9-point low-pass filter, that emphasizes periods longer than approximately 3 years). The (e) temperature and (f) precipitation anomalies from station data for the period 1900-1999. Anomalies are computed relative to the 1951-1981 period, vertical bars indicate annual anomalies and the solid line is filtered version of the data emphasizing periods longer than about 8 years. In dashed vertical lines in c-f denote the approximate time of the major declines in amphibian populations: 1974 and 1999. |  |
| Fig. 2. Temperature and precipitation data for the Costa Rica/Panama region displayed as in Fig. 1. Data for the years 1992-1994 are shown respectively by open circles, closed circles, squares and triangles in (a) and (b). |  |
| Fig. 3. Temperature and precipitation data for northeast Queensland, Australia displayed as in Fig. 1. Data for the years 1989-1991 are shown respectively by open circles, closed circles, squares and triangles in (a) and (b). The arrow between the long dashed lines in c-f indicates that many species declined or became extinct between 1990 and 1993. |  |
Temperatures were near normal in Colorado when the amphibian declines occurred in the 1970s, whereas in Central America temperatures were warmer than normal, especially during the dry season. The station data from Australia indicated that temperatures were above normal during the period of amphibian declines, but reanalysis did not show such a clear temperature signal. In general, conditions were drier than normal in the years during and just prior to the amphibian declines, in agreement with several other studies. It is possible that amphibians experience greater stress during periods of less rainfall, although unusual anuran behavior was not observed prior to the mass mortalities.
Though declines occurred while the temperature and precipitation anomalies in some of the regions were large and of extended duration, the anomalies were not beyond the range of normal variability. For example, in Central America the positive temperature anomalies that began around 1920 were much greater in magnitude and duration than anomalies in the 1990s. There was also no clear correspondence between the monthly temperature and precipitation anomalies for 1973-1976 and 1996-1999, the two main periods of amphibian die-offs in central Colorado. Thus, unusual climate, as measured by regional estimates of temperature and precipitation, is unlikely to be the direct cause of amphibian declines, but it may have indirectly contributed to them.
Winds and the path of the amphibian declines:
The declines appear to have propagated from northwest to southeast in Central America and from southeast to northwest in Australia. In these two regions, we examined whether or not the apparent path of the declines is consistent with the mean wind direction and changes in the meridional (north-south) component of the wind. Wind may assist in the transport of pathogens or hosts for the pathogens, such as insects. Wind could also transport anthropogenic substances, such as pesticides, which might kill amphibians outright or make them more susceptible to disease. We examined the relationship between the path of the amphibian declines over Central America and the wind using streamlines obtained from the NCEP reanalysis. Streamlines indicate the direction of the wind at a given instant of time; for long-term averages, streamlines tend to coincide with the mean trajectories of individual air parcels. During July-October the path of frog declines is coincident with the mean wind direction (Fig. 4a).
Fig. 4 The (a) long-term mean streamlines over Central America for the months July-October based on reanalysis for the period 1948-1999. (b) Meridional wind anomalies from reanalysis, vertical dashed lines show 3-month average of anomalies, line is smoothed data that emphasizes periods greater than 3 years. |
 |
 |
During other months of the year the mean streamlines extend from the northeast to the southwest across Costa Rica and Panama before curving back towards the east over the Pacific Ocean. In addition, the wind speeds are on the order of a 3-5 m/second, three orders of magnitude faster than the observed propagation rate of frog disappearances in Central America.
We also examined the anomalous meridional (north-south) component of the wind for the Costa Rica/Panama region for all months during 1948-1999. Positive values indicate that the winds were stronger from the south or weaker from the north than normal. From 1985-1997, which encompasses the periods of amphibian declines, the anomalies were primarily negative with maximum values of about 1 m/second (Fig. 4b). Thus, the anomalous winds are from north to south, in the direction of anuran declines.
In Australia the declines appear to have moved from southeast to northwest along the coastal mountain regions of eastern Queensland. The timing of the amphibian declines in Queensland translates to a linear propagation rate of roughly 120-160 km/year. The long-term mean streamlines for the months of May-July (Fig. 5a) are parallel to the path of amphibian declines. In other months the flow is more from east to west towards the interior of the continent, especially from September through February. Wind speeds are on the order of 3-5 m/second along the coast but are weaker in the interior and stronger offshore.
The monthly meridional wind speed anomalies for south, central, and north Queensland (Fig 5b) are fairly well correlated after about 1960. During the period of declines, 1979-1994, there were both positive and negative anomalies. One may speculate that if the propagation was irregular, then the periods of positive anomalies indicative of stronger south-to-north winds in 1982-1985 and 1987-1988 may have contributed to the propagation. However, the anomalous winds were nearly due north rather than along the coast (not shown).
From a climate perspective, the coincidence of the mean wind direction and the path of the amphibian declines indicate the mean winds could have assisted in the transport of a pathogen. However, the fungus responsible for the death of amphibians appears to be a waterborne pathogen and produces spores that dehydrate in air. Thus, the direct transport of the pathogen by the wind seems unlikely. The wind could also carry hosts for the pathogens, or toxic substances that make amphibians more susceptible to infection, but to date there has been no evidence that toxins are involved in the amphibian declines. In addition, the wind is highly variable and not along the path of declines during many months of the year, and the apparent propagation rate of the amphibian declines is much slower than the mean wind speed. So, if winds are involved in the waves of amphibian declines it is likely to be a part of a very complex process.
| Fig. 5 As for Fig. 4, the (a) long-term mean streamlines over eastern Australia for the months May-July from reanalysis. (b) Meridional wind speed anomalies that have been smoothed to emphasize periods longer than about three years, in south, central and north Queensland. | |
 |
 |
- Reference:
- Alexander, M. A., and J. K. Eischeid, 2001: Climate variability in regions of amphibian declines. Conservation Biology, 15, 930-942. [Abstract]