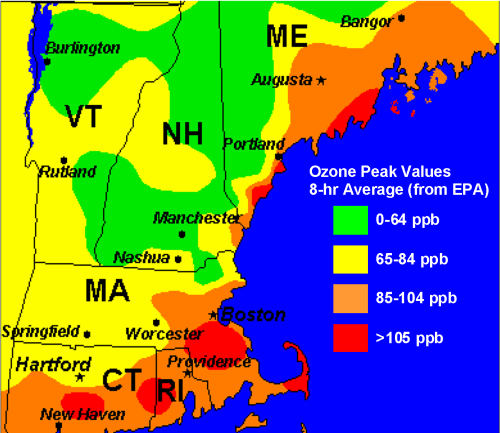
NEAQS: New England Air Quality StudyWhy?New England can experience unhealthy levels of air pollution, especially during the summer months. For example, figure 1 shows a color-coded map of ozone pollution recorded on August 2, 2001. Areas shaded with orange experienced ozone concentrations (measured in parts per billion or ppb) that are considered unhealthy for people with respiratory problems. Areas shaded in red had ozone levels that pose health risks to everyone. Note that on this day the worst ozone pollution occurred in the coastal regions extending from Connecticut into northeastern Maine. This distribution is believed to be caused by long-range transport of pollutants from the East Coast metroplex extending from Washington D.C. to Boston, long-range transport from the industrial Midwest, local pollution from sources along the I-95 corridor, and coastal wind patterns associated with a meteorological phenomenon known as the land-sea breeze circulation. Aside from identifying the sources of pollution and pathways for horizontal transport of pollutants, we must also understand the physical processes that mix and distribute pollution vertically in the atmosphere. To help scientists to understand New England's air quality better, the U.S. Congress funded the New England Air Quality Study. Summer 2004 activities served as a pilot study for a larger study that may occur in 2004. The overarching goal of this program is to gain a better understanding of what causes bad air quality in New England and, ultimately, to improve air quality forecasts. Research at the NOAA Environmental Technology Laboratory focuses on increasing our knowledge of the meteorological processes that control air quality in the Northeast.
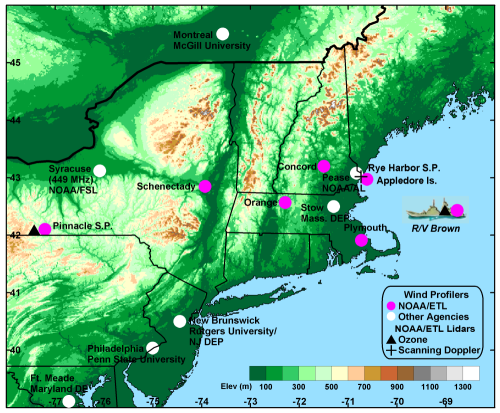
What?ETL (know part of PSL) deployed a suite of sophisticated instruments to measure meteorological and air chemistry profiles above land and at sea. By LandA scanning Doppler lidar was situated at Rye Harbor State Park on the coast of New Hampshire. This instrument provided detailed measurements of the sea breeze circulation. An integrated wind profiling observing system was deployed at the Shoals Marine Laboratory on Appledore Island. This system provided wind and temperature measurements from the surface to 2-4 km above the surface for winds and 0.5-1.5 km above the surface for temperature, depending on atmospheric conditions. These wind and temperature profiles observed maritime conditions offshore from the lidar at Rye Harbor. By SeaOn the NOAA research vessel Ron Brown, ETL deployed a vertically pointing ozone lidar, a 915-MHz Doppler wind profiler, and a GPS rawinsonde system. The lidar provides ozone and aerosol backscatter intensity profiles from 200 to 2000 m above the surface. The wind profiler provides maritime wind conditions on a continuous basis over the same altitude range as the lidar. Together, these instruments assisted scientists in determining the best course for the ship to follow in order to meet specific scientific objectives. Standard meteorological soundings were taken with the rawinsonde system to help characterize the marine boundary layer. These soundings provided initial conditions over the data sparse Atlantic for numerical modeling studies conducted after the experiment. The locations of instrumentation deployed for NEAQS and a sister project, the New England Temperature and Air Quality Pilot Study, are shown in the map. ResultsScientists will use the datasets collected during the Summer 2004 to quantify numerical model performance as a function of the physical parameterizations contained in the models. The ultimate goal of this work is to improve the meteorological models used for air quality and temperature forecasting. |