New tool effectively identifies both rapid-onset and sustained droughts
A new experimental drought warning product has the potential to become a leading indicator of both rapidly evolving 'flash' droughts (developing over a few weeks) and sustained droughts (developing over months but lasting up to years) for agricultural and hydrological communities. The Evaporative Demand Drought Index (EDDI) has also proven to be just as good—if not better—than other drought indices at providing early drought warnings.
What sets EDDI apart is that it takes into account the strong physical relationship between two factors: 1) evaporative demand—the "thirst of the atmosphere," estimated to be the amount of water that would evaporate from the soil and be given off as water vapor (transpired) by plants if the soil were well watered—and, 2) the actual loss of available moisture from the land surface through evapotranspiration—the sum of plant transpiration and evaporation from the Earth's land and ocean surface to the atmosphere.
EDDI measures the signal of drought by using daily atmospheric conditions and estimating their impact on land-surface moisture and vice versa.
"The idea for EDDI occurred while I was making maps of evaporative demand," said Mike Hobbins, a CIRES researcher with NOAA ESRL’s Physical Sciences Division. "I noticed that with that information, I could pick out the droughts."
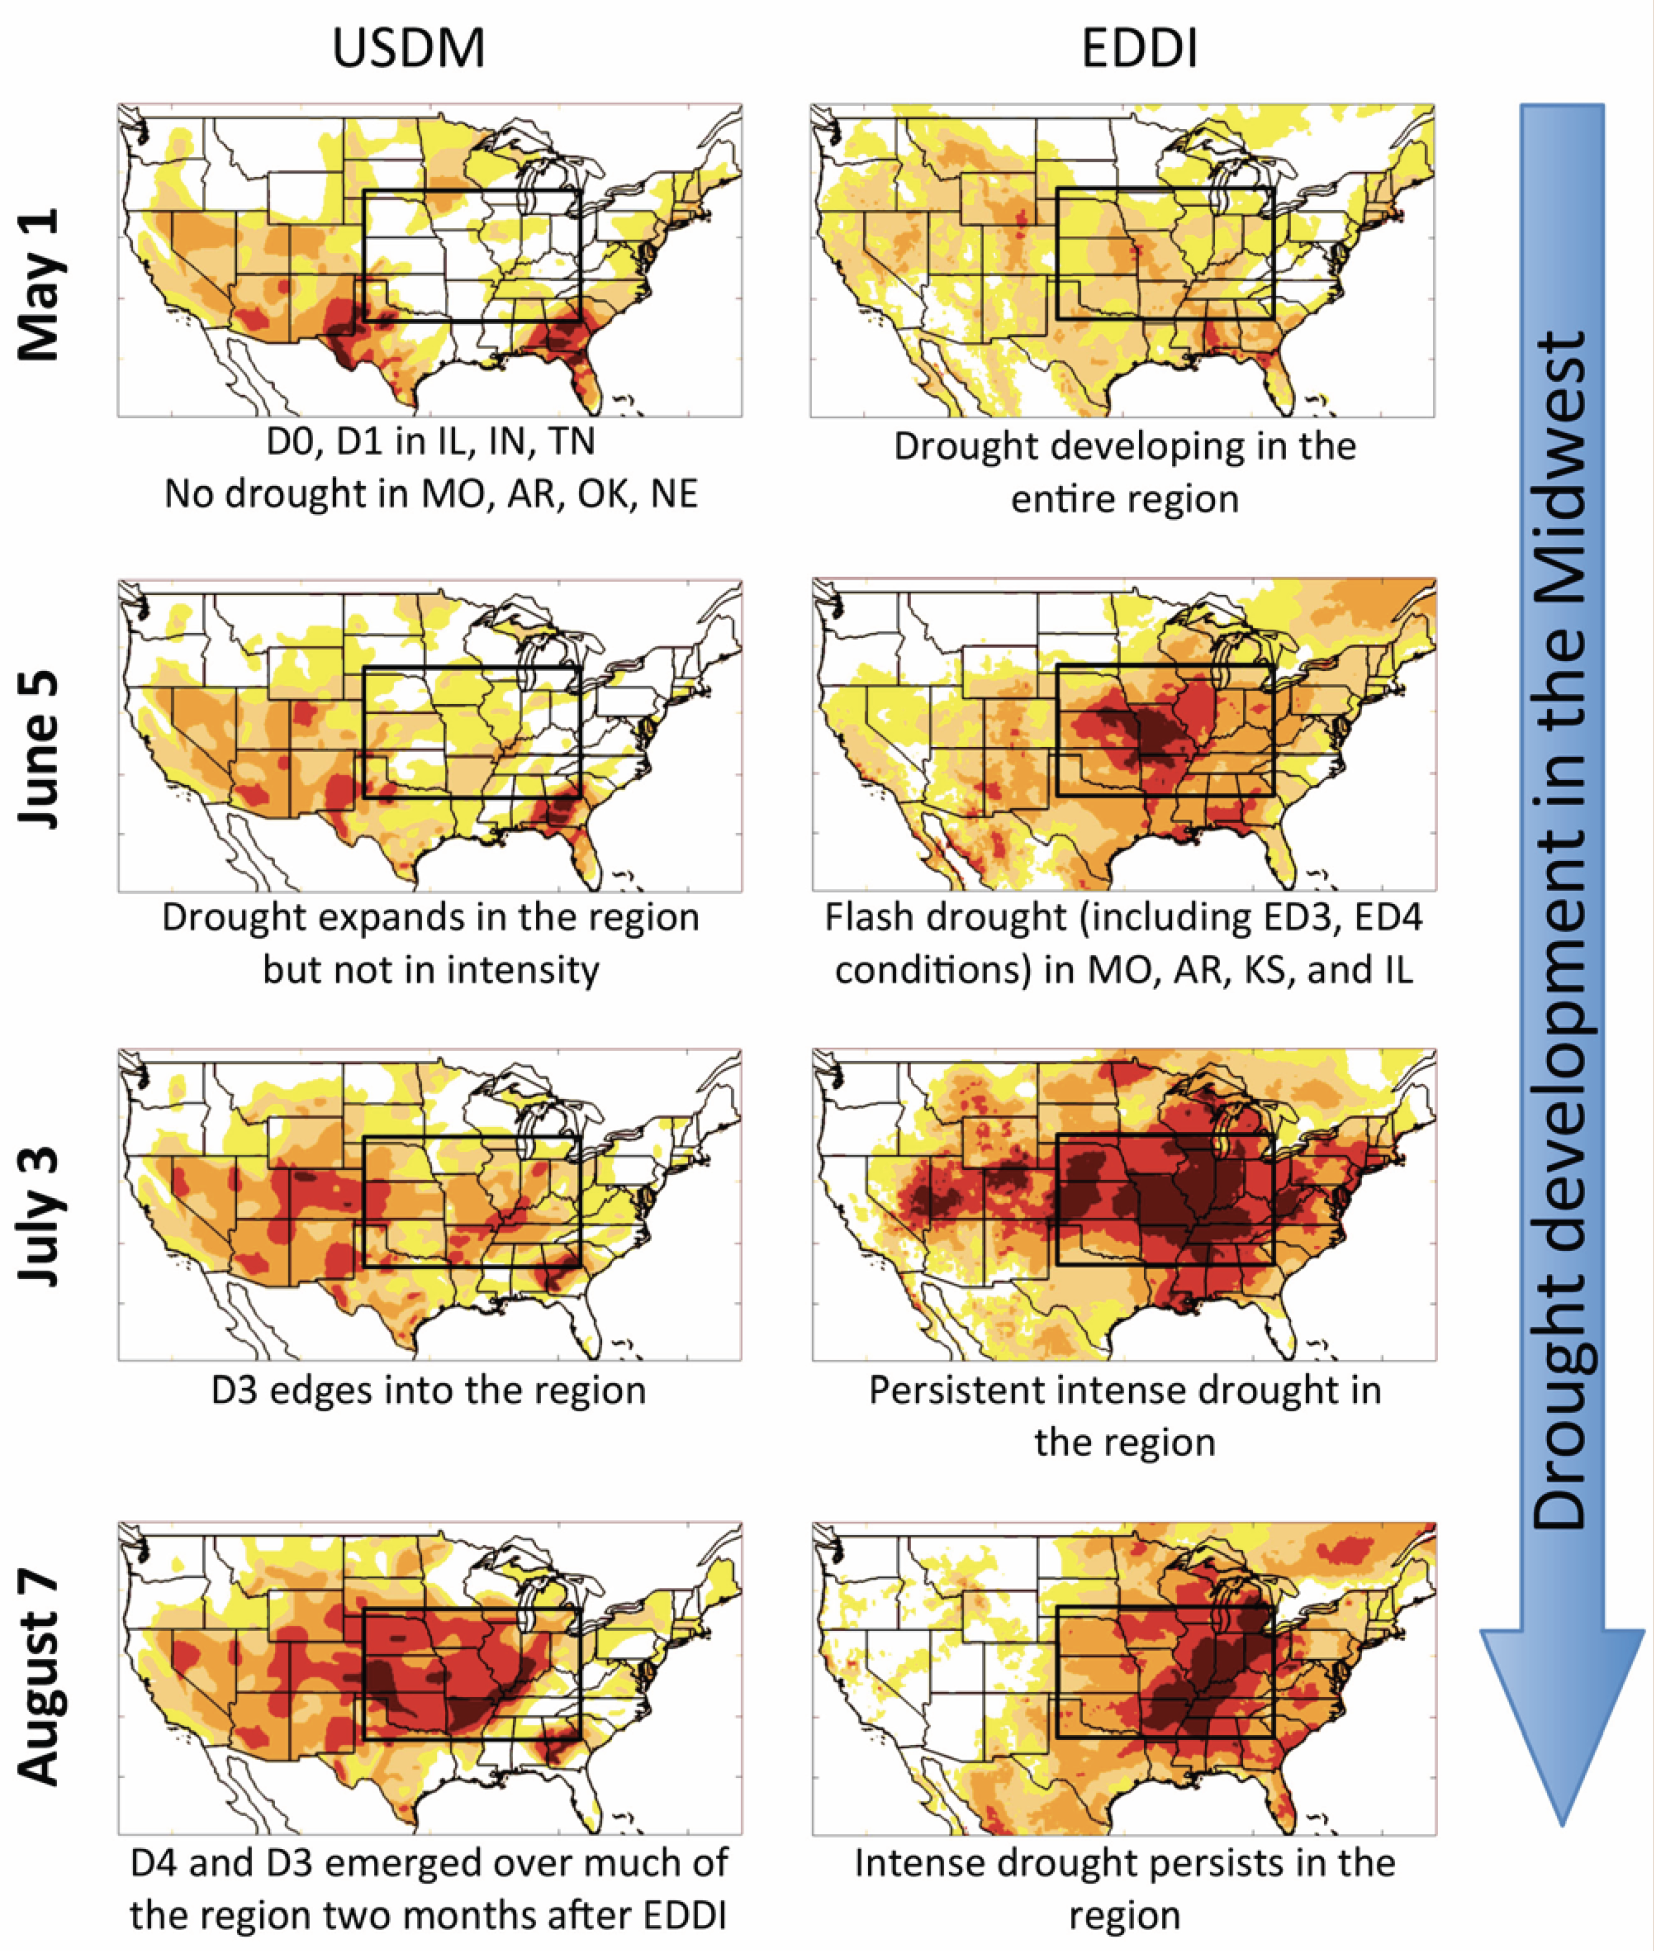
In a pair of complementary articles published in the June issue of the Journal of Hydrometeorology, Hobbins and his colleagues first present the physical basis and utility of EDDI. Next, they present a study of its use at multiple timescales for several hydroclimates across the continental United States, and compare it to other commonly used drought indices—the Standardized Precipitation Index (SPI), the Standardized Soil Moisture Index (SSI), and the Evaporative Stress Index (ESI)—and the U.S. Drought Monitor (USDM), which combines numerous drought indicators with local expert knowledge to provide a national drought map.
Most drought monitoring tools focus solely on the supply side of moisture imbalance, using climate variables such as precipitation, soil moisture, and air temperature. EDDI uses air temperature data, but not precipitation and soil moisture—which are not always available or reliable. In addition, it incorporates other climatic factors, including solar radiation, winds, and humidity, which are also important drivers in the depletion of soil moisture and in the evolution and persistence of drought. From this atmospheric data, Hobbins creates a historical dataset from 1980 onward across the continental US. This is then used to compare incoming data that reflect current or ongoing conditions.
EDDI's effectiveness in reflecting the moisture conditions on the land surface is based on feedbacks between the atmosphere and land that are particularly strong during the warm season, when drought is of greatest concern.
"The dryness at the surface affects the dryness of the air," said Hobbins. "There is a quick feedback."
Another advantage of EDDI is that its calculation is not sensitive to land-surface type, so it is a valid drought indicator for all regions.
So how did EDDI compare to the other drought indicators in the study? Overall, EDDI identified drought consistently with most of the other indices. For flash droughts in particular, EDDI predicted the development and onset of drought up to two months ahead of the USDM, and often led both the SPI and the SSI. And although it works without precipitation information, EDDI was still able to capture long-term hydrologic and snow drought in the Western U.S.
"These results are promising," said Hobbins. "They allow us to think that we are approaching the brass ring of drought monitoring—effective prediction of drought—but we need to examine EDDI's performance in an ongoing monitoring setting, which is what is being done now in concert with our stakeholders across the continental US."
Hobbins is currently responsible for generating and distributing the drought warning tool to stakeholders who have requested the information for their region. However, EDDI will soon become available online through drought.gov, and plans are in the works for it to be permanently hosted by NOAA's National Water Center within the next few years.
What's next?
A number of improvements are ongoing or planned for EDDI, such as testing the tool by feedback from early users and then changing the system in response; expanding the user-base to a national basis; examining EDDI as a predictor of wildfire risk; attributing changes in evaporative demand (or of drought) to changes on each of the drivers (wind, air temperature, humidity, solar radiation); working with the Famine Early Warning System Network to expand the tool from the continental US to a global basis; and seasonal forecasting of the evaporative demand that underlies EDDI, which could potentially allow forecasts of drought.
Research Partners:
NOAA, University of Colorado-CIRES, Desert Research Institute, National Center for Atmospheric Research, US Geological Survey, US Department of Agriculture, and the University of Maryland.
The Journal of Hydrometeorology Articles:
Michael Hobbins, Andrew Wood, Daniel McEvoy, Justin Huntington, Charles Morton, James Verdin, Martha Anderson, and Christopher Hain (June 2016): The Evaporative Demand Drought index: Part I – Linking Drought Evolution to Variations in Evaporative Demand. J. Hydrometeor., 17(6),1745-1761. doi:10.1175/JHM-D-15-0121.1
Daniel J. McEvoy, Justin L. Huntington, Michael T. Hobbins, Andrew Wood, Charles Morton, James Verdin, Martha Anderson, and Christopher Hain (June 2016) The Evaporative Demand Drought index: Part II – CONUS-wide Assessment Against Common Drought Indicators. J. Hydrometeor., 17(6), 1763-1779. doi:10.1175/JHM-D-15-0121.1
Posted: July 20, 2016