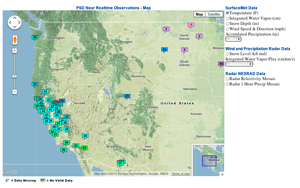
Example of the new Google Maps display (click image for more detail)
|
|
Contact: Allen White
|
PSL Real-Time Data Now Viewable Using Google Maps
January 16, 2012
Real-time data collected by the Physical Sciences Laboratory's Water Cycle Branch for the Hydrometeorology Testbed (HMT) and other field experiments is now viewable utilizing Google Maps. This display mimics the type of observational displays used by National Weather Service field offices. Not all datasets are available in this version of the display tool. Currently the following near real-time, surface meteorology measurements are available: temperature, integrated water vapor, snow depth, wind speed, wind direction, and accumulated precipitation for the past 1-, 3-, 6-, 12-, or 24-hour periods. In addition, the following remotely sensed data products are available: snow level, integrated water vapor flux, NEXRAD reflectivity mosaic and NEXRAD 1-hour precipitation mosaic. Time series displays of these and other HMT datasets, excluding the NEXRAD products, are available, as in the past, through the product availability table. A similar Google Maps display tool is now available to view instrument inventories, and to see where different types of PSL instruments have been deployed for field projects.