ENRR
El Niño Rapid Response Field Campaign
ENRR Data Portal
ENRR Data Overview
Additions
|
NOAA G-IV Aircraft |
|||||||
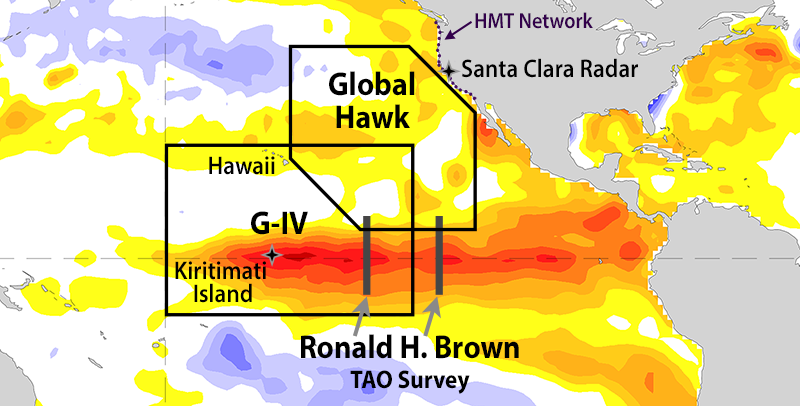
The NOAA G-IV aircraft flew out of Honolulu, Hawaii and carried a suite of meteorological sensors and deployed dropsondes for 22 research flights from mid January to mid March 2016. |
|
Dropsondes [GET]Dates:20160121 – 20160310 (22 missions)Times:Multiple sondes per flight.Spatial Coverage:areal extent: 180W-120W; 1S-38N (map of flight paths)VariablesTemperature(C), wind speed(m/s),wind direction(deg),u-wind(m/s),v-wind(m/s),RH(%), w(m/s),altitude(m), pressure(mb).Instrument:Vaisala RS-92Format:FRD ASCII files.Data Issues:05/04/2017: 11 sondes have been added. See the README in the download directory for details. See Data has been quality controlled. Original (uncorrected) data has a dry bias in the reported humidity that becomes large for temperatures below -10C which was due to a software error (see UCAR technical note). A corrected version of the data is now available (see correction caveat).Citation:Data obtained from NOAA/ESRL PSL from their website https://psl.noaa.gov/enso/rapid_response/data_pub/. Accessed on yyyy mm dd. Please also cite the Dole et. al. publication: Dole et al, Dec 2017: Advancing Science and Services during the 2015-16 El Niño: The NOAA El Nin˜o Rapid Response Field Campaign. Bull. Amer. Meteor. Soc., ONLINE, doi:10.1175/BAMS-D-16-0219.1. Contacts:psl.data@noaa.govISO metadata:Coming Soon! |
Tail Doppler Radar [GET]TYPE:(Raw) See HRD docDates:20160121- 20160310Times:ContinuousSpatial Coverage:areal extent: 180W-120W; 1S-38N (map of flight paths)VariablesWindsInstrument:Tail Doppler RadarFormat:IRIS format (see HRD Doc)Radar operating mode:PPI scan with elevation angle of approximately +/-20 degrees off nadir to form conical scans looking forward and backward.Data Issues:Data is in "raw" format and has not been processed or QC'd.Citation:Please cite ESRL/PSL if using this data as the source let us know if you are using this data in your research.Contacts:psl.data@noaa.govISO metadata:Coming Soon! |
Kiritimati Island |
||||||||
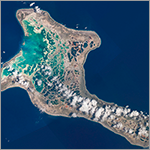
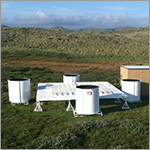
On Kiritimati (Christmas) Island, approximately 1,340 miles south of Honolulu, a radiosonde system was used to collect vertical soundings of the atmosphere twice a day from late January through March 2016. |
|
Radiosonde [GET]Type:Atmospheric soundingsDates:20160126-20160327Times:Twice daily launches, near 0z & 12z.Spatial Coverage:Point: 2.01N, 157.40WVariablesPressure, geopotential height, temperature, dewpoint, relative humidity, winds, latitude, longitude, altitude.Instrument:Vaisala RS92-SGP radiosondes.Format:NASA-Ames format ASCII files (format description).Data Issues:Data have been reprocessed using corrected surface observations as initial conditions. "Level 2" data have also been subject to automatic, objective quality control checks; more details are given in the file headers. More extensive quality control will be performed in the near future, with "Level 3" and "Level 4" data expected to be released in the first half of 2017.DOI:10.7289/V55Q4T5K.Citation:Contacts:psl.data@noaa.gov, Leslie.M.Hartten@noaa.govISO metadata:at NCEI/NOAA. |
Surface Meteorology [GET]Dates:20160125-20160328Times:Every 2 minutes through 2016-02-11 04:05:43, then every 1 minuteSpatial Coverage:Point: 2.01N, 157.40WVariablesPressure, temperature, relative humidity, winds, precipitation.Instruments:Vaisala PTB101B barometer, Vaisala HMP45C temperature and relative humidity probe, R.M. Young 5103 anemometer, Texas Electronics TE525 tipping bucket.Format:NASA-Ames format ASCII files (format description).Data Issues:Data have been corrected for known measurement issues when possible and replaced with bad/missing flags when that was not possible, and have been visually screened for physically unreasonable values. See the metadata in the file header for basic details and contact information.Citation:Please cite ESRL/PSL if using this data as the source and let us know if you are using this data in your research. A dataset DOI is in process, please email contact(s) to get the latest information. Journal articles documenting the dataset are in process, please email contact(s) to get the latest information.DOI:10.7289/V51Z42H4.Contacts:psl.data@noaa.gov, Leslie.M.Hartten@noaa.govISO metadata:at NCEI/NOAA. |
NOAA Ship Ronald H. Brown |
||||||||||
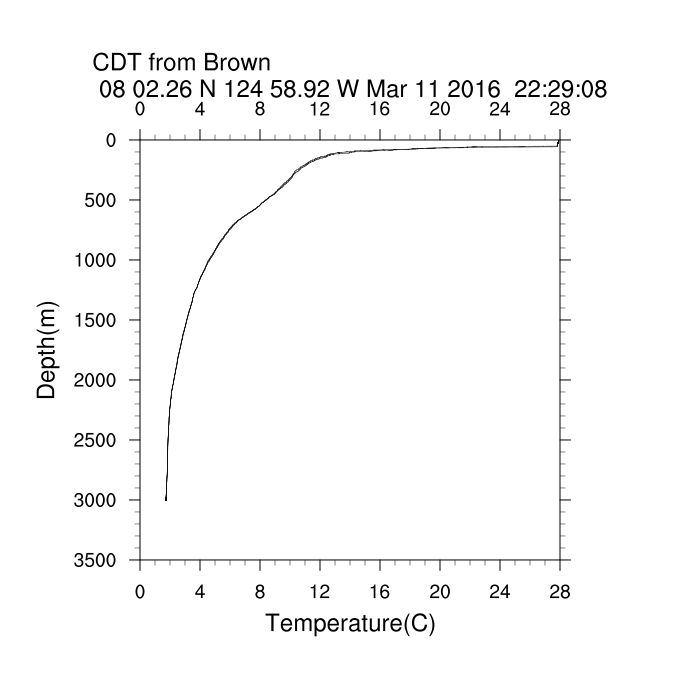
Scientists aboard the NOAA Ship Ronald H. Brown launched radiosondes up to 8 times per day during the Tropical Atmosphere Ocean (TAO) survey cruise along 140°W and 125°W from February 16 to March 18, 2016. |
|
Radiosonde [GET]Type:Atmospheric soundings.Dates:20160216-20160316Times:Generally 8 per day along TAO buoy transects, 4-6 per day elsewhere.Spatial Coverage:Cruise was in box 8S-28.4N; 158W-119W.Variables:Pressure, geopotential height, temperature, dewpoint, relative humidity, winds, latitude, longitude, altitude.Instrument:Vaisala RS92-SGP radiosondes.Format:NASA-Ames format ASCII files (format description).Data Issues:Data have been reprocessed using corrected surface observations as initial conditions. "Level 2" data have also been subject to automatic, objective quality control checks; more details are given in the file headers. More extensive quality control will be performed in the near future, with "Level 3" and "Level 4" data expected to be released in the first half of 2017.Citation:If obtained from PSL's website cite as: Cite as: Cox, C.; Wolfe, D.; Hartten, L.; Johnston, P. (2017). El Ni�o Rapid Response (ENRR) Field Campaign: Radiosonde Data (Level 2) from the NOAA Ship Ronald H. Brown, February-March 2016. Version N. Dataset obtained at NOAA/ESRL PSL's website http://psl.noaa.gov/enso/rapid_response/data_pub/. doi10.7289/V5X63K15: [access date] DOI:10.7289/V5X63K15.Contacts:psl.data@noaa.gov, Christopher.J.Cox@noaa.govISO metadata:From NOAA/NCEI. |
Surface Meteorology [GET]Dates:20160216-20160316Times:Every 1 minute.Spatial Coverage:Cruise was in box 8S-28.4N; 158W-119W.VariablesPressure, temperature, relative humidity, winds, sea surface temperature, downwelling shortwave radiation, latitude, longitude, ship course over ground, ship heading, ship speed over ground.Instruments:Vaisala PTB330 barometer, Rotronic MP101A humidity and temperature probe, Vaisala WMT700 ultrasonic anemometers, SBE 45 MicroTSG Thermosalinograph, Eppley PSP pyranometerFormat:NASA-Ames format ASCII files (format description).Data Issues:Data have been been corrected for known measurement issues when possible and replaced with bad/missing flags when that was not possible, and have been visually screened for physically unreasonable values. See the metadata in the file header for basic details and contact information.Citation:Please cite ESRL/PSL if using this data as the source let us know if you are using this data in your research. A dataset DOI is in process, please email contact(s) to get the latest information. A dataset DOI is in process, please email contact(s) to get the latest information. Journal articles documenting the dataset are in process, please email contact(s) to get the latest information.DOI:10.7289/V5SF2T80.Contacts:psl.data@noaa.gov, Christopher.J.Cox@noaa.govISO metadata:From NOAA/NCEI. |
Conductivity, temperature, and depth (CTD) ocean sonde data [GET]Dates:20160221-20160311Times:Irregular.Spatial Coverage:Along track. in box 0-9N. 140.25W-124.20W. 33 launched.VariablesPressure, temperature, salinity, conductivity, sound velocity,depth.Instruments:Sea-Bird SBE 911plusFormat:Sea-Bird output.(Sea-bird website).Data Issues:noneCitation:If obtained from PSL's web-site Cite as: Hartten, L.; Johnston, P.; Cox, C.; Wolfe, D. (2017). El Niño Rapid Response (ENRR) Field Campaign: Surface Meteorological Data from Kiritimati Island, January-March 2016 . Version NN. Dataset obtained at NOAA/ESRL PSL's website http://psl.noaa.gov/enso/rapid_response/data_pub/. doi:10.7289/V51Z42H4 [access date] |
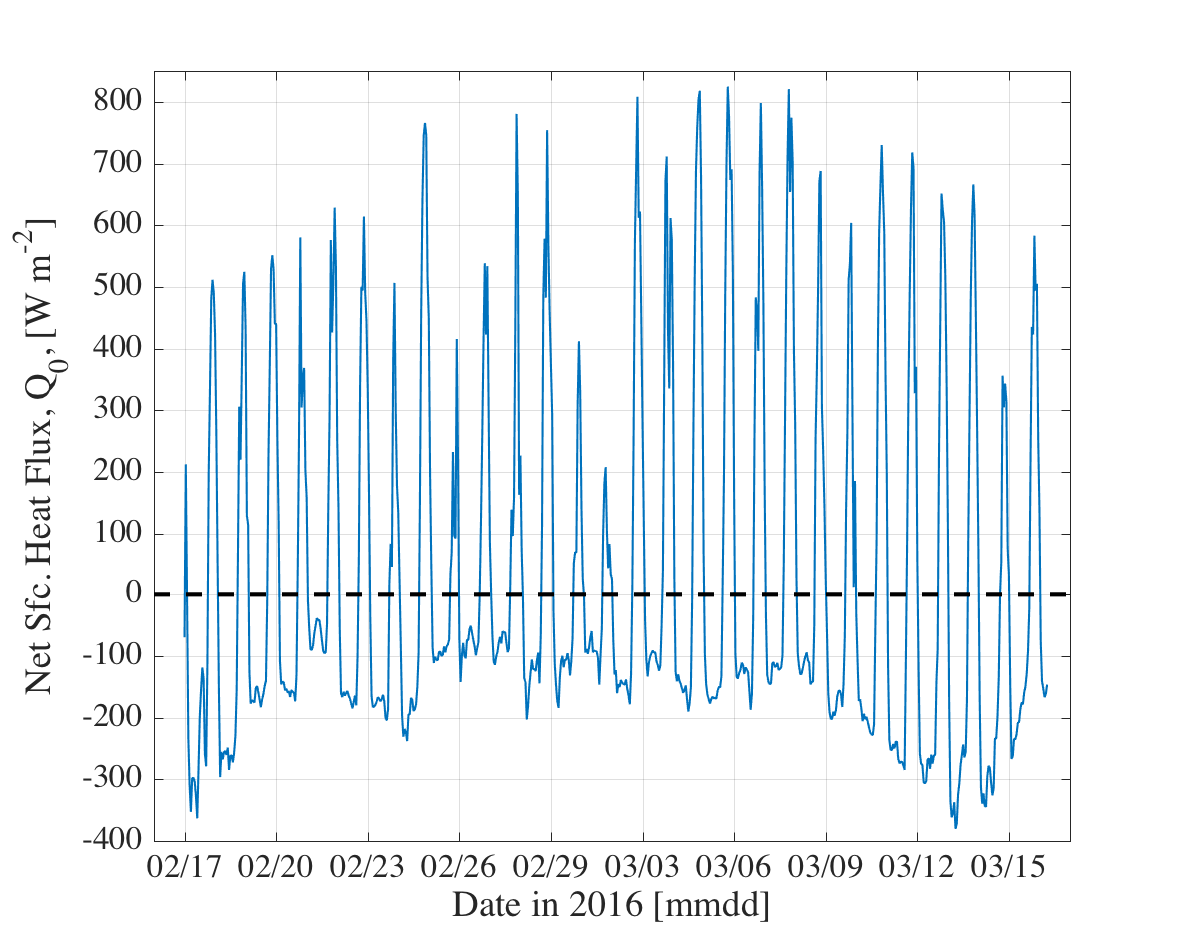
Surface Flux Measurements (processed) [GET]Dates:20160216-20160317Times:Every 1 hour.Spatial Coverage:Cruise was in box 8S-28.4N; 158W-119W.VariablesCloud area fraction, downwelling_longwave_flux_in_air_assuming_clear_sky, downwelling_longwave_flux_in_air, surface_upwelling_longwave_flux_in_air, downwelling_shortwave_flux_in_air, surface_upwelling_shortwave_flux_in_air, surface_upward_latent_heat_flux, surface_upward_sensible_heat_flux, Bulk buoyancy flux into ocean, Friction velocity, Wind stress, Temperature scaling parameter, Specific humidity scaling parameter, Thermal roughness length, Moisture roughness length, Wind stress transfer coefficient at height=zu, Sensible heat transfer coefficient at height=zu, Heat Latent transfer coefficient at height=zu, Obukhov length scale, Monin-Obukhov stability parameter, 10m wind_speed, 10m air temperature, 10m specific humidity, 10m relative humidity, Neutral value of wind speed at height=zu, Neutral value of 10m wind speed, Neutral value of 10m drag coefficient, Neutral value of 10m Stanton number, Neutral value of 10m Dalton number, Sea surface temperature, Cool-skin temperature depression, Surface saturation specific humidity, Latent heat of vaporization, Evaporation rate.Instruments:Format:NASA-Ames format ASCII files (format description).Data Issues:Hourly values, many from the coare35vnWarm version of the COARE flux algorithm, some from the RRTMv3.3 algorithm. See the metadata in the file header for basic details and contact information.Citation:DOI in progress. Please email contact(s) to get latest information, and use the following on a temporary basis: Cox, C. J., and L. M. Hartten, 2017: El Nino Rapid Response (ENRR) Field Campaign: Surface Flux Data from the NOAA Ship Ronald H. Brown, February-March 2016. location and date of accession OR doi.DOI:in progressContacts:christopher.j.cox@noaa.gov, psl.data@noaa.govIso Metadata:In progress |
Ocean Measurements (standard) [GET]Dates:20160216-20160317Times:Every 1 minute.Spatial Coverage:Cruise was in box 8S-28.4N; 158W-119W.VariablesAir temperature, barometric pressure, conductivity, hydrostatic pressure, precipitation amount, precipitation, relative humidity, salinity, shortwave radiation - reflected, sound velocity, water temperature, wind direction, wind speed, water depthInstruments:Thermosalinograph (TSG),Acoustic Doppler Current Profiler (ADCP),Multibeam Mapping, CTD, Argo Floats, drifter buoys.Format:VariesData Issues:None known.Citation:Please cite NOAA if using this data as the source. See metadata link.DOI:unknown. Accession number is 155888.Contacts:NODC.DataOfficer@noaa.govData page:From NOAA/NCEI.Iso Metadata:From NOAA/NCEI. ' |
Global Hawk |
|||||||
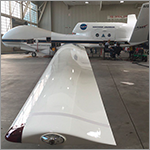
The Sensing Hazards with Operational Unmanned Technology (SHOUT) project led by the NOAA Unmanned Aircraft System (UAS) Program, deployed the NASA Global Hawk UAS carrying a suite of meteorological sensors and deploying dropsondes during three research flights in February. Read more about the dropsonde system...
|
|
Dropsondes [GET]Dates:20160212, 20160215, and 20160221.Times:Multiple sondes during each flightSpatial Coverage:Flight pathInstrument:Vaisala RS-92, NRD94Format:EOL (Earth Observation Laboratory) ASCII files.Data Issues:Data has been quality controlled. Original (uncorrected) data has a dry bias in the reported humidity that becomes large for temperatures below -10C which was due to a software error (see UCAR technical note). The bias has been corrected (see correction caveat). Both versions of the data are availableDOI:https://doi.org/10.5065/D6SQ8XST.Data Documentation page:UCAR EOL Data pageCitation:When referencing the NCAR Airborne Vertical Atmospheric Profiling System (AVAPS) in publications or proposals, please use the identifier 10.5065/D6SQ8XST -- for example as a citation:UCAR/NCAR - Earth Observing Laboratory. (1993). NCAR Airborne Vertical Atmospheric Profiling System (AVAPS). UCAR/NCAR - Earth Observing Laboratory. https://doi.org/10.5065/D6SQ8XST retrieved on date month, day year. Please also acknowledge the NOAA SHOUT project for collecting the observation. Contacts:psl.data@noaa.govISO metadata:ISO 211 metadata from UCAR |
Ozone [GET]Dates:20160212, 20160215, and 20160221.Times:continuousSpatial Coverage:Flight pathInstrument:UV absorption instrument for measurement of ozone.Format:NASA's ICARTT V1.1 format.Units:Ozone volumetric mixing ratio reported in parts per billion (ppbv). 2 Hz data. time is UTC_s, seconds since midnight on flight start day.Data Issues:Data available for use; contact PI for more information if desired.Citation:Please cite ESRL/CSD if using this data as the source let us know if you are using this data in your research.Contacts:Address: Troy Thornberry, 325 Broadway R/CSD6, Boulder, CO 80305; e-mail: troy.thornberry@noaa.gov; phone: 303-497-3373. For issues with link: psl.data@noaa.gov .ISO metadata:Coming Soon! |
High Altitude MMIC Sounding Radiometer (HAMSR) [GET]Dates:20160212, 20160215, and 20160221.Times:1 secSpatial Coverage:Flight pathInstrument:High Altitude MMIC Sounding Radiometer (HAMSR) is a 25 channel cross-track scanning microwave sounder with channels near the 60 and 118 GHz oxygen lines and the 183 GHz water vapor line.Variables:Precipitable Water Vapor(cm), Integrated Cloud Liquid water(mm),Vertical Air Temperature profile(K),Vertical Absolute Humidity (g/m**3),Vertical Relative Humidity profile(%),Profile Pressure Levels(mb),Derived Reflectivity Profile(dBz), Height of Reflectivity Levels(m), Rain Flag(/), Pixel Latitude, Pixel Longitude, Altitude(m) , Brightness Temperature(K) , Pixel Incidence Angle , Airplane Latitude, Airplane Longitude ,Airplane Roll, Airplane Pitch,Airplane Heading, time(s)Format:netCDF. See the documentation for the netCDF variables and attributes.Project Page:Sensing Hazards with Operational Unmanned Technology (SHOUT)Data Issues:NoneCitation:Use reference.References:Brown, S. T.; Lambrigtsen, B.; Denning, R. F.; Gaier, T.; Kangaslahti, P.; Lim, B. H.; Tanabe, J. M.; Tanner, A. B.; , "The High-Altitude MMIC Sounding Radiometer for the Global Hawk Unmanned Aerial Vehicle: Instrument Description and Performance," IEEE Transactions on Geoscience and Remote Sensing,; doi: 10.1109/TGRS.2011.2125973 Contacts:Shannon Brown and Bjorn Lambrigtsen, Jet Propulsion Laboratory, California Institute of Technology; email: Shannon.T.Brown@jpl.nasa.gov .ISO metadata:Coming Soon! |
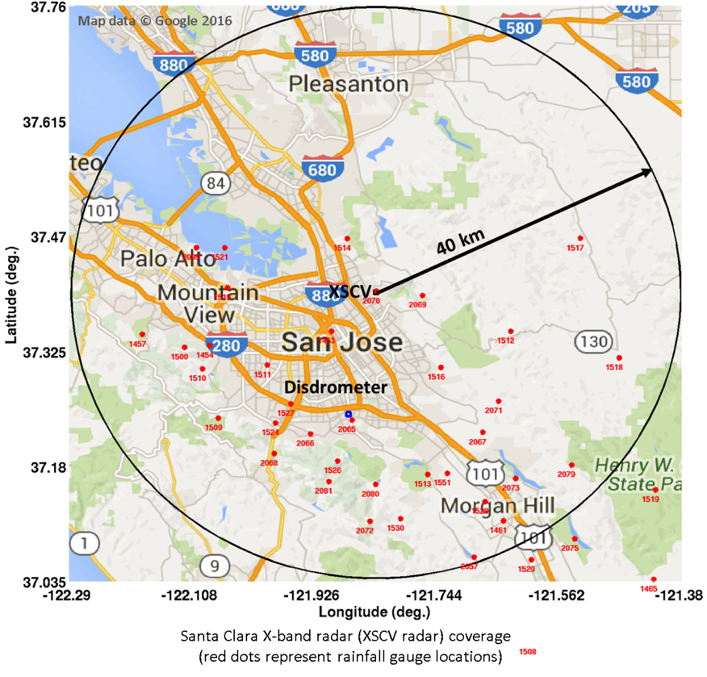
Santa Clara X-band Radar |
|||||||
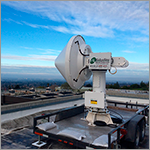
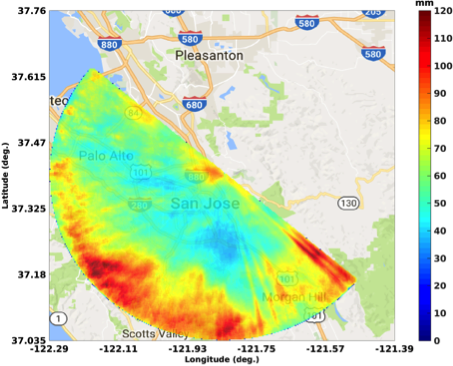
Owned and operated by NOAA's Cooperative Institute for Research in the Atmosphere, the X-Band observed skies over Santa Clara, California through the end of April. It will augment NEXRAD, a network of 160 Doppler weather radars operated by the National Weather Service in the Bay area. Its purpose is to determine how rainfall estimates and short-term predictions can be improved. |
|
X-Band RadarData Access:Please contact V. Chandrasekar (chandra@engr.colostate.edu) for permission to access data."Dates:February – May 2016 (a couple of precipitation events)Times:Two (2° and 3° elevation) sweeps every 90 seconds.Spatial Coverage:circle with a radius of 40 km, centered at (37.39888N, -121.83340W) (see coverage map)Instrument:X-band dual-polarization radar.Format:NetCDF (see netCDF format description)Variables:Includes reflectivity, velocity, coherent power, and Rain rate. See complete list: netCDF file attributes.Data Issues:Data includes radar measured reflectivity, radial velocity, spectral width, differential reflectivity, differential phase, correlation coefficient, and signal-to-noise ratio. An attenuation corrected version of reflectivity and differential Reflectivity is also available. The specific differential phase, as well as estimated instantaneous rainfall rates are also archived in this dataset.Citation:Please cite the Santa Clara Water District. Also please cite this publicationCifelli, R., V. Chandrasekar, H. Chen, and L. E. Johnson, 2017: High Resolution Radar Quantitative Precipitation Estimation in the San Francisco Bay Area: Rainfall Monitoring for the Urban Environment. Journal of the Meteorological Society of Japan. (under review) Contacts:Rob.Cifelli@noaa.gov, chandra@engr.colostate.eduISO metadata:Coming Soon! |
Auxiliary Data and Information |
||
Datasets listed on this page were not created exclusively for ENRR but are useful for the project. They may supply information relating to ENSO impacts or they may be located in the ENRR region. |
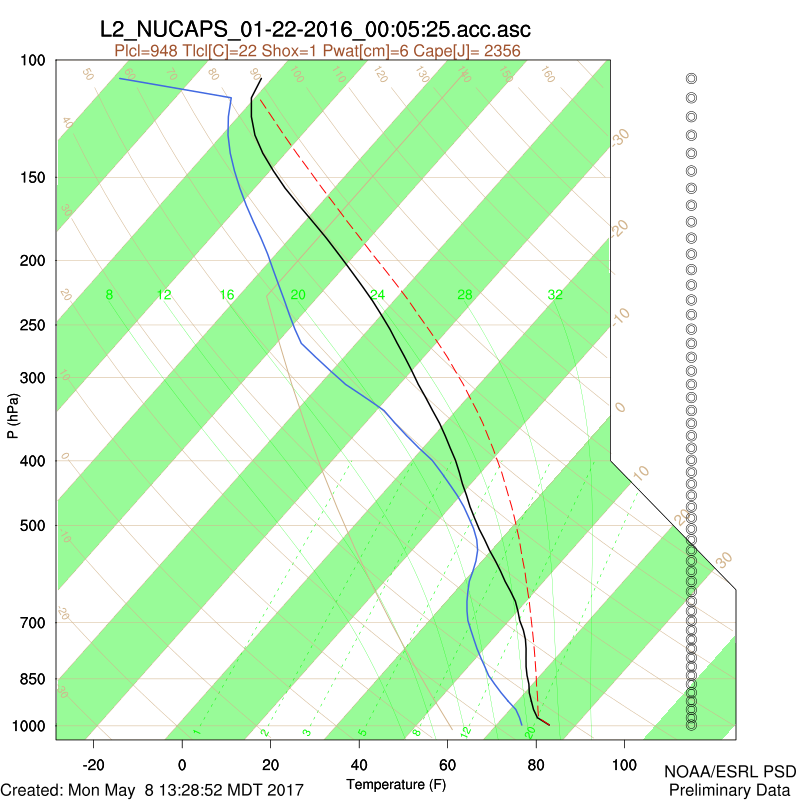
Satellite Retrievals [GET]Temperature and moisture retrievals from NESDIS. Retrievals are created using Cross-Track Infrared Sounder (CrIS) and Advanced Technology Microwave Sounder (ATMS) instruments on the Suomi NPP satellite. These are available for times/locations that closly match the G-IV dropsondes. Dates:20160121 – 20160310 (matching the G-IV flight days)Spatial Coverage:areal extent: 180W-120W; 1S-38N (map of flight paths)Variables:Skin temperature, vertical Temperature profiles, saturation specific humidity,relative humidity,dewpoint, CO2, CO, CH4, N2O, and HNO3.FORMATASCII FilesCitationGambacorta A. (2013), The NOAA Unique CrIS ATMS Processing System, (NUCAPS) Algorithm Theoretical Basis (ATBD).Gambacorta, A., C. Barnet, and M. Goldberg, Status of the NOAA Unique CrIS/ATMS Processing System (NUCAPS), 2015: Algorithm development and lessons learned from recent field campaigns, in Proceedings of ITSC-20, International TOVS Working Group (ITWG), Lake Geneva, Wisconsin, USA. Nalli, N.R., C.D. Barnet, A. Reale, D. Tobin, A. Gabacorta, E.S. Maddy, E. Joseph, B. Sun, L. Borg, A.K. Mollner, V.R. Morris, X. Liu, M. Divakarala, P.J. Minnett, R.O. Knuteson, T.S. King and W.W. Wolf, 2013: Validation of satellite sounder environmental data records: Application to the Cross-track Infrared Microwave Sounder Suite, J. Geophys. Res. Atmos., 118, 13,628–13,643, doi:10.1002/2013JD020436. Contactspsl.data@noaa.govISO MetadataComing SoonCodeSample NCL code to read/plot single drop files.Notes
|
C-130 Aircraft Data [GET]In coordination with the ENNR field campaign , the 53rd Weather Reconnaissance Squadron flew six C-130 flights for a study led by the Scripps Institution of Oceanography to examine atmospheric rivers events associated with heavy precipitation along the US west coast. Three of the flights were flown from Hickam AFB in HI and three from the west coast if the US. A total of 280 dropsindes were available from the 6 missions. Data is available from the PSL web site Data is in FRD format. There is a dry bias corrected version (see UCAR technical note). To cite: When referencing the NSF/NCAR Hercules C130 Aircraft in publications or proposals, please use the identifier 10.5065/D6WM1BG0 -- for example as a citation: UCAR/NCAR - Earth Observing Laboratory. (1994). NSF/NCAR Hercules C130 Aircraft. UCAR/NCAR - Earth Observing Laboratory. https://doi.org/10.5065/D6WM1BG0 Retrieved December 20, 2016 from NOAA/ESRL PSL from their website https://psl.noaa.gov/enso/rapid_response/data_pub/. |
HMT-WestThe HMT-West program was well situated to collect meteorological data from land-falling storms along the west coast of the United States. Previous strong El Niños had been associated with greater than average winter time precipitation for the southwest US and there was the potential for flooding and high impact precipitation events. HMT's instrumentation collected high resolution data including quantitative precipitation estimations (QPE), rainfall drop size estimations, temperature, pressure, relative humidities from land-falling storms. More information on HMT including access to data during the ENRR campaign can be found on the Hydrometeorology Testbed (HMT) website. |
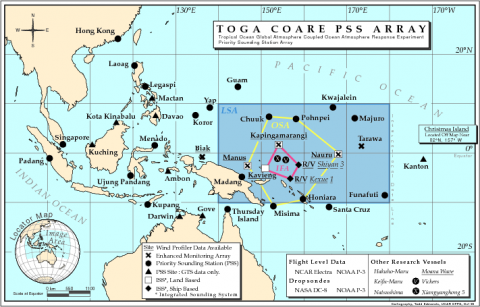
TOGA-COARE Historic Wind Profiler dataWind profiler data was collected during the Tropical Ocean-Global Atmosphere (TOGA-COARE) Intensive Operating Period (IOP); November, 1992, through February, 1993. Some data was collected at these sites after the IOP until 2003. Sites include Kiritimati Island, the Galapagos Islands, Darwin, Manus Island in Papua New Guinea, Piura in Peru, Nauru, a country in Oceania, and Tarawa, an atoll and the capital of the Republic of Kiribati, in the central Pacific Ocean. You can access this data through the PSL wind profiler data page. |
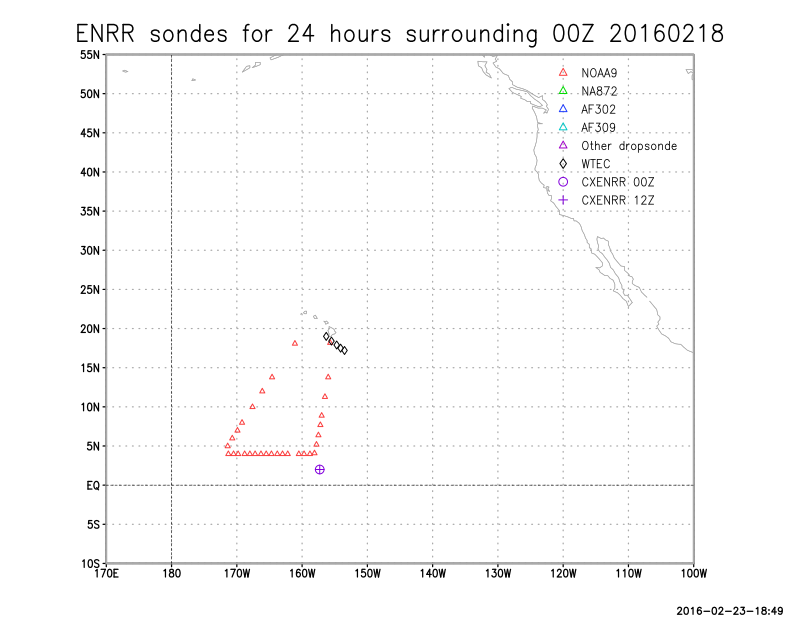
Location of ENRR Dropsondes and RaobsTo see what observations were used, there are maps that provide a quick look of locations of dropsondes and ENRR raobs received and successfully decoded into NCEP's production bufr data tanks. Other dropsondes in the area are also plotted. Maps are courtesty of NOAA's NCEI. |
TOGA-TAO: Tropical Moored Buoy ArrayThe Global Tropical Moored Buoy Array Program is a multi-national effort to provide data in real-time for climate research and forecasting. The Pacific component includes the TAO/TRITON array. The program started in 1979. |
North Pacific Analyses during ENRRThe analyses of sea-level pressure (pmsl) over the north Pacific (NPac; 0-60°N, 130°E-110°W) are available during January through April 2016. There are 4 maps per day (at 00, 06, 12, and 18UTC). They are similar to those produced by the NOAA/NWS/Pacific Region Headquarters in real time |
Satellite ArchivesNOAA keeps an archive of satellite products via their GIBBS Global ISCCP B1 Browse System which includes 1974-present. |
Disclaimer:Every effort is made to assure that the values are correct. However, no guarantees are made and NOAA does is not liable for direct, indirect, incidental, consequential, special or exemplary damages or lost profit resulting from any use or misuse of this data. Researchers should carefully read all data documentation.
|