20th Century Reanalysis
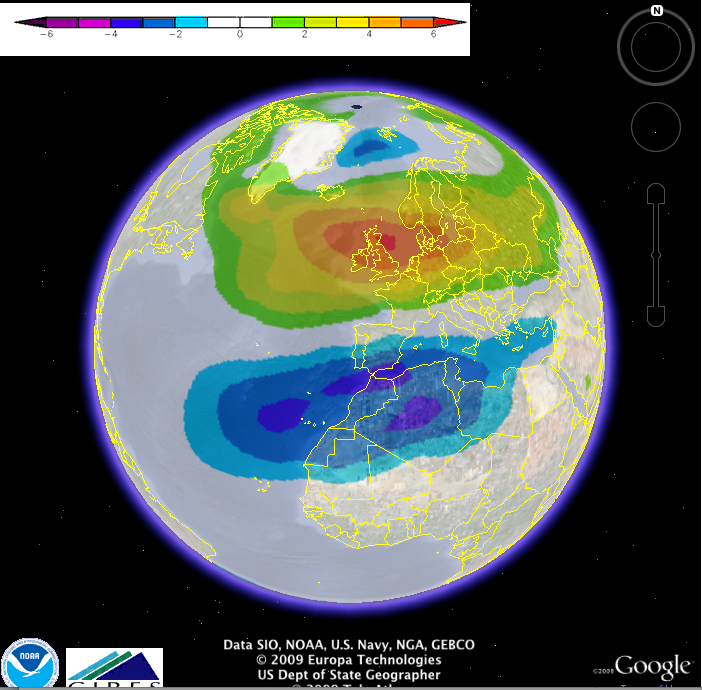
Plot shows the NAO pattern with the anomalous 850mb zonal wind dipole over the eastern NH Atlantic ocean.
Options to produce plot are using the Monthly/seasonal 20th Century Plotting page: Google Earth
- variable=zonal wind
- level=850mb
- January
- use timeseries
- NAO
- standardized values greater than 1 sigma