20th Century Reanalysis
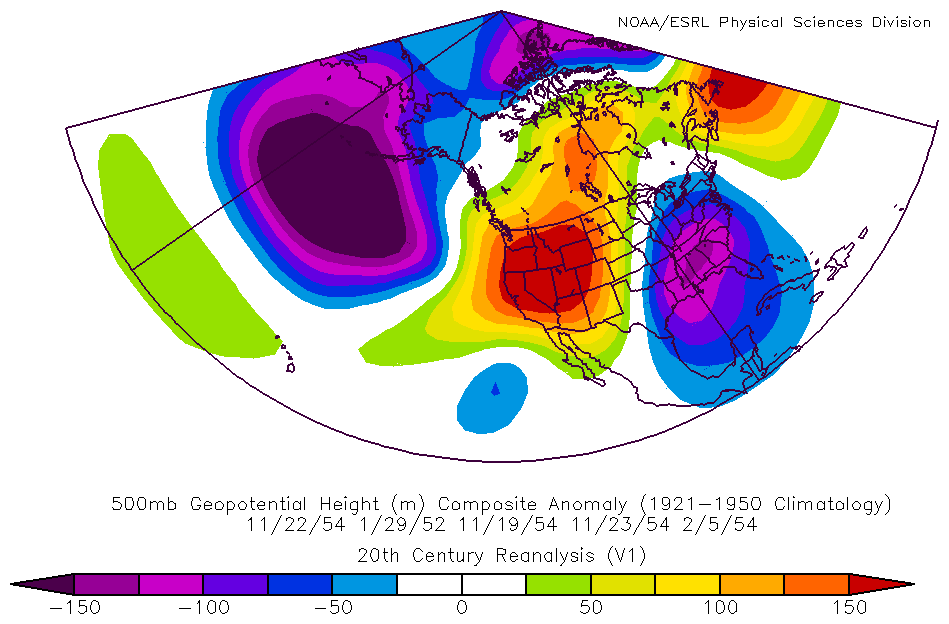
This plot shows the anomalous 500mb geopotential height over the North American Region for the 5 highest PNA index days in the 1950's.
Options to produce plot are using the Daily 20th Century Plotting page
- geopotential height
- 500mb
- 11/22/1954, 1/29/1952, 11/19,1954. 11/23/1954, 2/15/1954
- Anomalies
- Map projection: PNA
