20th Century Reanalysis
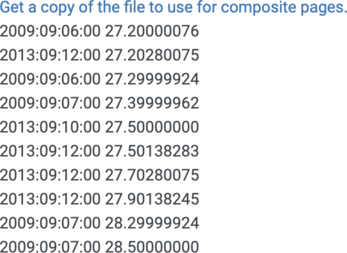
This list of dates contains the 10 largest Sep values of 20CRV3 precipitable water over 2006-2015 at the grid point 40N,255E.
Options to produce plot are using the PSL subdaily time series extraction web page
- Select 20th Century Reanalysis V3
- Select: Variable: precipitable water
- Select: Level: Surface or None
- Select: latitude 40
- Select longitude: 255
- Select: Get subset of dates
- Select: 10
- Select: 2006 to 2015
- Select: Sep to Sep