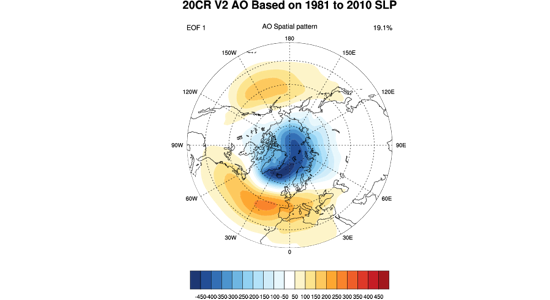
20th Century Reanalysis: : Plot Example
This plot shows the spatial pattern of the 20CR AO
Note that the indices are available in several other pages including the WRIT timeseries. The 20CR climate indicies page has all of the 20CR time-series.
- SLP
- 20CRV3
- Jan
- Jan
- 20 to 90
- 0 to 357.5