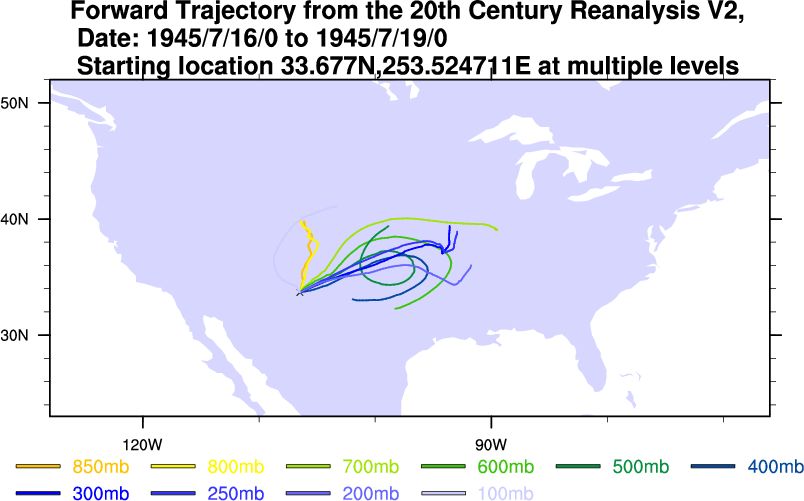
20th Century Reanalysis V2
This plot shows the distribution of Jan 2m air temperature for Boulder CO from 1871-2010.
Options to produce plot are using the PSL WRIT Monthly Timeseries
- Select: dataset 1: 20th Century Reanalysis
- Select: start: 1871
- Select: end: 2010
- Select: seasonal: Yes
- Months: Jan to Jan.
- Select: variable: 850 to 100mb
- Select latitude: 40N
- Select longitude: 255E
- Select: Type: distribution
