20th Century Reanalysis: : Plot Example
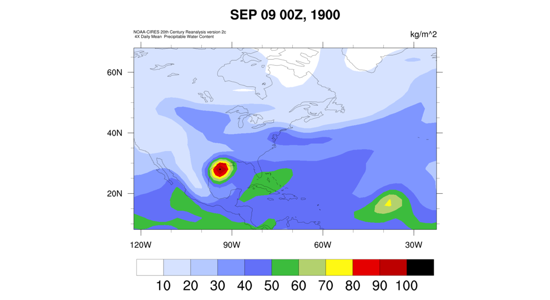
This plot shows a still from the animation of the 1900 Galveston, TX hurricane.
Options to produce plot are using the Plot Animator Page
- 20th Century Reanalysis V2C
- Precipitable Water
- 4x Daily
- Mean
- Sep 8 1900
- Sep 11 1900
- Default
- Custom
- -100 to -20
- 8 to 66