
Why Attribution?
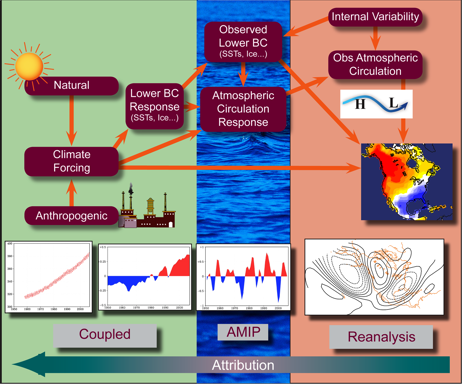 Schematic illustration of the data sets and modeling strategies for performing attribution. The right-side map displays a North American climate condition whose origin is in question. Various candidate causal mechanisms are illustrated in the right-to-left sequences of figures, together with the attribution tool. Listed above each in brown shared boxes is a plausible cause that could be assigned to the demonstrated mechanism depending upon the diagnosis of forcing-response relationships derived from attribution methods. The chain of attribution proceeds from right to left. The efficacy of the first link is tested, often empirically, by determining consistency with patterns of internal atmospheric variability, such as the teleconnection processes identifiable from reanalysis data. This step placse the current condition within a global and historical context. The efficacy of the second link tests the role of internal boundary forcings, most often with atmospheric models (AMIP). The efficacy of the third link tests the role eof external boundary forcing , most often with coupled ocean-atmosphere models. The processes responsible for the climate condition in question may, or may not, involve teleconnections, but may result from local changes in direct radioactive forcing or other near-surface forcing such as from land surface anomalies. The lower panels illustrate representative process: from left-to-right; time-evolving atmospheric carbon dioxide at Mauna Loa, the multi-decadal warming trend in tropical west Pacific-Indian Ocean warmpool SSTs, the yearly SST variability over the tropical east Pacific due to ENSO, the atmospheric pattern over the North Pacific/ North America referred to as the PNA teleconnection. |
Policy-makers and decision-makers are increasingly asking climate to go beyond descriptions of what the current climate conditions are and how they compare with the past, to also explain why climate is evolving as observed; that is, to provide attribution of the causes for observed climate variations and change.
Requests for climate attribution far transcend the question of what is causing an increase in global averged temperatures. Other notable concerns are to explain the causes for regional variations and the causes for high-impact climate events, such as the recent multi-year drought in the western United States and the record setting 2006 US warmth. For many decision-makers who must assess potential impacts and management options, a particularly important question is: How well do we understand the causes for regional and seasonal differences in climate variations and trends? For example, is the source for the recent drought in the western US due mainly to factors internal to the climate system, in which case a return toward previous climate conditions might be anticipated, or is it rather a manifestation of a longer-term trend toward increasing aridity in the region that is driven primarily by anthropogenic forcing? Such examples illustrate that to support informed decision-making, the capability to attribute causes for past and current climate conditions can be of fundamental importance.
The science of attribution relies on multiple lines of evidence, and generally no single data set or tool is sufficient to establish attribution. Thus, best practices for attribution employ other climate analyses and model simulations.
To illustrate these multiple tools used in attribution, the illustration below presents a schematic of the various steps involved in explaining the origin of some idealized North American surface climate conditions. A first step involves assessing the relation between the surface condition and circulation patterns of large spatial extent occurring above the EarthŐs surface. These may involve the effect of atmospheric circulation patterns---in many cases that is the immediate cause of climate anomalies in the extratropical latitudes. A sound scientific interpretation of the source for the surface climate condition thus involves relating it to accurately measured and analyzed features of atmospheric circulation.
In part owing to the limited record of observational data, cause-effect relationships are often derived from climate model experiments, and such tools are key in establishing attribution as illustrated in the second and third links of attribution schematic. The probability that the atmospheric circulation could itself have been forced by lower boundary conditions, such as SST anomalies, is evaluated using atmospheric general circulation models. These boundary conditions may themselves originate from external forcing, requiring an assessment of the response of coupled ocean-atmosphere land models to external forcing. Such a suite of experimentation, together with diagnosis of the global circulation patterns and their historical context are all key ingredients that permit exploration of the full spectrum of climate sensitivity to forcings, and frequently provide the core evidence needed in establishing attribution.