Measurements at the Mauna Loa Observatory stopped after the 2022 eruption of the Mauna Loa volcano, when lava flow crossed the access road and took out power lines to the facility. The observatory remains inaccessible by vehicle and without power from the local utility company.
Observatory staff has established limited solar power in four observatory buildings and restored approximately 33 percent of the measurements onsite, including the Global Monitoring Laboratory and Scripps critical CO2 records and other atmospheric measurements.
Media can contact: Theo Stein (303) 819-7409 (theo.stein@noaa.gov) or Karin Vergoth 303-632-6413 (karin.vergoth@noaa.gov)
![]() National Oceanic and Atmospheric Administration (NOAA),
National Oceanic and Atmospheric Administration (NOAA),
Earth System Research Laboratory (ESRL)
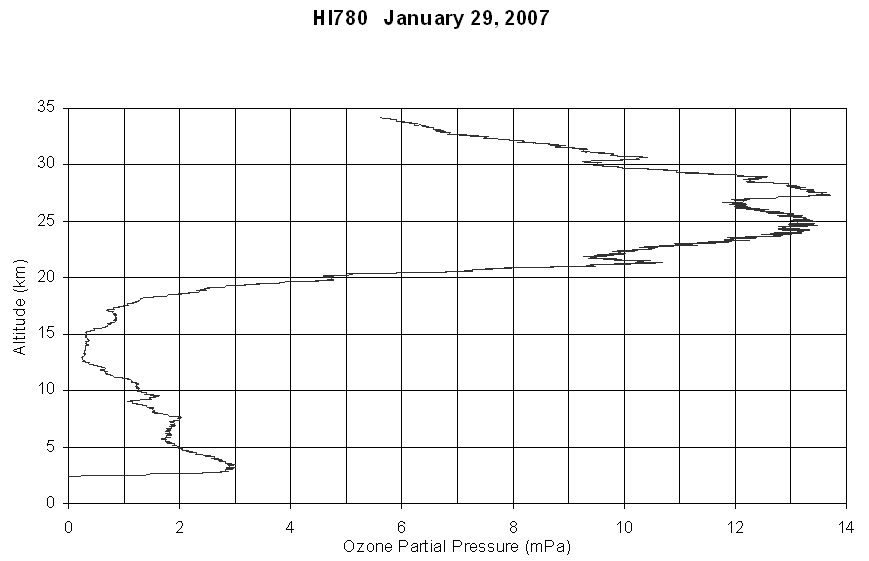
Ozone, temperature, and humidity profiles from the launch site in Hilo to a typical altitude of 30-35 km.
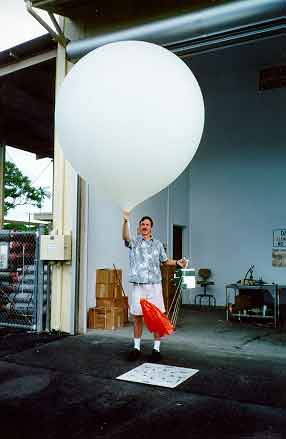
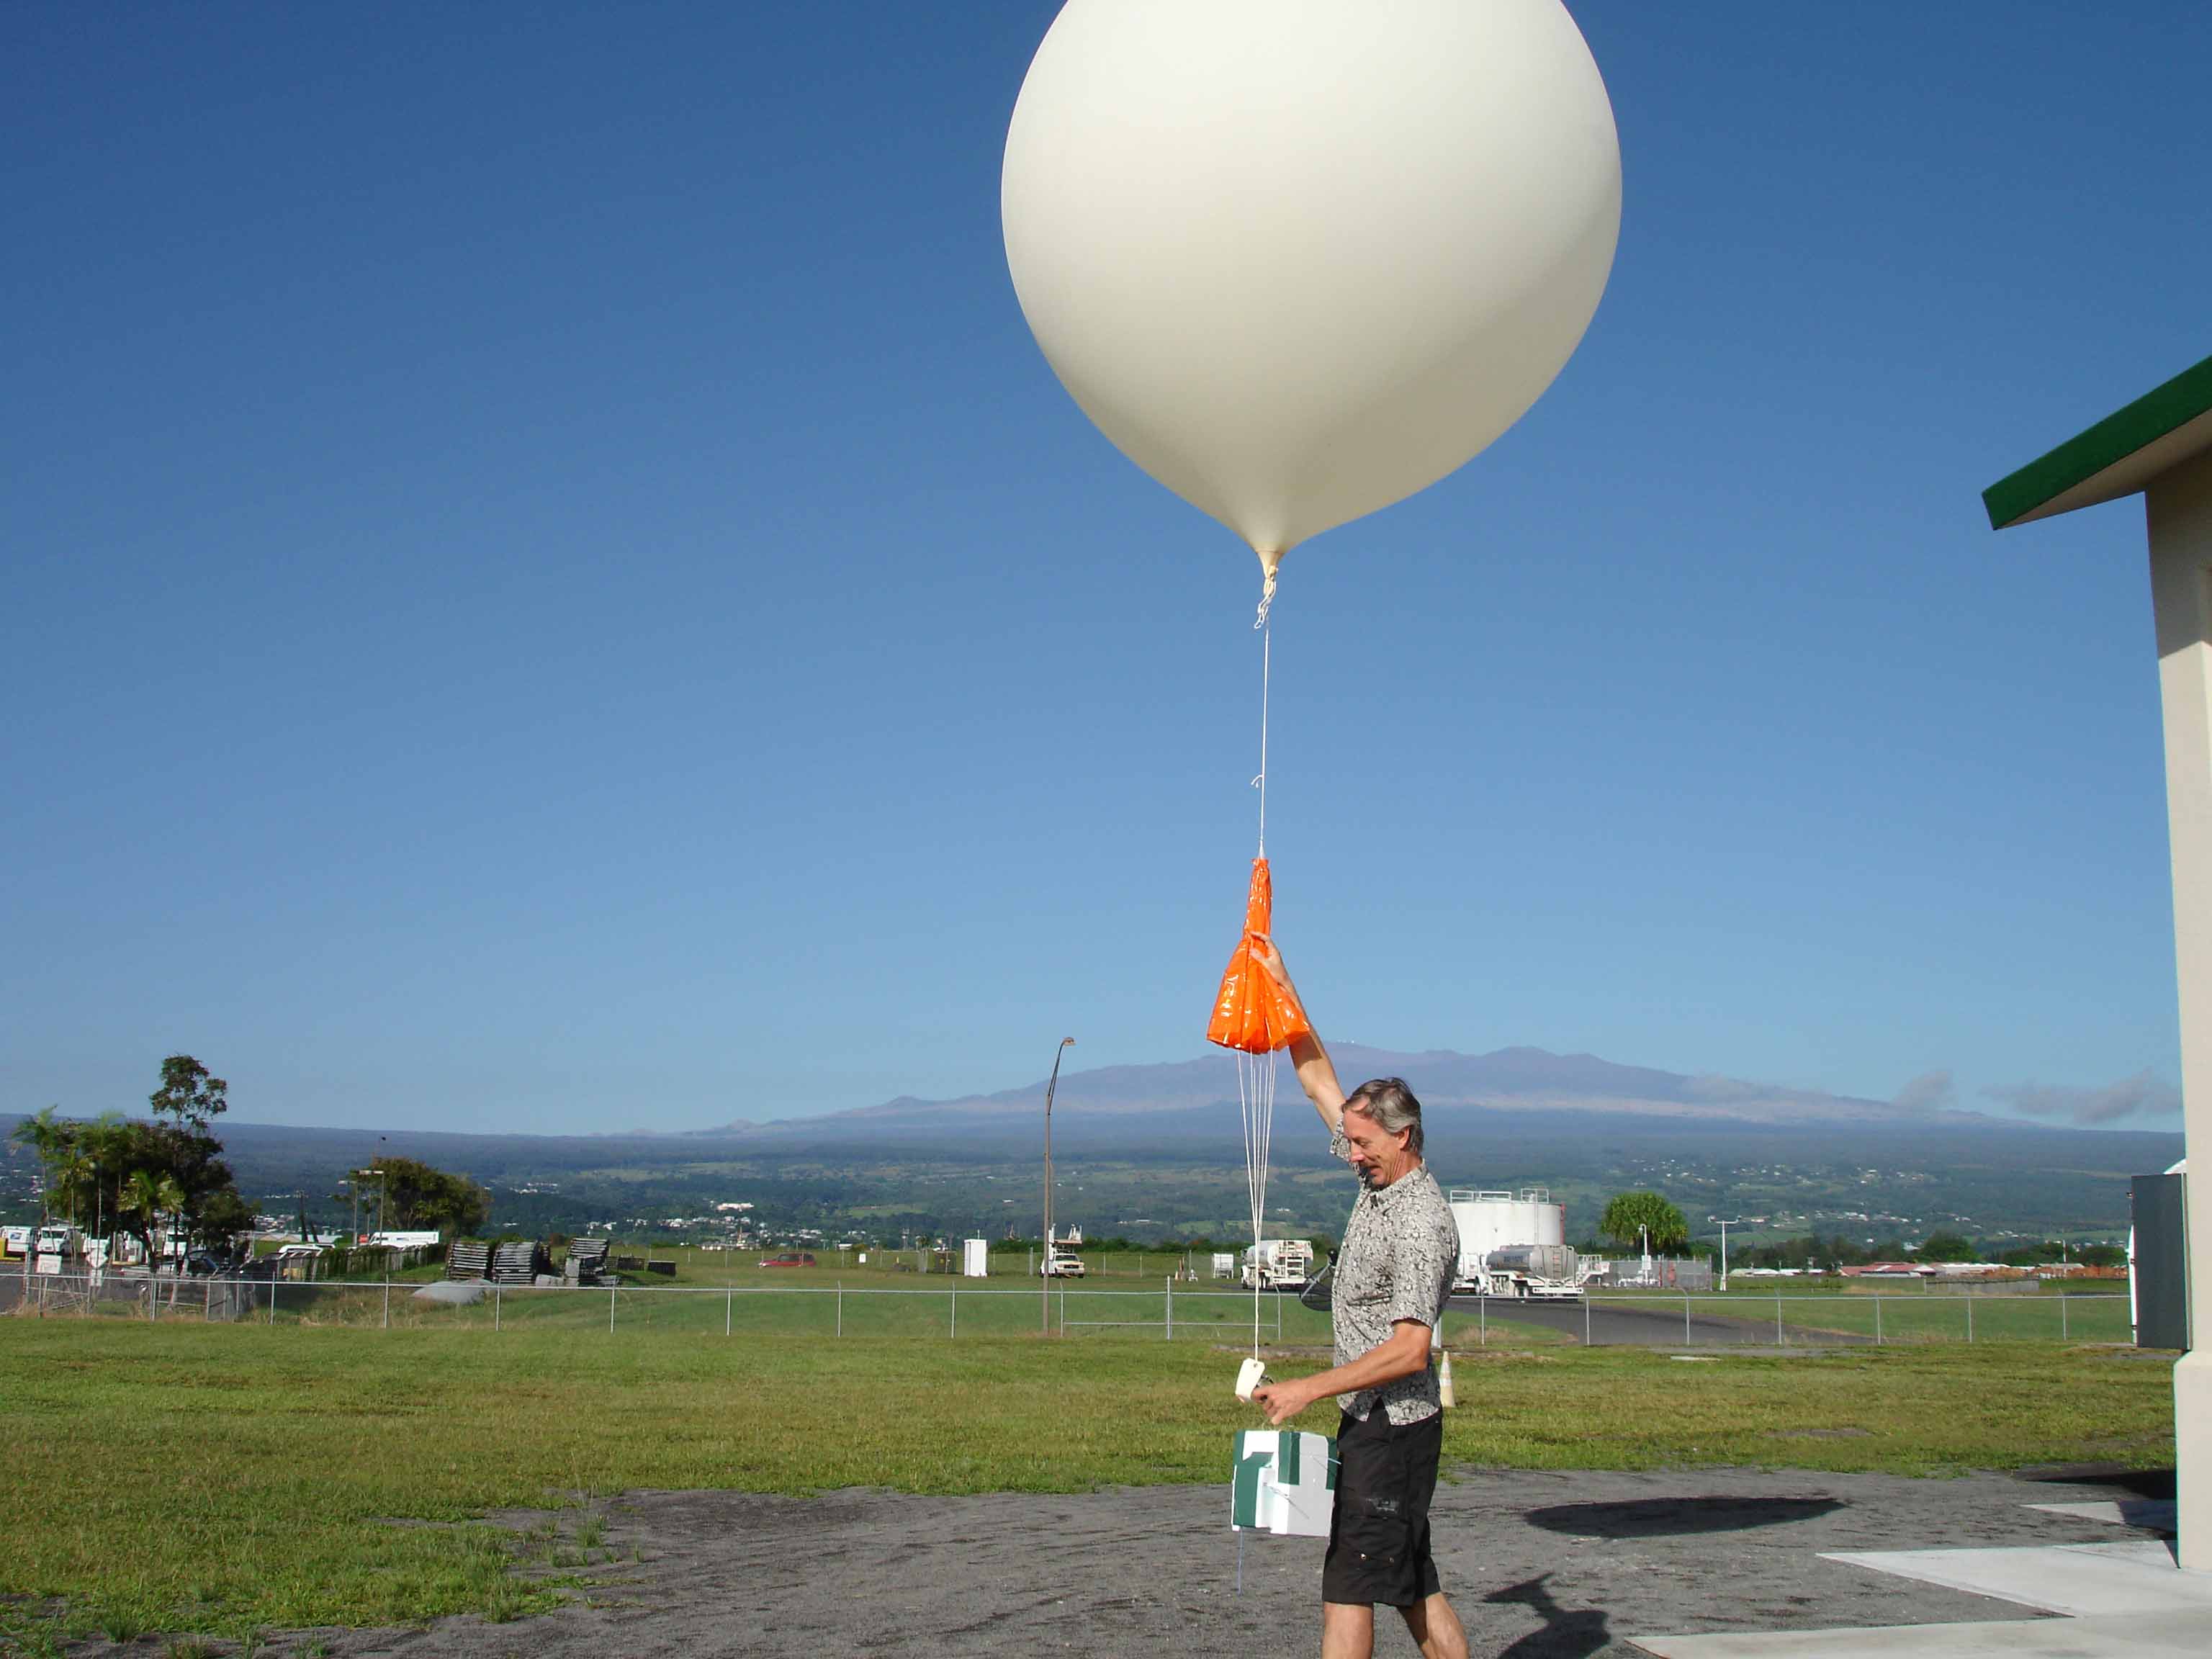
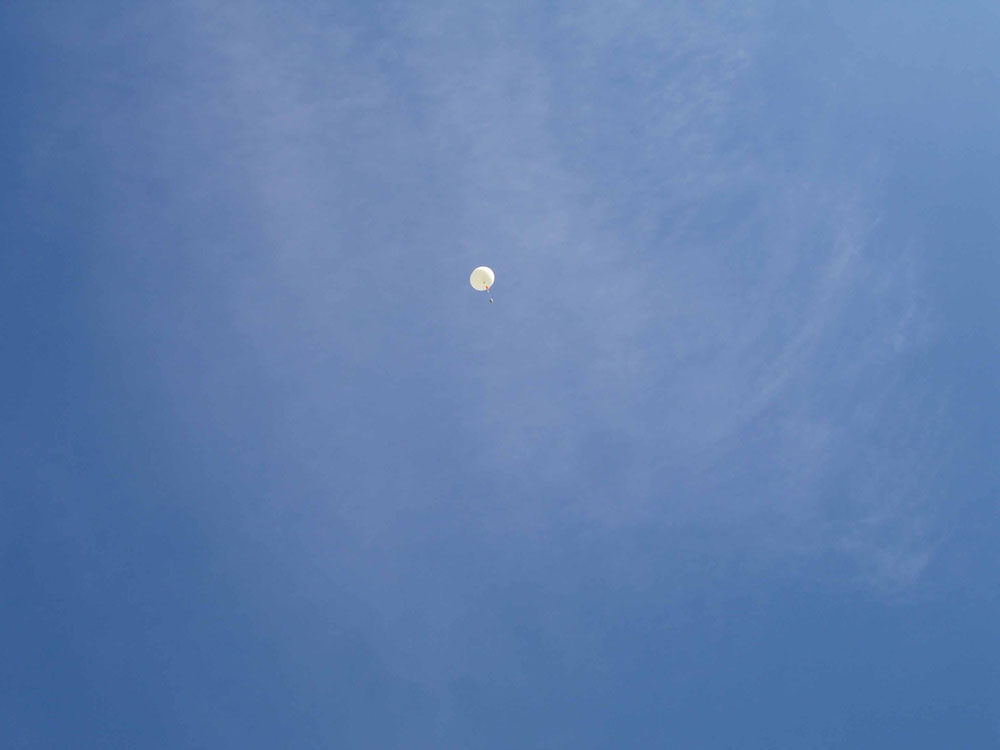
EEC Ozonesondes/radiosondes are launched once per week from the weather service facility at the airport in Hilo. The ozonesonde consists of a small pump which delivers air through a chemical cell which produces a small electrical current in proportion to the number of ozone molecules that pass through it. This signal is amplified by a circuit board and sent to the radiosonde which radios the ozone, air temperature, relative humidity, pump temperature, battery voltage and pump current information to a ground station. Each ozonesonde is calibrated in the lab prior to launch. The ozonesonde/radiosonde package is lifted by a 1200g balloon, filled with hydrogen gas to a diameter of about 2 meters and a lift force of 2.2 kg. The balloon rises for about 100 minutes to an altitude of 30-35 km (at a pressure of 10-5 mb) and bursts. The descent under a small parachute takes about 30 minutes. About 10% of the instruments are recovered and reused.
Continual monitoring of ozone profiles at different locations around the world are important to determine the rate of ozone loss as a function of latitude and height above the ground. Stratospheric ozone loss has been greatest at high latitudes and least in the tropics. These data also show the natural seasonal cycles of ozone, as well as multi-year variations related to the QBO and solar cycles.
Below is an ozone profile from January 29th, 2007. The launch site, shown in a few photos to the right, is at the old airport in Hilo, Hawaii. The "zero" ozone levels below 2.5 km were caused by vog. SO2 reacts in the ozonesonde cell and produces a negative current. If the SO2 concentration is greater than the O3 concentration, the program calculates a negative ozone concentration, which is reported as zero.
The Hilo station is part of a larger global network of ESRL/GMD ozonesonde stations. Research by ESRL/GMD has been critical in determining the degree of the depletion of stratospheric ozone and the trends of the compounds causing this depletion. ESRL/GMD determines the vertical extent of depletion over Antarctica (the ozone hole), makes a significant contribution to world-wide, ground-based measurements of total-column ozone, and monitors the gases responsible for depleting stratospheric ozone. Understanding the production and fate of ozone and the compounds that deplete it has been and remains a focal point of this research.
The following is a list of publication abstracts concerning ozone. The publications are based on data from the ozonesonde program as well as the Dasibi Surface Ozone program and the Dobson program. To download this list in Microsoft Word document format (.doc), click here
Title: A new method for describing long-term changes in total ozone Authors: HARRIS, J.M., S.J. OLTMANS, P.P. TANS, R.D. EVANS, and D.L. QUINCY Source: Geophysical Research Letters,28, 24, 4535-4538, 2001 Document Type: Journal Article Abstract: A new method for describing long-term changes in total ozone was developed so that variations on time scales greater than that of the QBO may be examined. The technique fits a flexible tendency curve to total ozone data after explained variations have been removed. The derivative of the tendency curve is the growth rate curve. The average along this curve is comparable to total ozone trends reported in the past. Statistical uncertainty of the growth rate is determined using bootstrap techniques. Dobson column ozone measurements with long-term (30+ years) records from the NOAA/CMDL Cooperative Dobson Network were analyzed. Total ozone decreases ranged from 1-2%/decade since the 1960s and from 2-4%/decade since 1979 at all sites except Mauna Loa where results were not significant. The tendency curves indicate that the total ozone decline began in the 1970s and that there are no clear signs of recovery as of the end of 2000.
Title: Evidence for slowdown in stratospheric ozone loss: First stage of ozone recovery Author(s): Newchurch MJ, Yang ES, Cunnold DM, Reinsel GC, Zawodny JM, Russell JM Source: JOURNAL OF GEOPHYSICAL RESEARCH-ATMOSPHERES 108 (D16): Art. No. 4507 AUG 23 2003 Abstract: Global ozone trends derived from the Stratospheric Aerosol and Gas Experiment I and II (SAGE I/II) combined with the more recent Halogen Occultation Experiment (HALOE) observations provide evidence of a slowdown in stratospheric ozone losses since 1997. This evidence is quantified by the cumulative sum of residual differences from the predicted linear trend. The cumulative residuals indicate that the rate of ozone loss at 35 45 km altitudes globally has diminished. These changes in loss rates are consistent with the slowdown of total stratospheric chlorine increases characterized by HALOE HCl measurements. These changes in the ozone loss rates in the upper stratosphere are significant and constitute the first stage of a recovery of the ozone layer. Author Keywords: stratospheric ozone trends; CFCs; Montreal Protocol
Title: Trends of ozone in the troposphere Authors: OLTMANS, S.J., A.S. Lefohn, H.E. Scheel, J.M. HARRIS, H. Levy II, I.E. Galbally, E.-G. Brunke, C.P. Meyer, J.A. LATHROP, B.J. JOHNSON, D.S. Shadwick, E. Cuevas, F.J. Schmidlin, D.W. Tarasick, H. Claude, J.B. Kerr, O. Uchino, and V. Mohnen Source: Geophysical Research Letters,25, 2, 139-142, 1998 Document Type: Journal Article Abstract: Using a set of selected surface ozone (nine stations) and ozone vertical profile measurements (from six stations), we have documented changes in tropospheric ozone at a number of locations. From two stations at high northern hemisphere (NH) latitudes there has been a significant decline in ozone amounts throughout the troposphere since the early 1980s. At midlatitudes of the NH where data are the most abundant, on the other hand, important regional differences prevail. The two stations in the eastern United States show that changes in ozone concentrations since the early 1970s have been relatively small. At the two sites in Europe, however, ozone amounts increased rapidly into the mid-1980s, but have increased less rapidly (or in some places not at all) since then. Increases at the Japanese ozonesonde station have been largest in the lower troposphere, but have slowed in the recent decade. The tropics are sparsely sampled but do not show significant changes. Small increases are suggested at southern hemisphere (SH) midlatitudes by the two surface data records. In Antarctica large declines in the ozone concentration are noted in the South Pole data, and like those at high latitudes of the NH, seem to parallel the large decreases in the stratosphere.
Title: Detecting the recovery of total column ozone Authors: Weatherhead, E.C., G.C. Reinsel, G.C. Tiao, C.H. Jackman, L. Bishop, S.M. Hollandsworth-Frith, J. DeLuisi, T. Keller, S.J. OLTMANS, E.L. Fleming, D.J. Wuebbles, J.B. Kerr, A.J. Miller, J. Herman, R. McPeters, R.M. Nagatani, and J.E. Frederick Source: Journal of Geophysical Research,105, D17, 22,201-22,210, 2000 Document Type: Journal Article Abstract: International agreements for the limitation of ozone-depleting substances have already resulted in decreases in concentrations of some of these chemicals in the troposphere. Full compliance and understanding of all factors contributing to ozone depletion are still uncertain; however, reasonable expectations are for a gradual recovery of the ozone layer over the next 50 years. Because of the complexity of the processes involved in ozone depletion, it is crucial to detect not just a decrease in ozone-depleting substances but also a recovery in the ozone layer. The recovery is likely to be detected in some areas sooner than others because of natural variability in ozone concentrations. On the basis of both the magnitude and autocorrelation of the noise from Nimbus 7 Total Ozone Mapping Spectrometer ozone measurements, estimates of the time required to detect a fixed trend in ozone at various locations around the world are presented. Predictions from the Goddard Space Flight Center (GSFC) two-dimensional chemical model are used to estimate the time required to detect predicted trends in different areas of the world. The analysis is based on our current understanding of ozone chemistry, full compliance with the Montreal Protocol and its amendments, and no intervening factors, such as major volcanic eruptions or enhanced stratospheric cooling. The results indicate that recovery of total column ozone is likely to be detected earliest in the Southern Hemisphere near New Zealand, southern Africa, and the southern South America and that the range of time expected to detect recovery for most regions of the world is between 15 and 45 years. Should the recovery be slower than predicted by the GSFC model, owing, for instance, to the effect of greenhouse gas emissions, or should measurement sites be perturbed, even longer times would be needed for detection
Title: Trends in the vertical distribution of ozone: A comparison of two analyses of ozonesonde data Author(s): Logan JA, Megretskaia IA, Miller AJ, Tiao GC, Choi D, Zhang L, Stolarski RS, Labow GJ, Hollandsworth SM, Bodeker GE, Claude H, De Muer D, Kerr JB, Tarasick DW, Oltmans SJ, Johnson B, Schmidlin F, Staehelin J, Viatte P, Uchino O Source: JOURNAL OF GEOPHYSICAL RESEARCH-ATMOSPHERES 104 (D21): 26373-26399 NOV 20 1999 Abstract: We present the results of two independent analyses of trends in the vertical distribution of ozone. For most of the ozonesonde stations we use data that were recently reevaluated and reprocessed to improve their quality and internal consistency. The two analyses give similar results for trends in ozone. We attribute differences in results primarily to differences in data selection criteria, rather than in statistical trend models. We find significant decreases in stratospheric ozone at all stations in middle and high latitudes of the Northern Hemisphere from 1970 to 1996, with the largest decreases located between 12 and 2i km, and trends of -3 to -10 %/decade near 17 km. The decreases are largest at the Canadian and the most northerly Japanese station and are smallest at the European stations and at Wallops Island. The mean midlatitude trend is largest, -7 %/decade, from 12 to 18 km for 1970-1996, and the decrease in ozone is significant from 10.5 to 25 km. For 1980-1996, the decrease is more negative by 1-2 %/decade, with a maximum trend of -9%/decade in the lowermost stratosphere. The trends vary seasonally from about 10 to 17 km, with largest ozone decreases in winter and spring. Trends in tropospheric ozone are highly variable and depend on the region. There are decreases or zero trends at the Canadian stations for 1970-1996, and decreases of -2 to -8 %/decade for the mid-troposphere for 1980-1996; the three European stations show increases for 1970-1996, but trends are close to zero for two stations for 1980-1996 and positive for one; there are increases in ozone for the three Japanese stations for 1970-1996, but trends are either positive or zero for 1980-1996. The United States stations show zero or slightly negative trends in tropospheric ozone after 1980. It is not possible to define reliably a mean tropospheric ozone trend for northern midlatitudes, given the small number of stations and the large variability in trends. The integrated column trends derived from the sonde data are consistent with trends derived from both surface-based and satellite measurements of the ozone column.
Title: Tropospheric Ozone Over the North Pacific From Ozonesonde Observations Authors: Oltmans, S. J. , B. J. Johnson, J. M. Harris, A. M. Thompson, H. Y. Liu, H. Vmel, C. Y. Chan, T. Fujimoto, V. G. Brackett, W. L. Chang, J.-P. Chen, J. H. Kim, L. Y. Chan, and H.-W. Chang. Source: Journal Geophysical Research,109, 10.1029/2003JD003466, 2004 Document Type: Abstract: [ 1] As part of the Transport and Chemical Evolution over the Pacific (TRACE-P) mission, ozonesondes were used to make ozone vertical profile measurements at nine locations in the North Pacific. At most of the sites there is a multiyear record of observations. From locations in the western Pacific ( Hong Kong; Taipei; Jeju Island, Korea; and Naha, Kagoshima, Tsukuba, and Sapporo, Japan), a site in the central Pacific ( Hilo, Hawaii), and a site on the west coast of the United States ( Trinidad Head, California) both a seasonal and event specific picture of tropospheric ozone over the North Pacific emerges. Ozone profiles over the North Pacific generally show a prominent spring maximum throughout the troposphere. This maximum is tied to the location of the jet stream and its influence on stratosphere-troposphere exchange and the increase in photochemical ozone production through the spring. Prominent layers of enhanced ozone in the middle and upper troposphere north of about 30degrees N seem to be more closely tied to stratospheric intrusions while biomass burning leads to layers of enhanced ozone in the lower and upper troposphere at Hong Kong (22 degreesN) and Taipei (25 degreesN). The lower free tropospheric layers at Hong Kong are associated with burning in SE Asia, but the upper layer may be associated with either equatorial Northern Hemisphere burning in Africa or SE Asian biomass burning. In the boundary layer at Taipei very high mixing ratios of ozone were observed that result from pollution transport from China in the spring and local urban pollution during the summer. At the ozonesonde site near Tokyo ( Tsukuba, 36 degreesN) very large enhancements of ozone are seen in the boundary layer in the summer that are characteristic of urban air pollution. At sites in the mid and eastern Pacific the signature of transport of polluted air from Asia is not readily identifiable from the ozonesonde profile. This is likely due to the more subtle signal and the fact that from the ozone profile and meteorological data by themselves it is difficult to identify such a signal. During the TRACE-P intensive campaign period (February - April 2001), tropospheric ozone amounts were generally typical of those seen in the long-term records of the stations with multiyear soundings. The exception was the upper troposphere over Hong Kong and Taipei where ozone amounts were lower in 2001.
Bryan Johnson
303-497-6842
David Nardini
808-933-6965 (x229)
Darryl Kuniyuki
808-933-6965 (x237)
1984