|
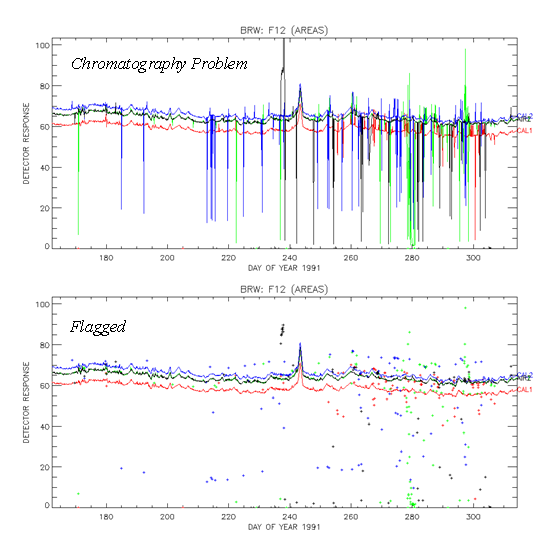
Figure 6. Time series plots of chromatographic
CFC-12 peak areas from air and calibration samples injected
at the Barrow, Alaska between 06/10/91 and 11/10/91 (i.e. days 161 - 314
of the year 1991). Air samples were injected from two seperate sample
streams shown here in green (AIR1 in the right-hand margin of the plots)
and black (AIR2). Calibration samples were injected from two seperate
working standard tanks shown here in red (CAL1) and blue (CAL2). The
line plot of unflagged peak analyses (top frame) shows a considerable
degree of chromatographic instability resulting from a poorly
functioning gas sample valve that allowed intermittent injections of
super and sub pressurized samples. Chromatography problems stemming
from equipment malfunctions were common occurrences throughout the
areas/heights database and uncorrectable by nature. In intermittent
cases such as illustrated here, the ill effects were compounded by the
fact that a single calibration sample might be involved in calibration
response interpolations to several nearby air samples. This compounding
effect was minimized by flagging the data as shown in the bottom frame.
Here, line-connected data remain available for usage in atmospheric
concentration calculations, while off-line data points are unavailable.
|