
We have expanded the X2004 CH4 scale to cover the nominal range 300 to 5000 ppb CH4, and we've updated historical calibrations from the start of our CH4 measurement program until present. A new multi-point calibration strategy has been implemented to ensure accurate transfer of the scale across its entire range.
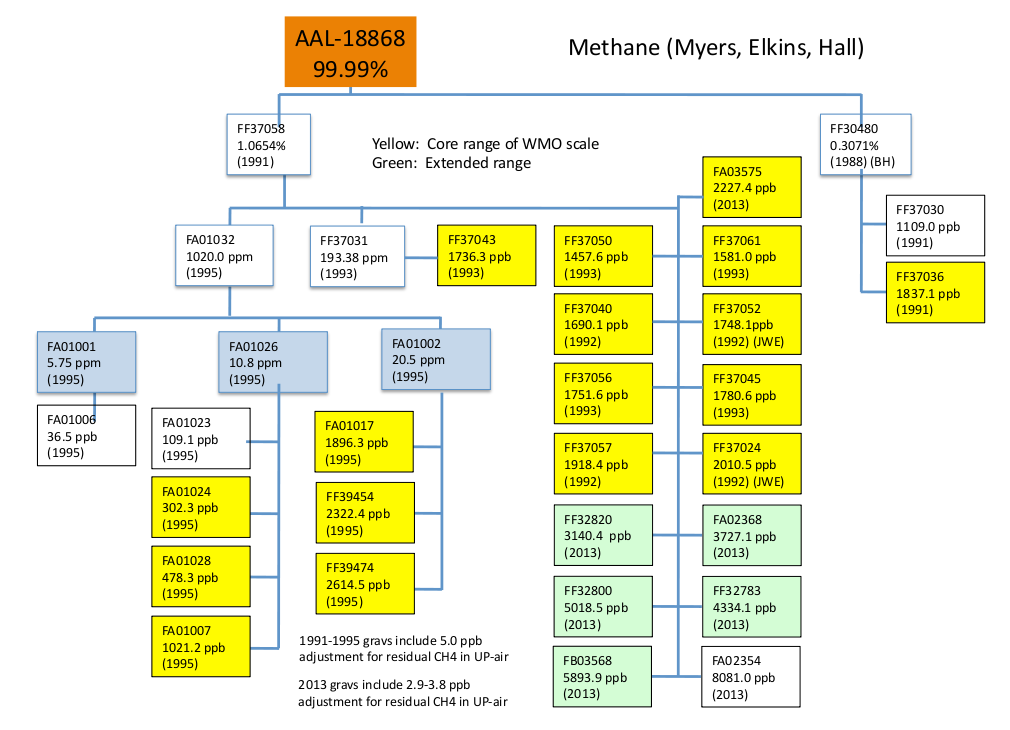
The X2004A scale is based on the 16 original primary standards prepared in 1991 to 1995 covering the nominal range 300 to 2600 ppb used to define the X2004 scale plus 6 new primaries prepared in 2013 with assigned CH4 mole fractions between 2200 and 5900 ppb (see Figure 1). Gravimetric methods used to prepare the original and new primary standards are described in Dlugokencky et al. (2005). New standards added to the X2004 scale were prepared with only one of the 3 methods used for the originals, the “tube flush” method. In contrast to the older gravimetrically-prepared standards where CH4 in the zero air used was below our detection limit, we now measure the CH4 mole fraction in the diluent gas and correct for it. In 2013, corrections for CH4 in the diluent gas ranged from 2.0 to 4.4 ppb. The primary standards used to define the X2004A scale are summarized in Table 1.
| Cylinder ID | Year Prepared | Assigned CH4 (ppb) | Uncertainty* (ppb) |
|---|---|---|---|
| FA01024 | 1995 | 302.3 | 2.0 |
| FA01028 | 1994 | 478.3 | 2.1 |
| FA01007 | 1995 | 1021.2 | 2.5 |
| FF37050 | 1993 | 1457.6 | 2.5 |
| FF37061 | 1993 | 1581.0 | 2.3 |
| FF37040 | 1992 | 1690.1 | 2.3 |
| FF37043 | 1993 | 1736.3 | 3.6 |
| FF37052 | 1992 | 1748.1 | 2.3 |
| FF37056 | 1993 | 1751.6 | 2.3 |
| FF37045 | 1993 | 1780.6 | 2.2 |
| FF37036 | 1991 | 1837.1 | 2.4 |
| FA01017 | 1995 | 1896.3 | 2.4 |
| FF37057 | 1992 | 1918.4 | 2.4 |
| FF37024 | 1992 | 2010.5 | 2.3 |
| FB03575 | 2013 | 2227.1 | 1.8 |
| FF39454 | 1995 | 2322.4 | 2.6 |
| FF39474 | 1995 | 2614.5 | 2.7 |
| FF32820 | 2013 | 3140.4 | 2.0 |
| FA02368 | 2013 | 3727.1 | 2.2 |
| FF32783 | 2013 | 4334.0 | 2.5 |
| FF32800 | 2013 | 5018.5 | 2.7 |
| FB03568 | 2013 | 5893.6 | 3.6 |
| *Uncertainties are 67% confidence intervals. They do not include absolute uncertainty in the scale. | |||
To institute the multi-point calibration strategy, 14 secondary standards were prepared by evacuating 29 L aluminum cylinders, then spiking them with zero air, or a gas mixture enriched in CH4, then filling to 2000 psig with ambient air at Niwot Ridge, CO, USA. These cover the nominal range 390 to 5000 ppb. These secondary standards have been calibrated 6 times against the primary standards from July, 2013 to February, 2015, as described below.
To propagate the scale, we first prepare a normalized instrument response curve. To do this, each of the 22 primary standards is analyzed relative to a reference 7 times, alternating between aliquots of primary and reference, and always starting and ending with the primary. The reference is a cylinder of dry natural air with contemporary mid-latitude, Northern Hemisphere CH4 mole fraction, and it is used to normalize small changes in ambient pressure that affect the mass of air in each aliquot injected (see Dlugokencky et al., 2005, for details). Results are plotted with the gravimetrically assigned value, corrected for CH4 in the diluent gas, on the ordinate axis and the mean ratio of primary/reference peak area on the abscissa. Initially, a 1st-order polynomial was used, but as our GC/FID system became non-linear, we tested various other functions (2nd-order polynomial, exponential,…) and concluded that a power function of the form y = c0 + c1xc2 (where ci are the coefficients of the fit, x is the mean response ratio, and y is the CH4 mole fraction; when c2 = 1, the function reduces to a linear polynomial) gave the most consistent pattern of residuals across periods of differing linearity. Results are fitted using an orthogonal distance regression (ODR), which allows uncertainties in both coordinates; points are weighted by the inverse of their respective uncertainties (see Tables 1 and 2). Uncertainties in the primary standards (at 67% confidence interval) are based on methods in the Guide to Uncertainty in Measurements (http://www.iso.org/sites/JCGM/GUM-introduction.htm; Evaluation of measurement data – Guide to the expression of uncertainty in measurement, 2008); for the normalized response ratios, 1 standard deviation is used for the uncertainty. Once a response curve is prepared for the primary (gravimetrically-prepared) standards, each of the secondary standards is measured against the same reference, and the mean ratio of its response is used to calculate its CH4 mole fraction. This process has been repeated 6 times since July, 2013, 5 times with the GC/FID system and once with the CRDS (similar calibration strategy as with the GC/FID is employed, but a 1st-order polynomial is used), and all 6 determinations are averaged to assign the secondary values listed in Table 2. Similar normalized instrument response curves based on the new suite of secondary standards are generated monthly to propagate the scale to tertiary standards.
| Cylinder ID | Year Prepared | Assigned CH4 (ppb) | Uncertainty* (ppb) |
|---|---|---|---|
| CB09868 | 2013 | 389.3 | 0.3 |
| CB09893 | 2013 | 849.5 | 0.3 |
| CB09867 | 2013 | 1236.6 | 0.3 |
| CB09898 | 2013 | 1626.7 | 0.3 |
| CB09871 | 2013 | 1797.1 | 0.4 |
| CB09891 | 2013 | 1952.4 | 0.5 |
| CB09804 | 2013 | 2090.6 | 0.3 |
| CB09888 | 2013 | 2433.5 | 0.4 |
| CB09899 | 2013 | 2865.3 | 0.6 |
| CB09900 | 2013 | 3317.5 | 0.4 |
| CB09895 | 2013 | 3762.8 | 0.5 |
| CB09889 | 2013 | 4155.1 | 0.8 |
| CB08856 | 2013 | 4568.9 | 0.8 |
| CB10121 | 2013 | 4998.0 | 1.0 |
| *Uncertainties are the reproducibility (67% confidence intervals) of calibrating the secondary standards against the primary standards listed in Table 1. | |||
Since all but two of our historical secondary standards (i.e., secondary standards used to calibrate tertiary standards from the start of our measurement program until July, 2013) were archived, each was reanalyzed and its CH4 mole reassigned on the X2004A scale. Each historical secondary was reanalyzed 3 times on the GC/FID system and once on the CRDS from Oct., 2014 to Feb., 2015. The average change (±1 s.d.) was -0.3±0.3 ppb. The two historical secondary standards that could not be re-analyzed were re-assigned based on their historical comparisons to other secondary standards that were re-analyzed.
All tertiary standards were reprocessed based on the new assignments to our secondary standards. Tertiary standards calibrated since 17 July 2013 were corrected for non-linearity of our calibration system using the appropriate response curve from the suite of new secondary standards. The magnitude of the non-linearity correction is significantly greater for cylinders calibrated since October, 2013. Standards calibrated before 17 July 2013 will not be corrected for non-linearity, but we believe these potential corrections are small, even for standards outside the ambient range (~1600 to 2000 ppb).