
Boulder Atmospheric Observatory Tall Tower
One tall tower that was built specifically for atmospheric research is the Boulder Atmospheric
Observatory (BAO) Tall Tower. Although there are unique towers throughout the United States,
most of them are set up similar to the BAO Tall Tower.
To learn more about the BAO tower and how it was decided to be used for a CO2 monitoring site, read
On the Use of the Boulder Atmospheric Observatory as a CO2 Tall Tower Site
Specifications
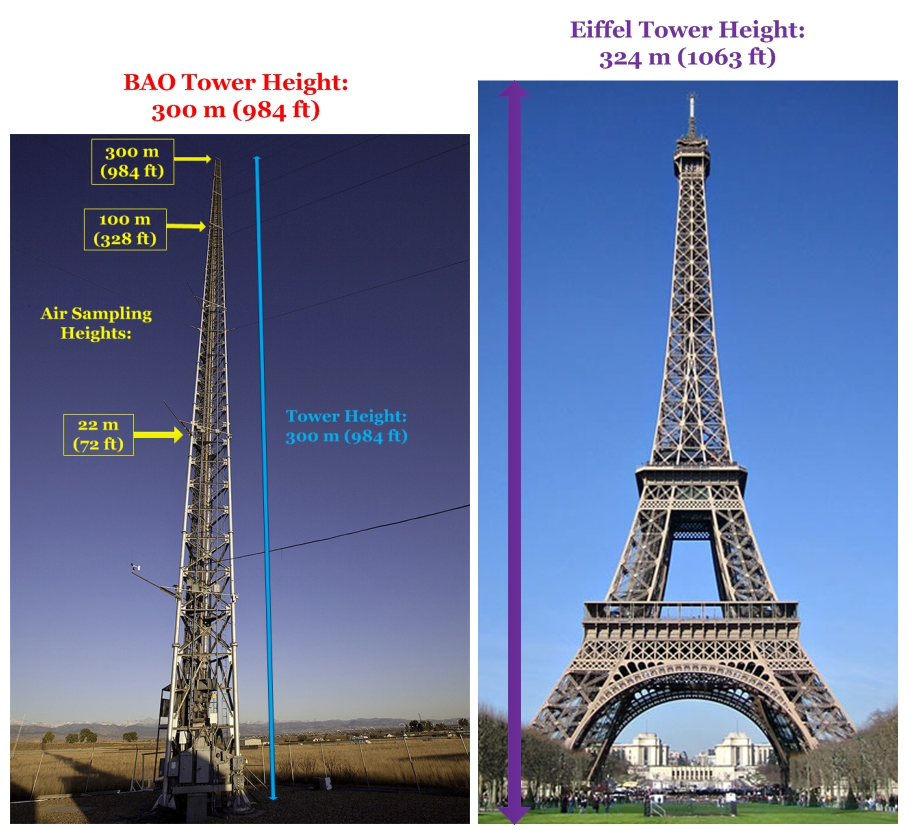
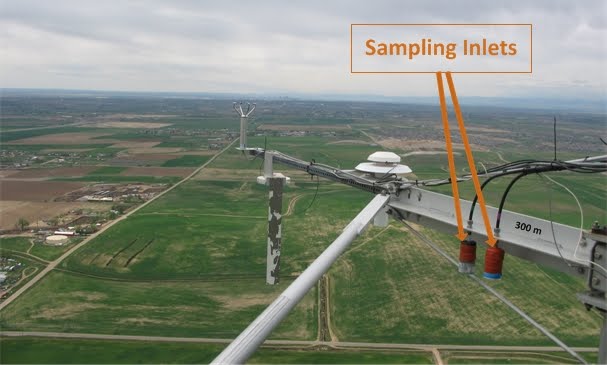
The BAO Tower stands 300 meters tall (almost 1,000 feet) and is instrumented with air sampling inlets at three heights up the tower (22m, 100m, and 300m). An elevator is equipped on the BAO Tower, which is not seen on many of the other towers within the Air Sampling Network.
Click on the image to view a larger sized photo.
Location
The Google map above shows where the BAO tower is located in Colorado. Check out the surrounding area to see the famous Rocky Mountains to the west and the large urban expanse of Denver to the south. Due to the tower's surroundings and varying wind directions, we can see noticeable differences in the air that that is being sampled. Check out the graph below showing differences in CO2 concentrations recorded at the BAO tower when winds were blowing from different directions.

Equipment
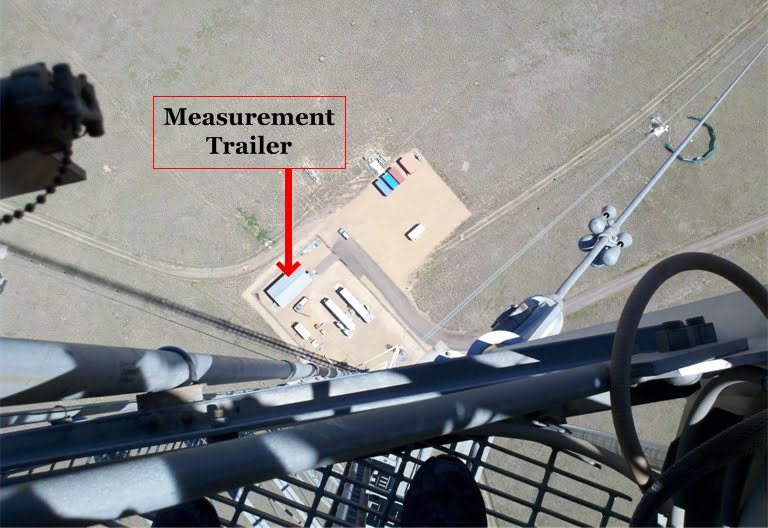
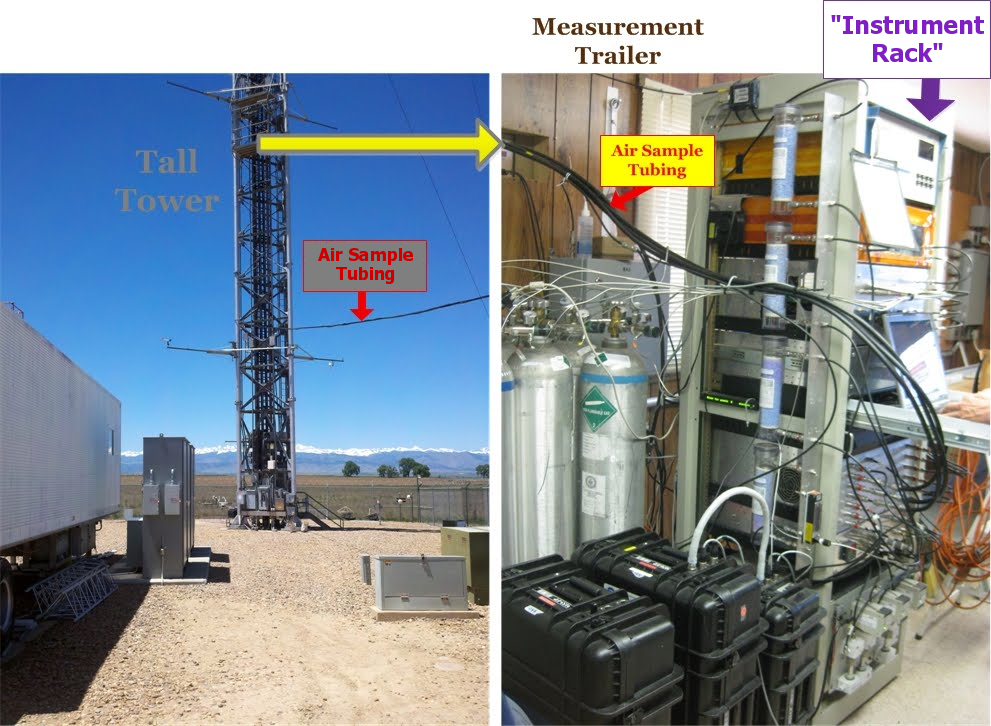
Unlike most of the towers used for greenhouse gas measurements, the BAO tower was built specifically for atmospheric studies, and is used to measure everything from temperature to wind speed to the amount of ozone in the local atmosphere. The CCGG group has their own equipment to measure Carbon Dioxide (CO2) and Carbon Monoxide (CO) continuously at the base of the tower housed in the measurement trailer. Discrete flask samples are also taken every other day from 300 m (984 ft) above the ground. The picture below shows the location of the measurement trailer from the top of the tower.
Flask Sampling
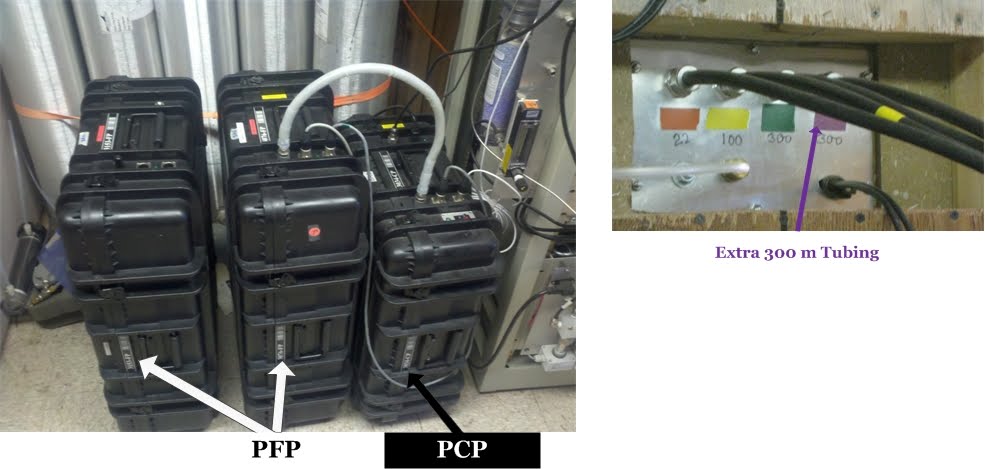
Not only are continuous measurements taken at the BAO tall tower, but discrete flask samples are also taken every 2 days from the 300 meter level on the tall tower. There is a separate run of tubing up to the 300 meter level of the tall tower specifically for the flask sampling procedure. A Programmable Compressor Package (PCP) and a Programmable Flask Package (PFP), which are usually used for aircraft sampling, are located in the measurement trailer to take flask samples that will later be measured back at the CCGG Boulder Central Facility. The PCP contains the pumps that pushes the ambient air from the tower into the sample flasks located in the PFP. The data logger triggers when flask samples should taken, but otherwise the flask samples are separate from the instrument rack. To learn how the PCP and PFP collects air samples, check out Equipment and Technique under the aircraft section of the air sampling network.
Instrument Rack
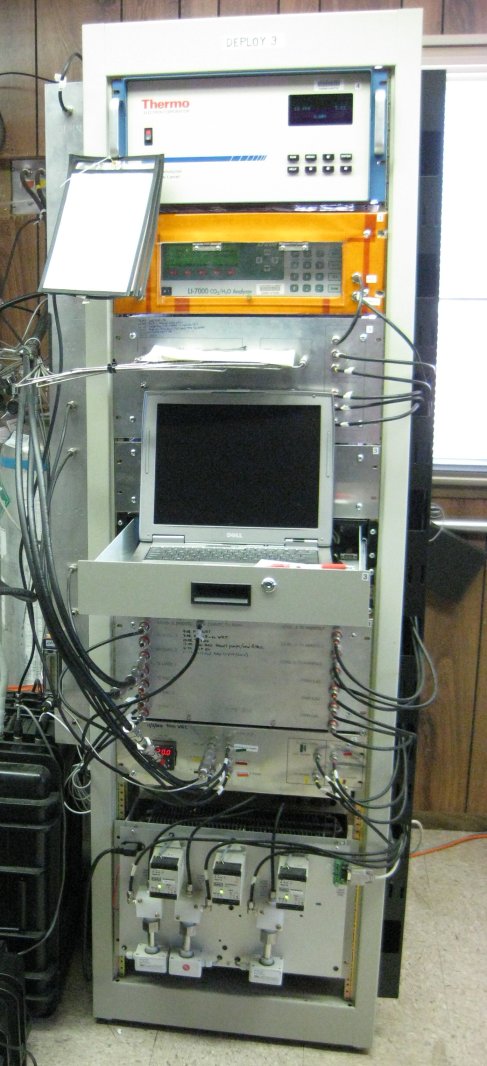
In-situ CO2 and CO concentrations are measured, recorded, and sent back to the CCGG group for storage and analysis all through this instrument rack made up of the following components:
Reference to any specific commercial products, process, or service by trade name, trademark, manufacturer, or otherwise, does not constitute or imply its endorsement, recommendation, or favoring by the United States Government.
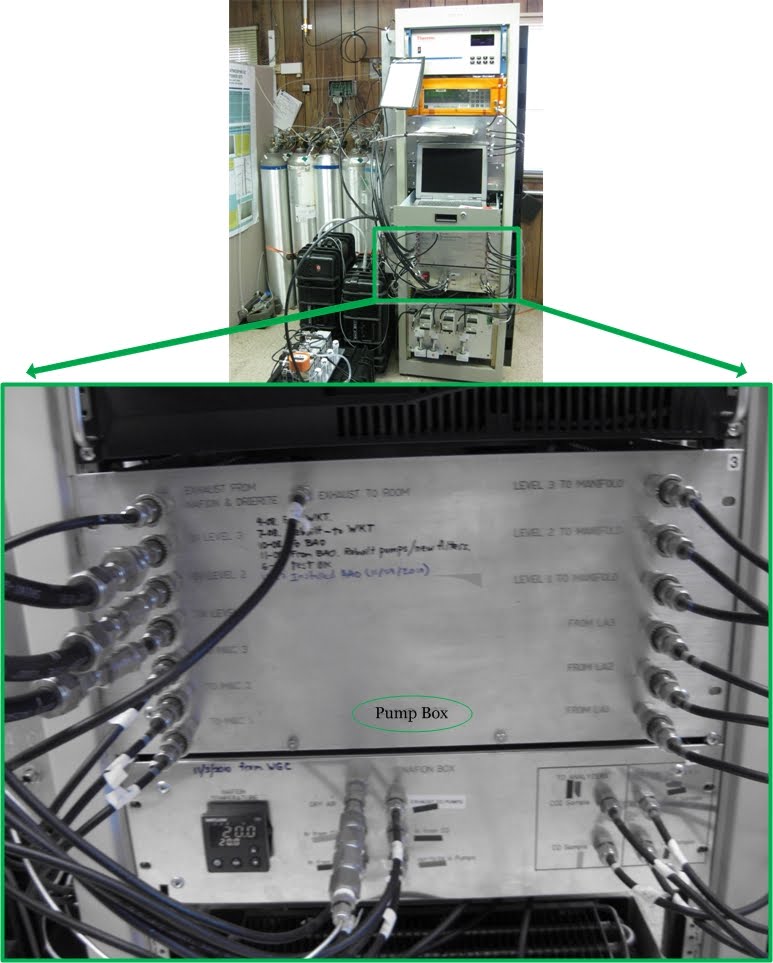
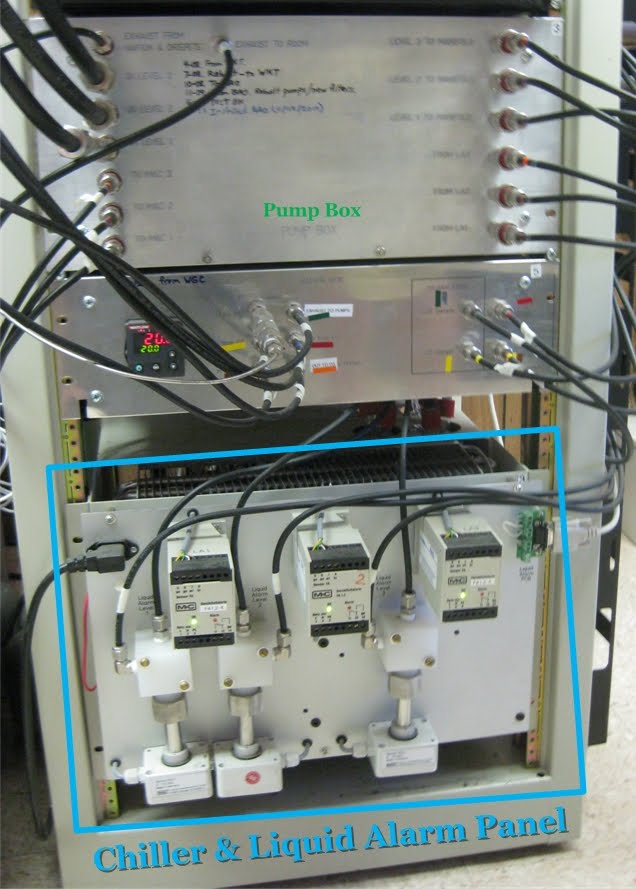
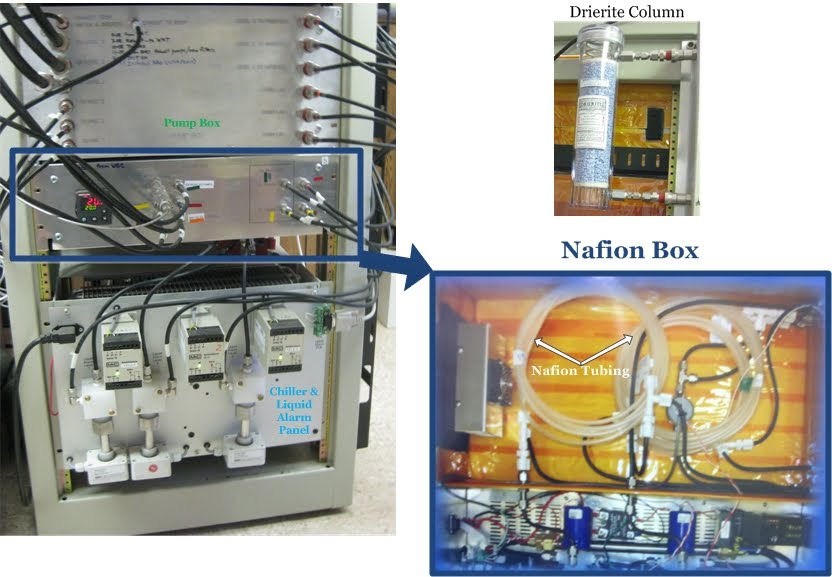
The Pump Box
The air that is sampled from the atmosphere (ambient air) at the various heights on the tower must be pulled into the tubing and into the analyzers within the trailer. That job is up to the Pump Box, which allows ambient air to be pumped through the tubing into the various instruments in the instrument rack. The ambient air is pulled into the pump box with one pump for each incoming line. A filter is also located in the pump box to prevent water that may have gotten in the line from getting into the other instruments.
Chiller and Liquid Alarm Panel
Water vapor can really make measuring trace gases difficult, so to fix this problem we try to get rid of as much of the water as possible from the air sample. The chiller is the first line of defense in getting rid of water (H2O) from the air sample, and the liquid alarm tab-panel's job is to detect whether liquid water is still present in the tubing after flowing through the chiller. If liquid water is detected in the tubing, the liquid alarm panel shuts down the pump to protect the equipment downstream. The chiller maintains a temperature of 1.5ºC (35ºF) in order to "squeeze" the water out of the air. This does not get rid of all the water in the air, which is why the air sample flows through another "water-exterminating" device downstream in the Nafion® box.
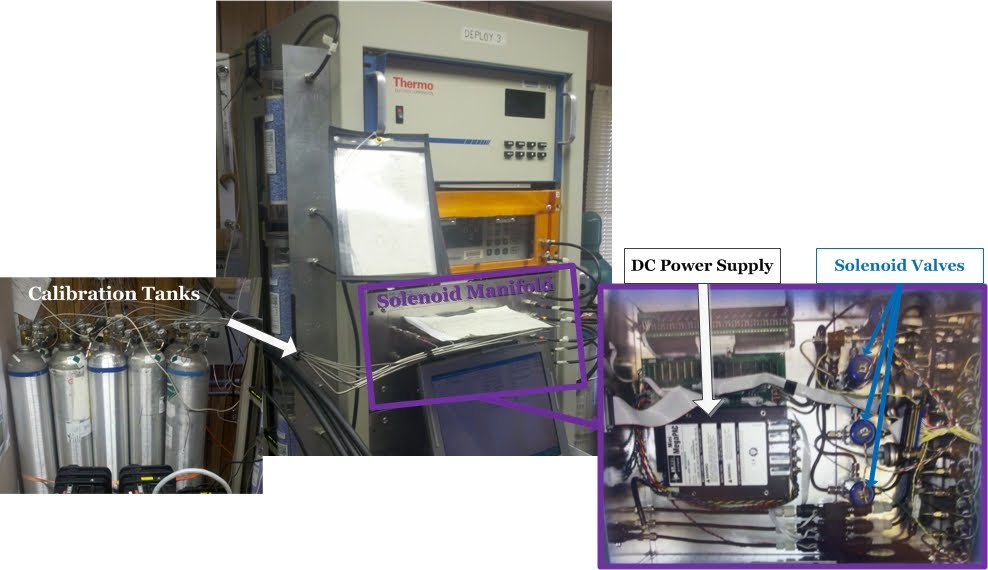
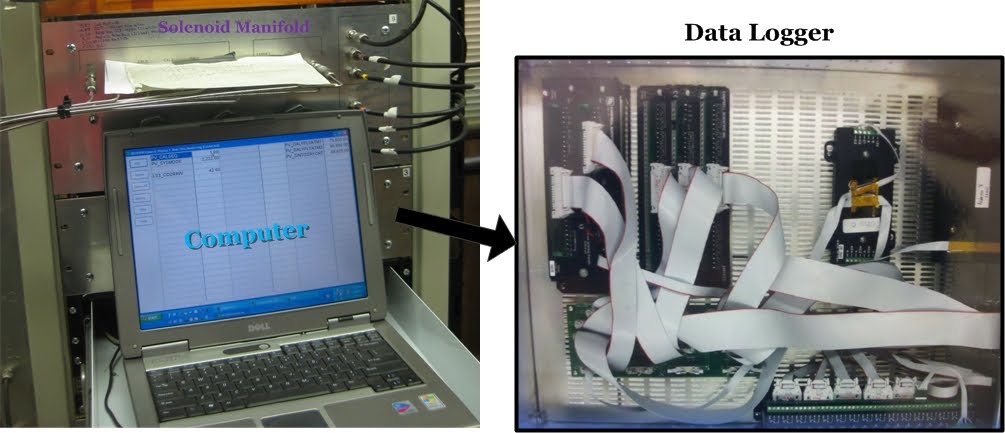
Solenoid Manifold
The solenoid manifold acts like a traffic cop, it directs which way all the air goes. Not only do the three tower samples flow through the solenoid manifold, but 10 calibrated air tanks are also connected to the solenoid manifold. The calibration tanks, "cal" tanks for short, are used by the CO and CO2 analyzers to reference measurements from. The calibration air and ambient tower air are all directed by solenoid valves [electromechanical valves controlled by an electric current through a solenoid (a coil of wire like a spring)]. A direct current (DC) power supply is also housed within the solenoid manifold to power the solenoid valves and any other instruments in the instrument rack that require DC power.
Nafion® Drier
The sample air is dried further by flowing the air through a Nafion® dryer. This consists of two layers of tubing, a plastic Teflon outer layer and a Nafion inner layer. The ambient air flows through the inner Nafion tubing. Dry air flows through the outer tubing (this dry air is actually the same ambient air after it has flowed through the CO2 analyzer, but dried even more by flowing through Drierite chemical chips that absorb water). The inner Nafion tubing is a special tube that actually absorbs water from the air and acts as a membrane that allows water to be transferred from the ambient air to the dry air in the outer tubing. Ambient air that is heading to the CO2 analyzer passes through one 4 meter strand of Nafion tubing, but air going to the CO analyzer needs to be even drier, so it passes through two 4 meter strands of Nafion tubing. If you want more information on the Nafion drying system, check out the link below: Nafion® Dryers and Humidifiers: The Ten Most Common Questions.
CO2 and CO Analyzers
For in-situ (continuous) measurements, the sampled ambient air from the different heights on the tall tower are all run through both a Thermo Electron Corporation carbon monoxide (CO) analyzer called a TECO analyzer and a carbon dioxide (CO2) analyzer called a LICOR analyzer. Both of these analyzers measure the concentrations of CO and CO2 based on the fact that the gases being measured absorb infrared radiation at specific wavelengths. The TECO analyzer passes a beam of infrared radiation at 4.6 micrometers (0.0000046 meters) through the sample air and detects how much of that radiation was absorbed by the air sample. That tells us how much CO is in our air sample. A similar technique is used by the LICOR analyzer, except it uses a beam of infrared radiation at 4.255 micrometers (0.000004255 meters) to measure how much CO2 is in the air sample. These infrared wavelengths are chosen because they are the wavelengths at which CO and CO2 absorb the most efficiently.
The air entering the analyzers is carefully temperature, pressure, and flow controlled to ensure very accurate measurements are recorded. The analyzers use thermostats to keep the temperature constant to within 0.1ºC (0.2ºF), and the pressure and air flow are controlled very precisely by pressure gauges and flow meters.

Why is Temperature, Pressure, and Flow Important?"
The Ideal Gas Law
PV = nRT
tells us that pressure (P), volume (V), the amount of gas in the volume (n), and temperature (T) are all related. R is the ideal gas constant and cannot change. If we change any one of these variables, then another variable must change too. For instance, if the pressure (P) drops, then either the volume (V) increases, the amount of gas (n) decreases, or the temperature (T) decreases to keep the equation in balance. In our system, the volume cannot change. And if we control the temperature very carefully, only pressure and the amount of gas can change. This means that the more gas inside the volume, the higher the pressure.Calibrating the Analyzers
Although the CO2 and CO detectors are very precise, they are not quite precise or accurate enough. If you’ve already taken the virtual tour of the Calibration Lab, you’ll have learned about how we calibrate to make sure that all our instruments are “synchronized”. The 10 cal tanks at the tower are Tertiary standard tanks that have been very accurately and precisely calibrated against a set of Primary standards. Air from the cal tanks is run through the analyzers on 1/2 hour to 12 hour intervals. Since the concentrations of CO2 and CO in the cal tanks are known, we can check that the analyzers are obtaining the correct measurements. This makes sure the instrument is not "drifting" over time in its measurements. More about how calibrations work is explained in the Calibration Lab section.
Computer and Data Logger
The computer and data logger jointly collect the data from the analyzers and the various instruments in the instrument tower and allow NOAA scientists to control their operation. This is when the raw data from the CO2 and CO analyzers is calibrated. The data from the cal tanks is used to adjust the measurements from the actual tower inlet lines to the final, accurate concentrations. Each time the solenoid manifold switches to a different inlet line or cal tank, the first few minutes of measurement are a mixture of the two, and this data has to be discarded. In fact roughly 80% of the CO and CO2 raw measurements recorded by the analyzers are discarded. The end result is one 30-second averaged measurement every 5 minutes. The diagram below shows the computer and the inside of the data logger.
 Previous