Given the regional context, what has been happening in Colorado?
Images generated by the High Plains Regional Climate Center
Observations
Over the past year, Colorado has seen drier and warmer than normal conditions. Click on a station in the map (or the arrow next to the station name) to see the time series for July 2011 to July 2012 for that station.
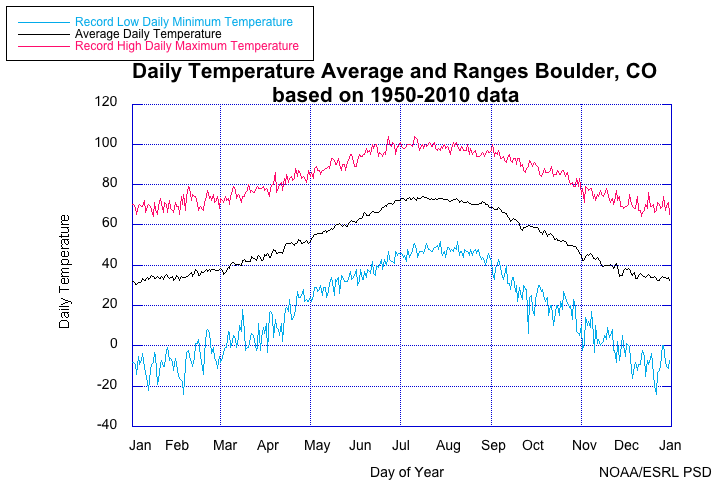
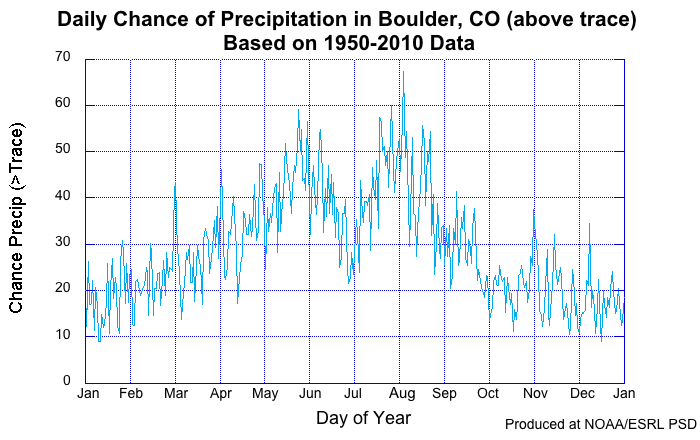
Climatology for Boulder, CO
The plots below show the record maximum, minimum and average temperatures (left) and the chance of precipitation (right) for Boulder, Colorado from 1950 to 2010. Some things to note about the graphs below in relation to 2012. Historically, the maximum high temperatures of the year (> 100 °F) occur in late June and early July. Also, note that there is a climatologically normal period of relatively dry weather at the end of June and into the beginning of July during the period between the usual wet spring season and the onset of the July-August monsoon season.
 |
 |
Temperature Trends
Since 1901, both the maximum and minimum June temperatures have risen. Maximum temperatures have generally increased by 1-1.5 degree Celsius (2-3 degrees Fahrenheit). Minimum temperatures have risen more in western Colorado than the
east.


Precipitation Trends
Trends in precipitation are most important on shorter timescales. In the image on the left below, one can see that over the past 2 years, the southern states have had generally dry conditions while the northwest and northeast have been wetter than average. This is consistent with the precipitation pattern associated with La Niña - a cooling of the Eastern Pacific Ocean. As described in the Southwest Climate Assessment: "It is likely that most of recent dryness over the Southwest is associated with a natural, decadal coolness in tropical Pacific sea surface temperatures." (Hoerling et al, 2012)

