HMT Satellite Support Imagery
|
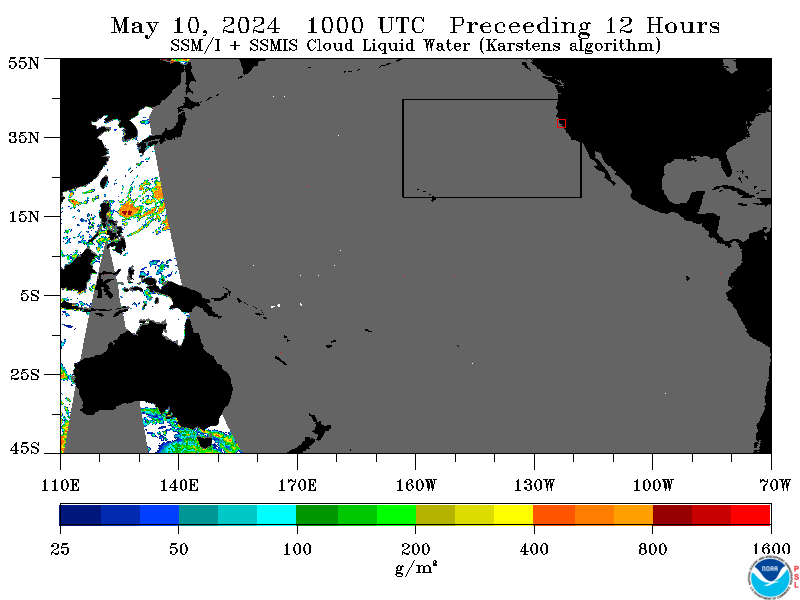
Full Pacific IWV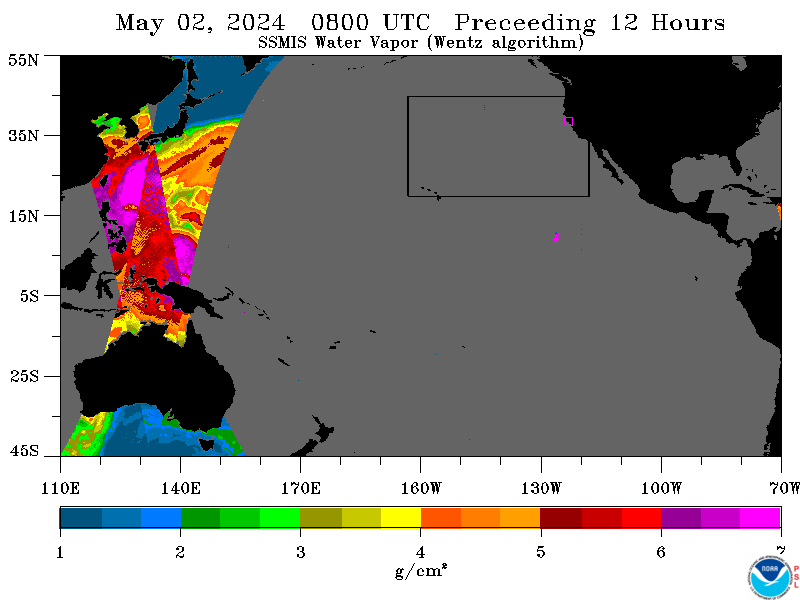 Cloud Liquid Water Rain Rate |
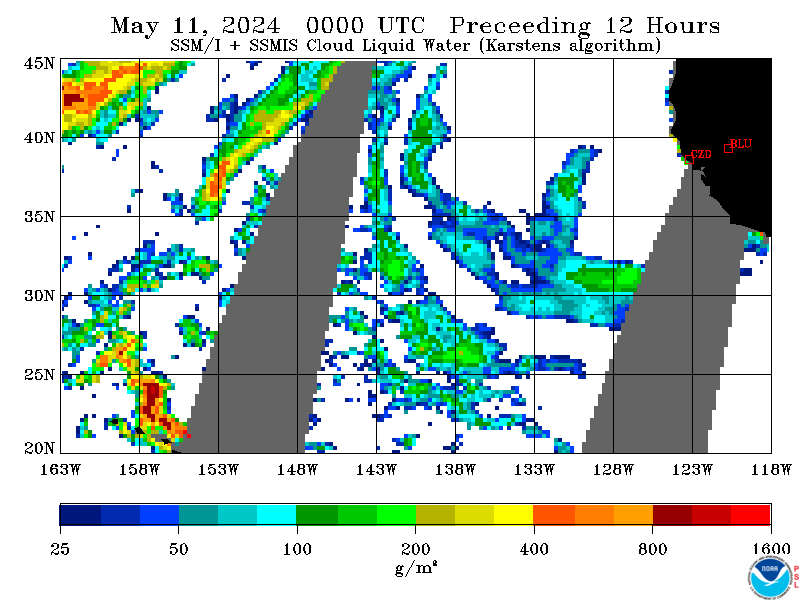
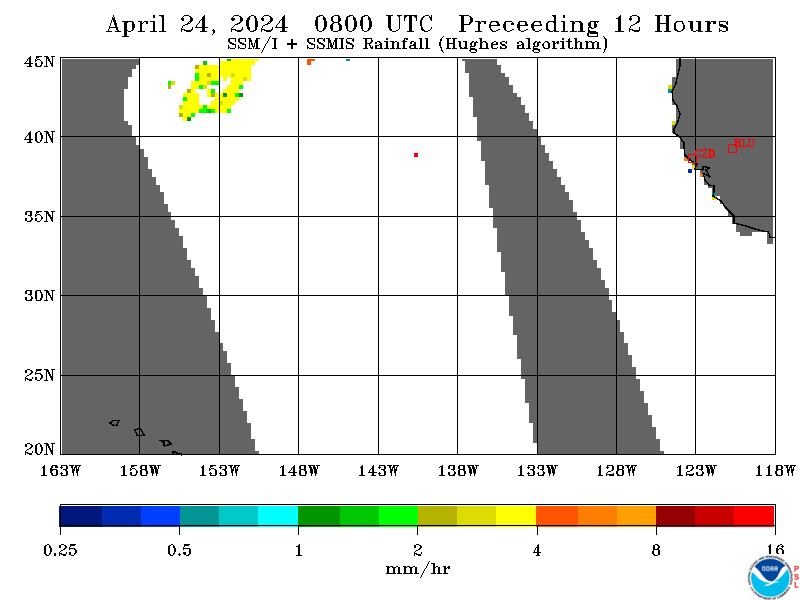
West Coast IWV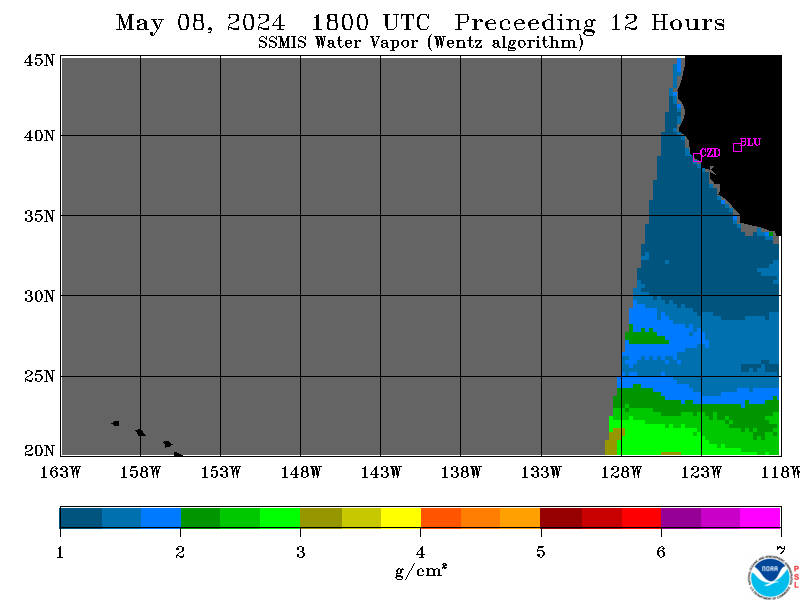 Cloud Liquid Water Rain Rate |
Hourly Individual Swath Imagery
MIRS Pacific Imagery
NESDIS Operational Blended IWV
CIRA Blended IWV
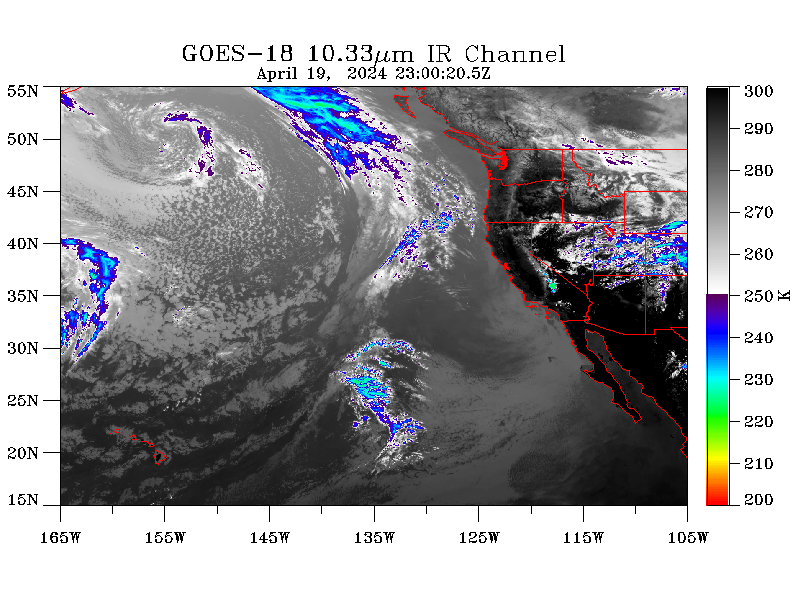
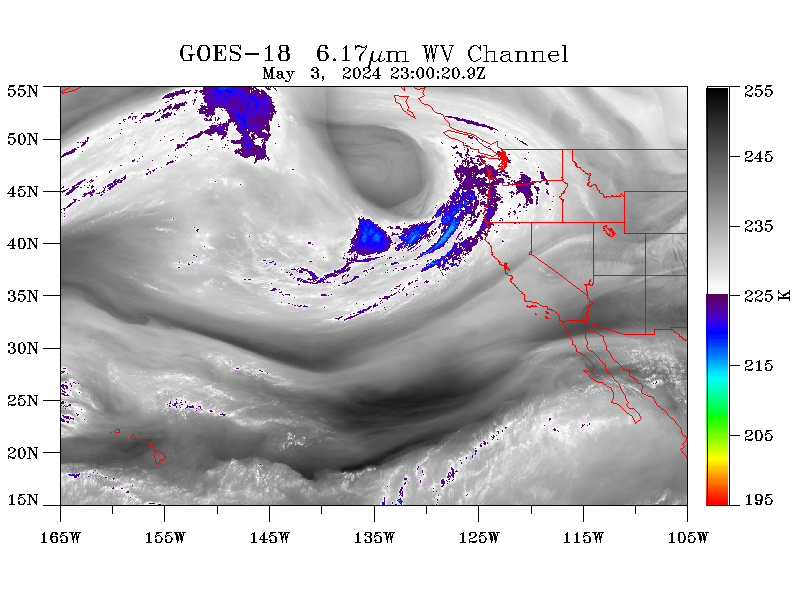
Geostationary Imagery
|
|
Visible Imagery and Operational Products
SSMIS IWV Imagery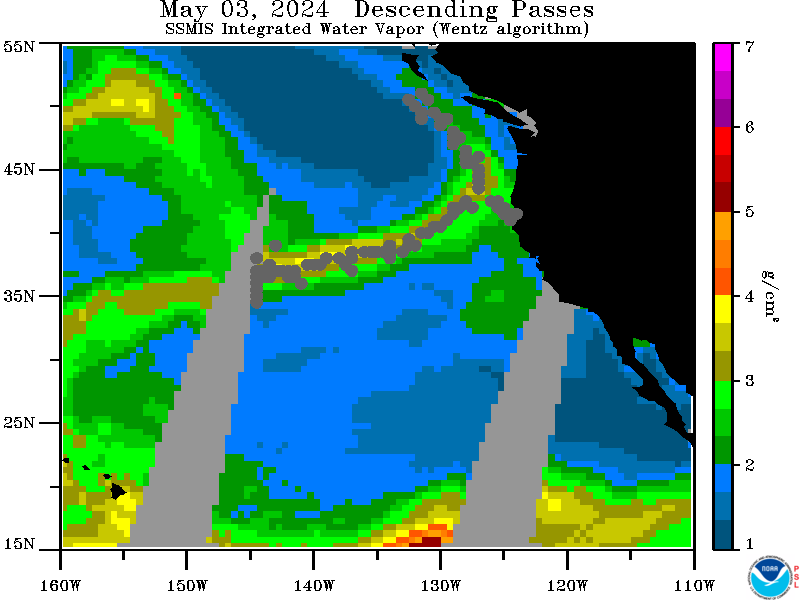 | GFS IWV Analysis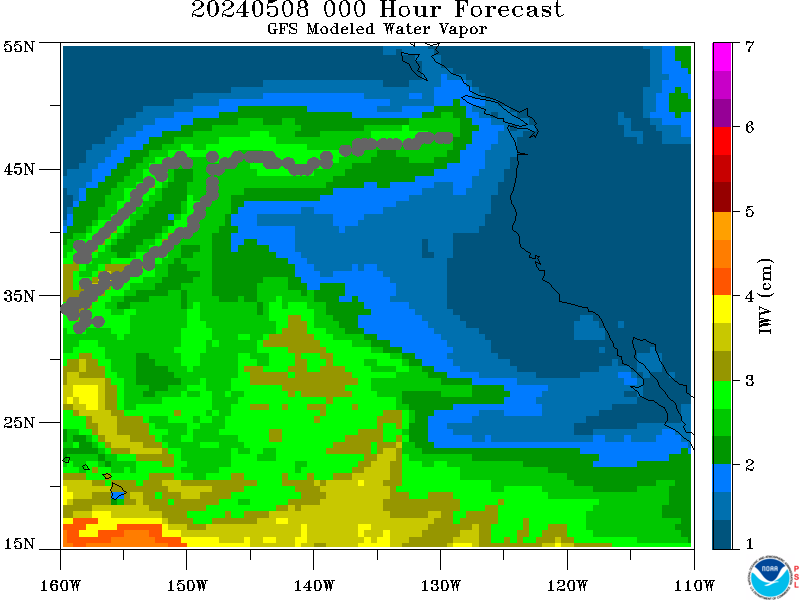 | GFS 24-hour IWV Forecast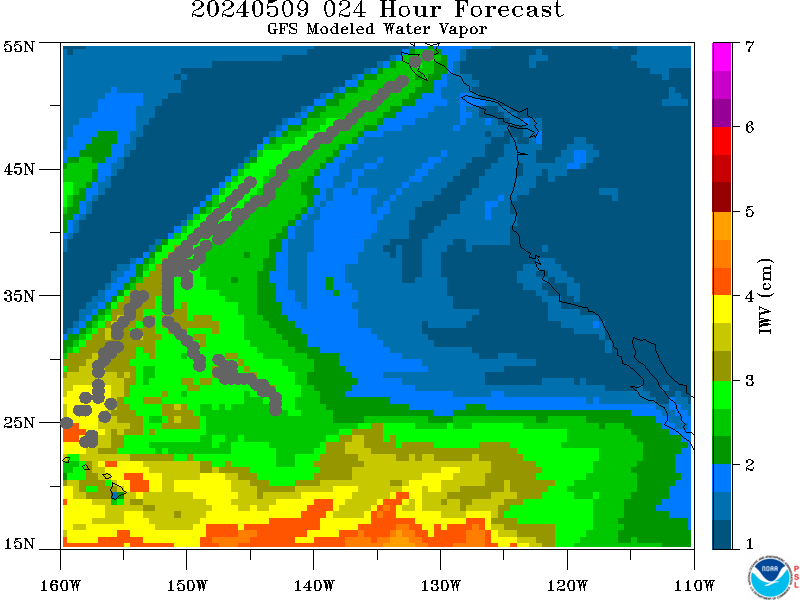 |
The SSMIS data are provided by NOAA/NESDIS, and Geostationary data are provided by NOAA/ESRL/GSD and NOAA/NESDIS/CLASS.
Disclaimer! Minimal quality control measures are taken with the real-time data feeds. As a result, occasional bad data may contaminate the images. For this reason, these images are intended for qualitative analysis only.