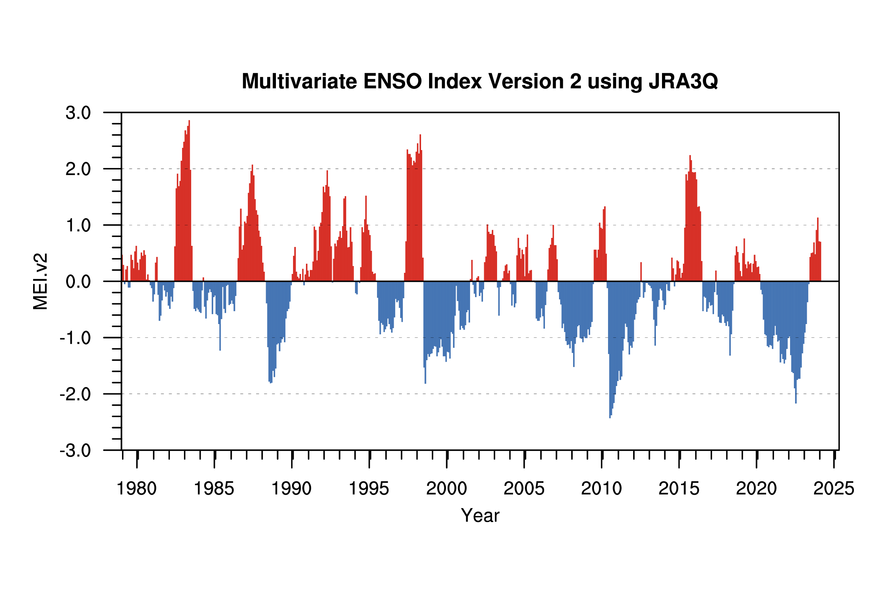
Multivariate ENSO Index Version 2 (MEI.v2)
The JRA-55 dataset used for the MEI V2 has been discontinued by the Japanese Meteorological Agency as of January 2024. We have switched to using the JRA3Q reanalysis which yields very similar results.
April 2024: The OLR dataset used to generate the MEIV2 is delayed at the source, so the MEIv2 will not update until that is available again.
April 2024: The OLR dataset used to generate the MEIV2 is delayed at the source, so the MEIv2 will not update until that is available again.
Overview
Update: As the JRA55 has been discontinued we were able to calculate the MEI V2 index using the JRA3Q Reanalysys dataset. The spatial resolution is 1.5x1.5 and all other calulation details are the same. The correlation between the JRA55 version and the JRA3Q version is .998. The El Niño/Southern Oscillation (ENSO) - a naturally occurring anomalous state of tropical Pacific coupled ocean-atmosphere conditions - is the primary predictor for global climate disruptions. These can persist over several seasons and thereby produce severe regional effects. An appraisal of the real-time status of ENSO is thus important for a host of climate services that inform societal responses and trigger policy actions for water supply, food security, health, and public safety. The MEI, which combines both oceanic and atmospheric variables, facilitates in a single index an assessment of ENSO. It especially gives real-time indications of ENSO intensity, and through historical analysis - provides a context for meaningful comparative study of evolving conditions. The bi-monthly Multivariate El Niño/Southern Oscillation (ENSO) index (MEI.v2) is the time series of the leading combined Empirical Orthogonal Function (EOF) of five different variables (sea level pressure (SLP), sea surface temperature (SST), zonal and meridional components of the surface wind, and outgoing longwave radiation (OLR)) over the tropical Pacific basin (30°S-30°N and 100°E-70°W). The EOFs are calculated for 12 overlapping bi-monthly "seasons" (Dec-Jan, Jan-Feb, Feb-Mar,..., Nov-Dec) in order to take into account ENSO's seasonality, and reduce effects of higher frequency intraseasonal variability. During the typical height of ENSO during late Fall/early Winter, the canonical features of atmosphere and ocean anomalies are shown schematically below based on a composite of 11 historical El Niño and La Niña events. Key features of composite positive MEI events (warm, El Niño) include (1) anomalously warm SSTs across the east-central equatorial Pacific, (2) anomalously high SLP over Indonesia and the western tropical Pacific and low SLP over the eastern tropical Pacific, (3) reduction or reversal of tropical Pacific easterly winds (trade winds), (4) suppressed tropical convection (positive OLR) over Indonesia and Western Pacific and enhanced convection (negative OLR) over the central Pacific (Fig. 1a). Key features of composite negative MEI events (cold, La Niña, Fig. 1b) are of mostly opposite phase. For any single El Niño or La Niña situation, the atmospheric articulations may depart from this canonical view.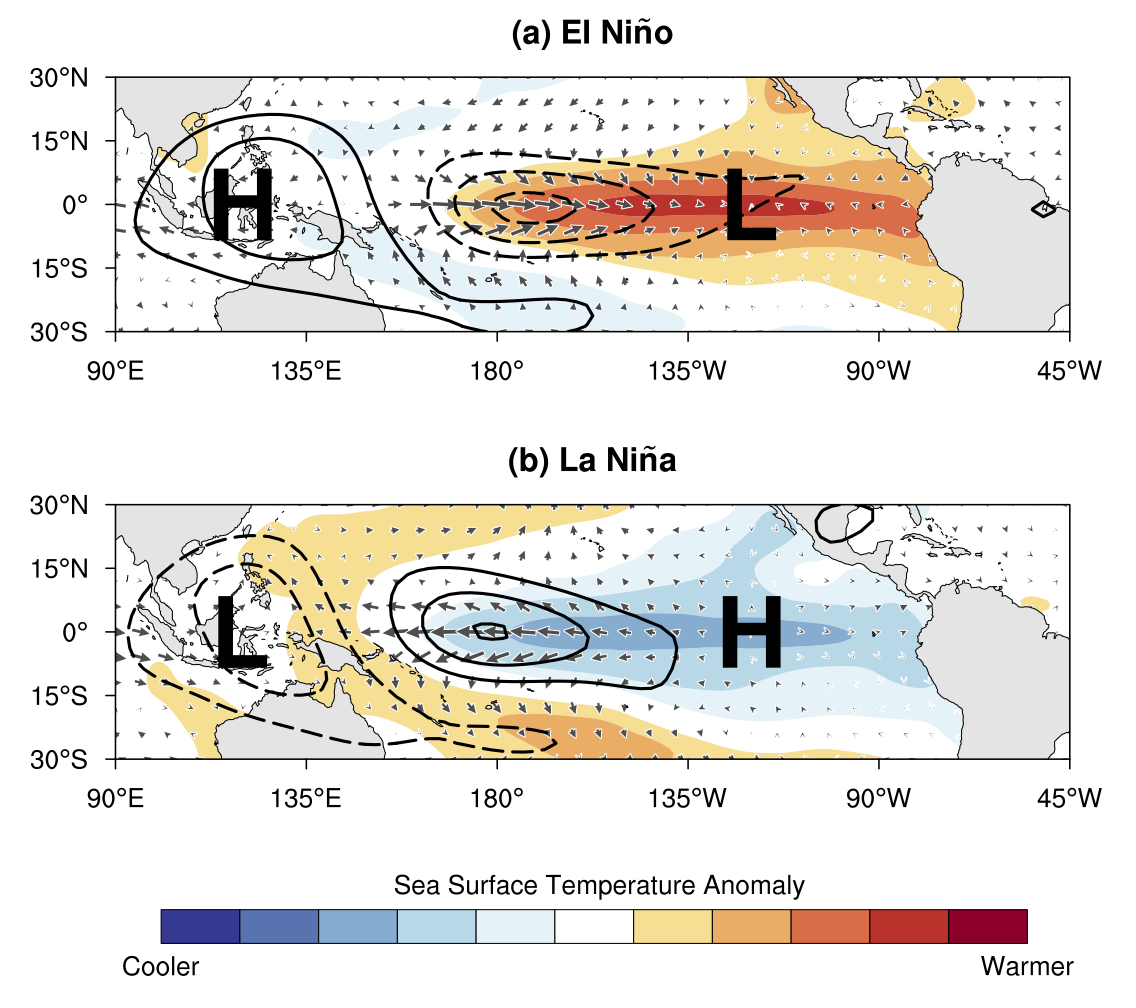
Fig. 1: Schematic diagram showing the physical mechanisms by which
the SST (shaded), OLR (contours), surface zonal and meridional winds
(vectors), and sea level pressure (represented by "H"
and "L" which indicate the high and low pressure center,
respectively) determine the wintertime Multivariate ENSO Index (MEI)
during (a) El Niño and (b) La Niña events. The schematic
is based on the composite anomalies for November-December (ND) drawn
from 11 warm events and 11 cold events during 1980-2016.
Methods
A new version of the MEI (MEI.v2) has been created that uses 5 variables (sea level pressure (SLP), sea surface temperature (SST), surface zonal winds (U), surface meridional winds (V), and Outgoing Longwave Radiation (OLR)) to produce a time series of ENSO conditions from 1979 to present. The MEI.v2 expands upon the original MEI developed by Wolter and Timlin (1993) which was calculated using 6 variables as proxies for ENSO relevant atmosphere and ocean conditions. In MEI.v2, the fields of SST, SLP, and surface zonal and meridional winds are obtained from the high-quality JRA-55 global reanalysis (Kobayashi et al. 2015). In contrast, the original MEI (Wolter and Timlin, 1993) used marine ship observations based on the International Comprehensive Ocean Atmosphere Data Set (ICOADS) and used near-surface air temperature as well as SST. The MEI.v2 also uses observations of OLR from NOAA Climate Data Record (CDR) of Monthly Outgoing Longwave Radiation (OLR), Version 2.7 (available from NOAA National Centers for Environmental Information (NCEI)); whereas the original MEI used ICOADS cloud cover fraction data. To produce the MEI.v2, all variables are interpolated to a common 2.5° latitude-longitude grid and standardized anomalies are computed with respect to the reference period of 1980-2018. As with the original version of the MEI (Wolter and Timlin, 2011), the MEI.v2 is calculated as the leading principal component (PC) time series of the Empirical Orthogonal Function (EOF) of the standardized anomalies of the above 5 combined variables over the tropical Pacific during 1980-2018. The EOF analysis is based on the covariance matrix and the analysis domain is the same as for the original MEI (30°S-30°N and 100°E-70°W, excluding the Atlantic Ocean and the land regions). A latitudinal weighting prior to the EOF analysis is applied. The EOF analysis for MEI.v2 is conducted for 12 partially overlapping 2-month "seasons" (e.g., Wolter and Timlin, 1993). To obtain MEI.v2 values before 1980 and after 2018, standardized anomalies maps relative to the 1980-2018 reference period are projected onto the leading EOF pattern. Because the OLR record starts in January 1979, the DJ 1979 MEI.v2 value is based on January 1979 OLR data only.MEI.v2 Values (JRA3Q)
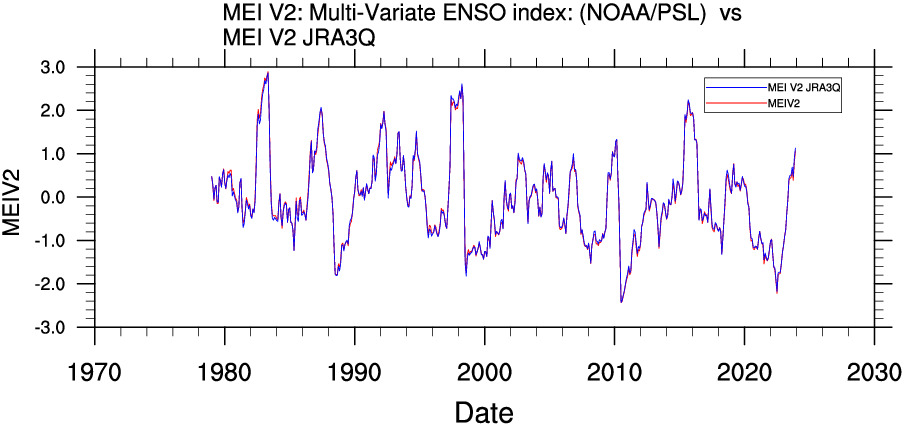
This page will be updated by the 10th of each month (depending on source data availability). For the period between 1979 and 2018, the ICOADS-based MEI and MEI.v2 are correlated at 0.95. The correlation between the JRA55 vs the JRA3Q based is .999. Last data update: 8 April 2024
MEI.v2 Values JRA55 and Comparison with Current JRA3Q-Based Index
The values for the MEI V2 from the JRA55 dataset (discontinued Jan 2024) are available below. We have compared the old JRA55 version to the new JRA3Q version for Jan 1979-Dec 2023. They are extremely similar (r=.9987) and we feel confident the version based on the JRA3Q can be used identically.
| Statistic Type | MEI V2 (JRA3Q) | MEI V2 (JRA55) |
|---|---|---|
| Mean | -0.060 | -0.057 |
| Standard Deviation | 0.98 | 0.98 |
| Skewness | 0.49 | 0.50 |
| Kurtosis | 0.18 | 0.17 |
| Slope | -0.020 | -0.019 |
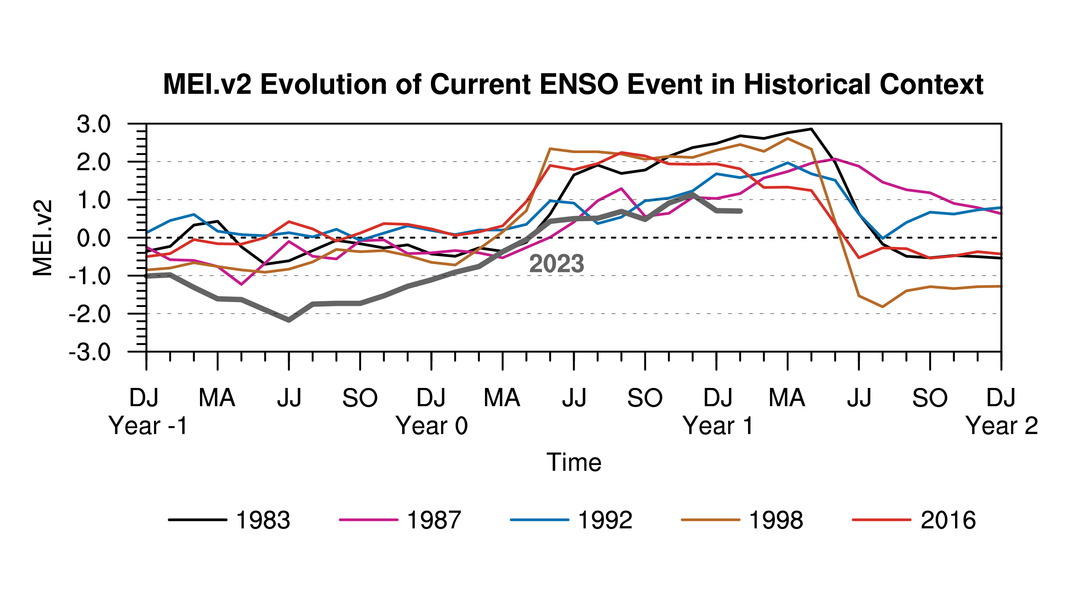
MEI.v2 Evolution of Historical ENSO Events
Temporal evolution of El Niño and La Niña events indicated by the MEI.v2. Shown are the top 5 warm and cold non-overlapping events since 1979. Year 0 corresponds to the year of the event in the legends. Click on image to enlarge.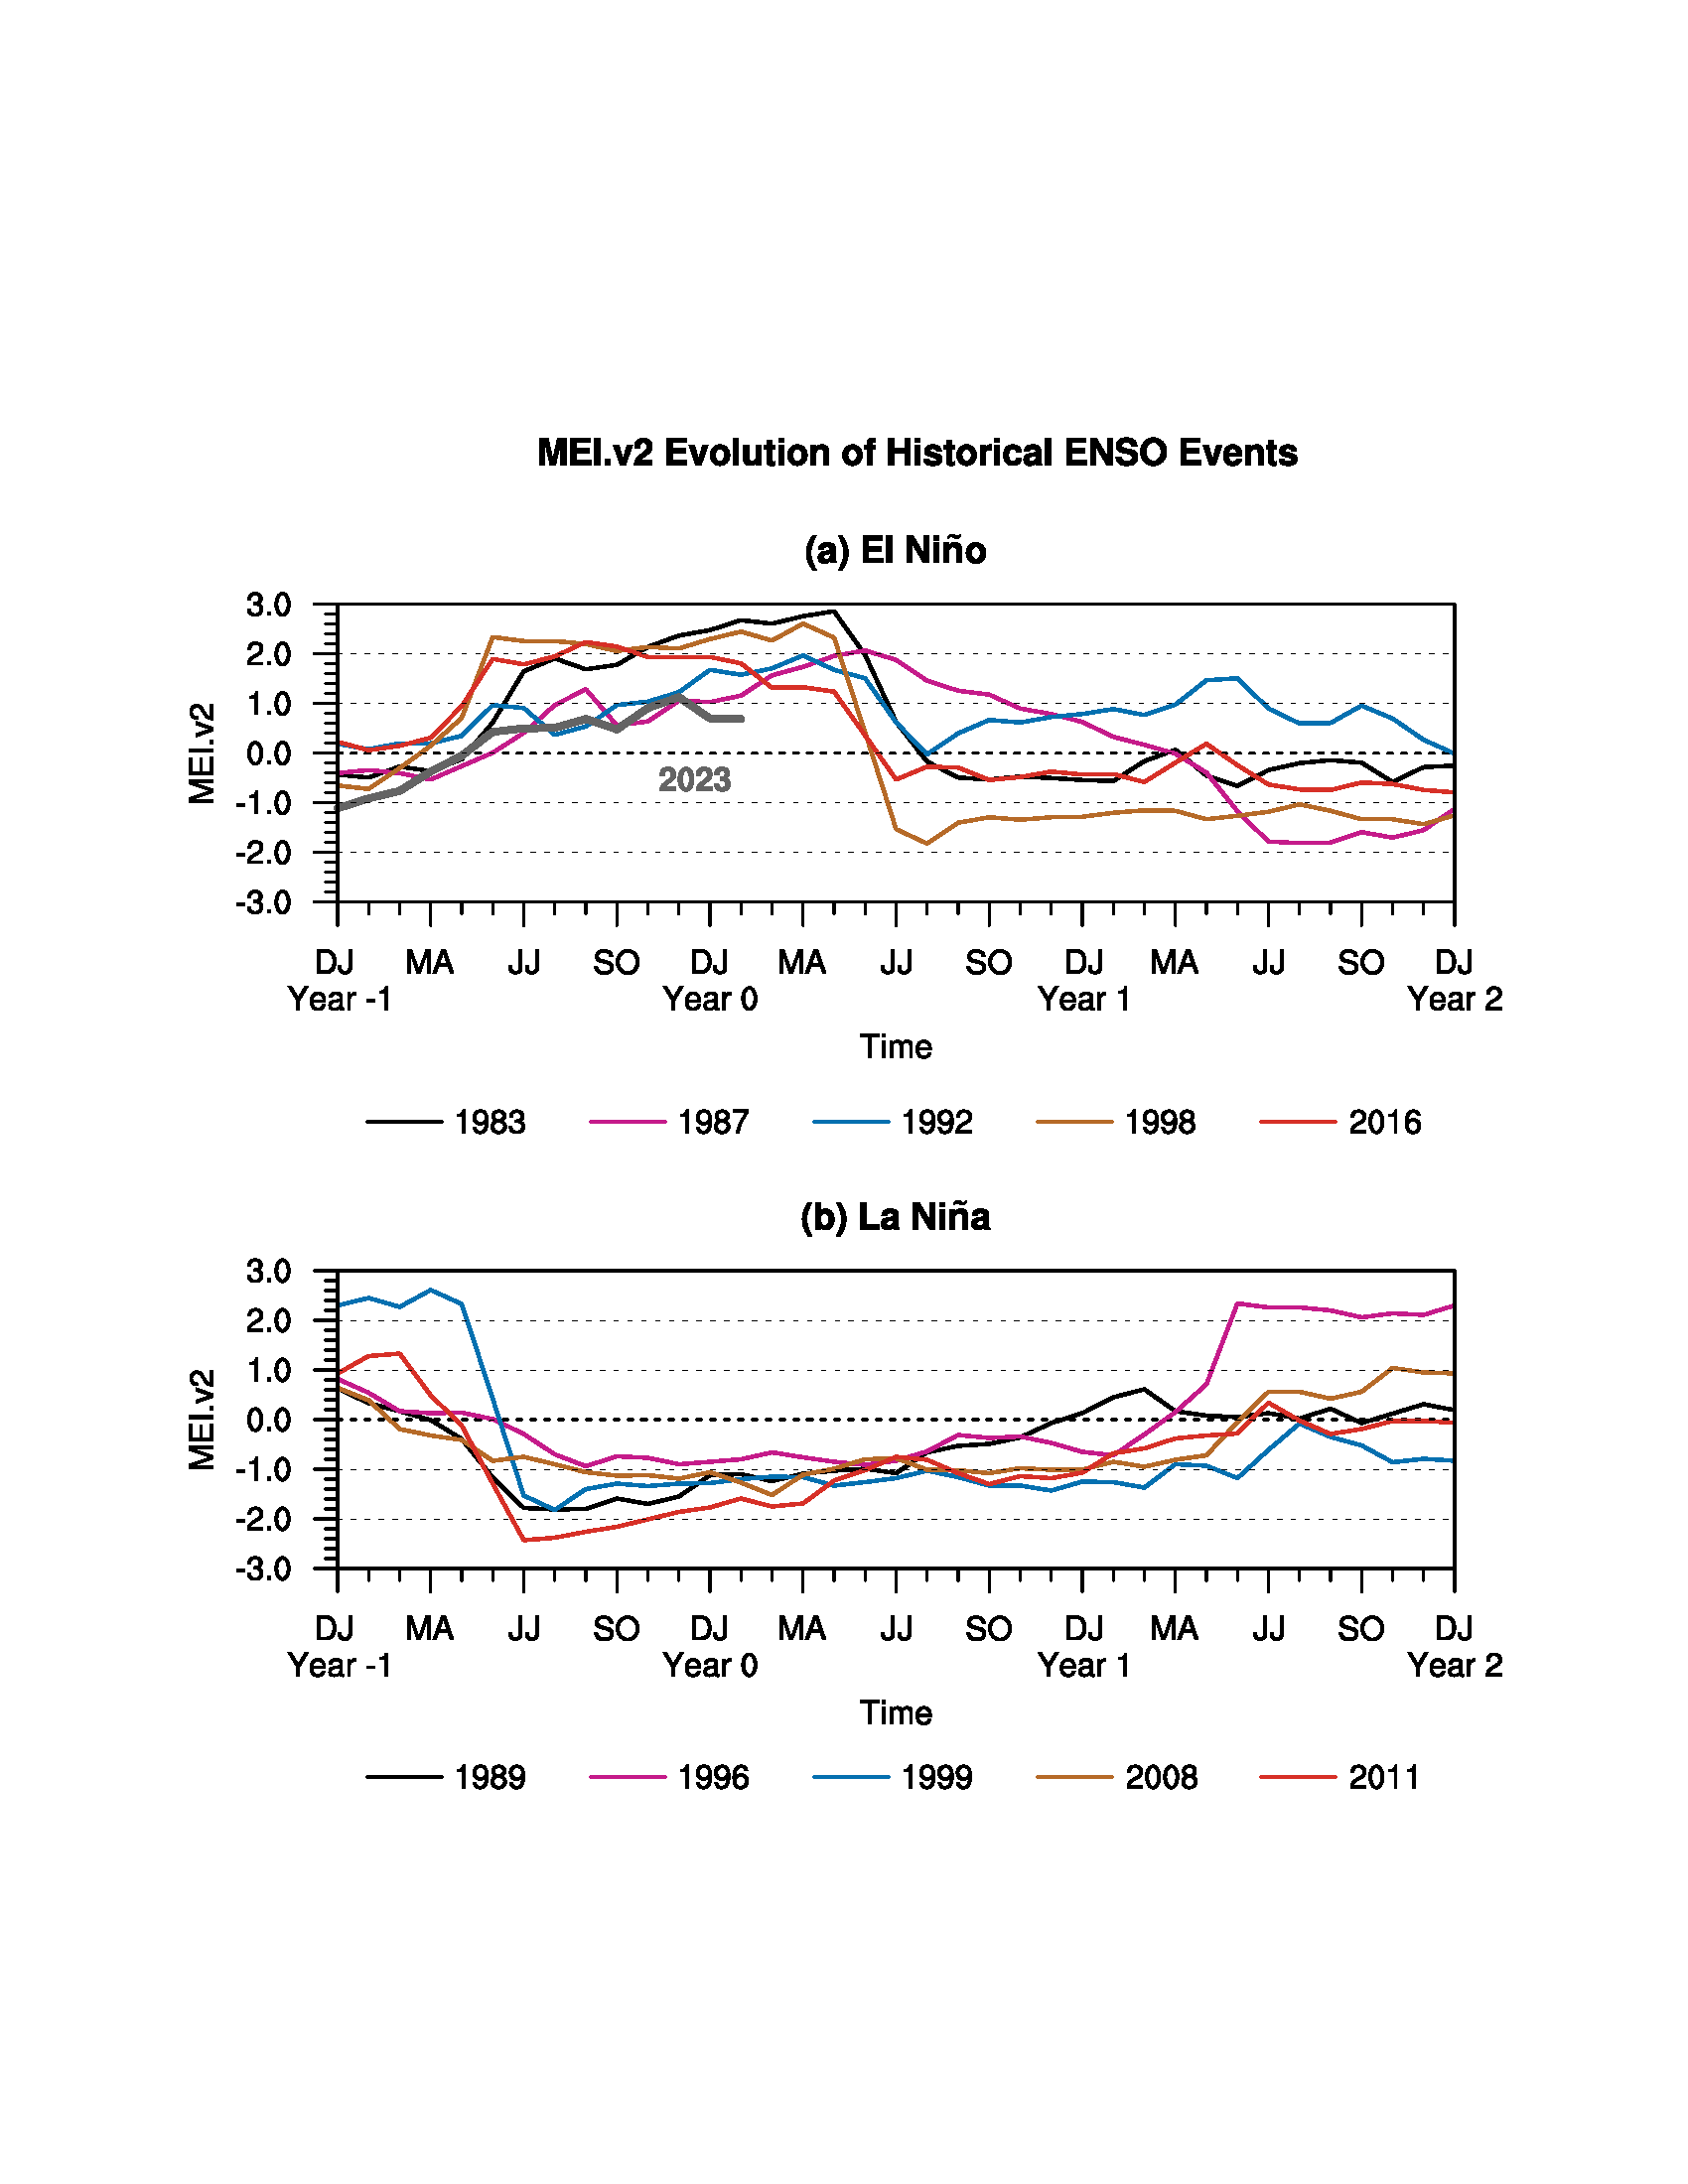
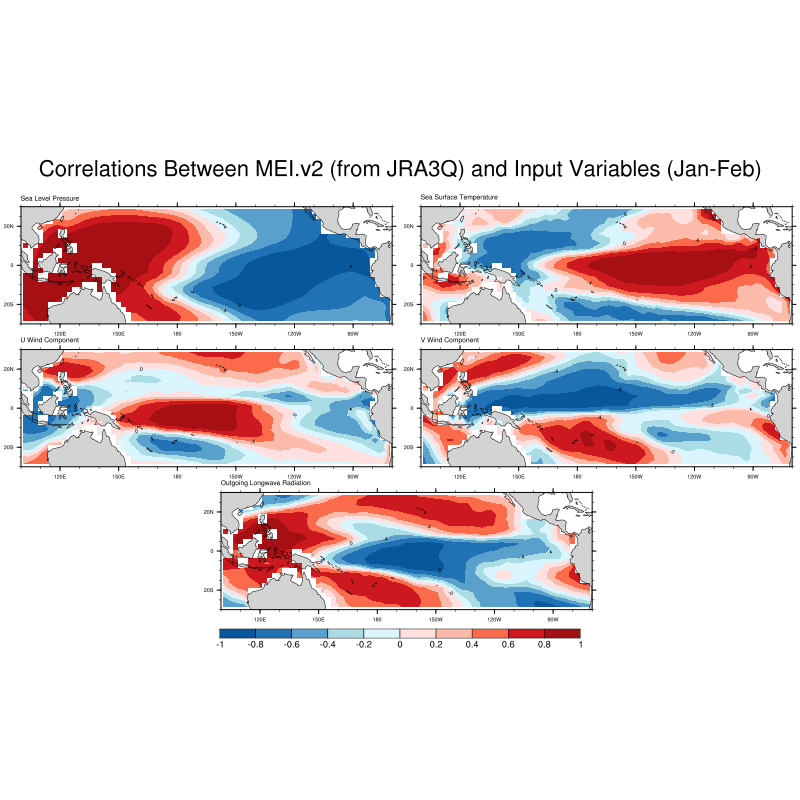
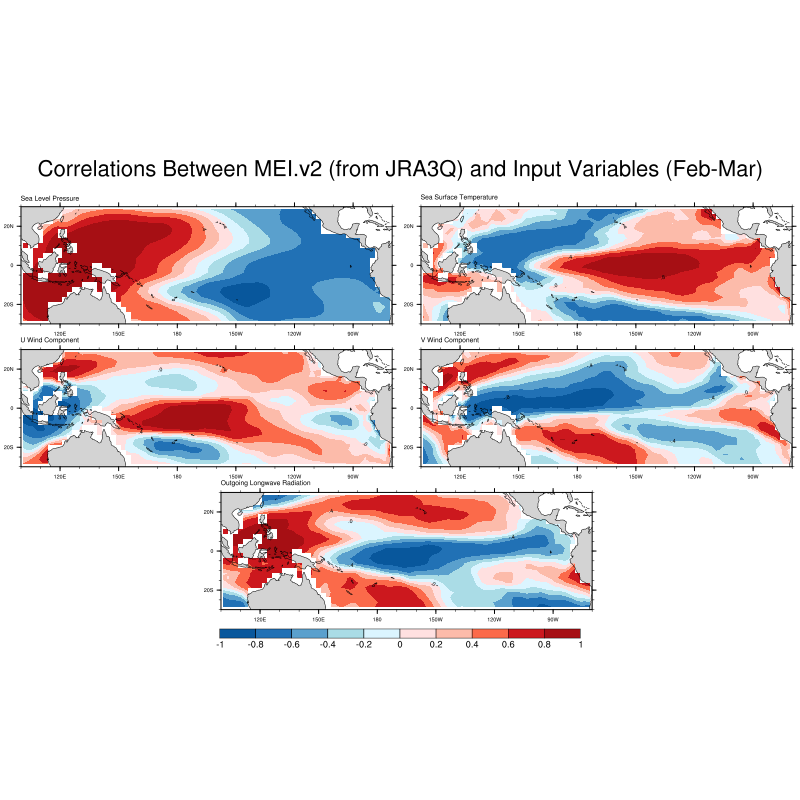
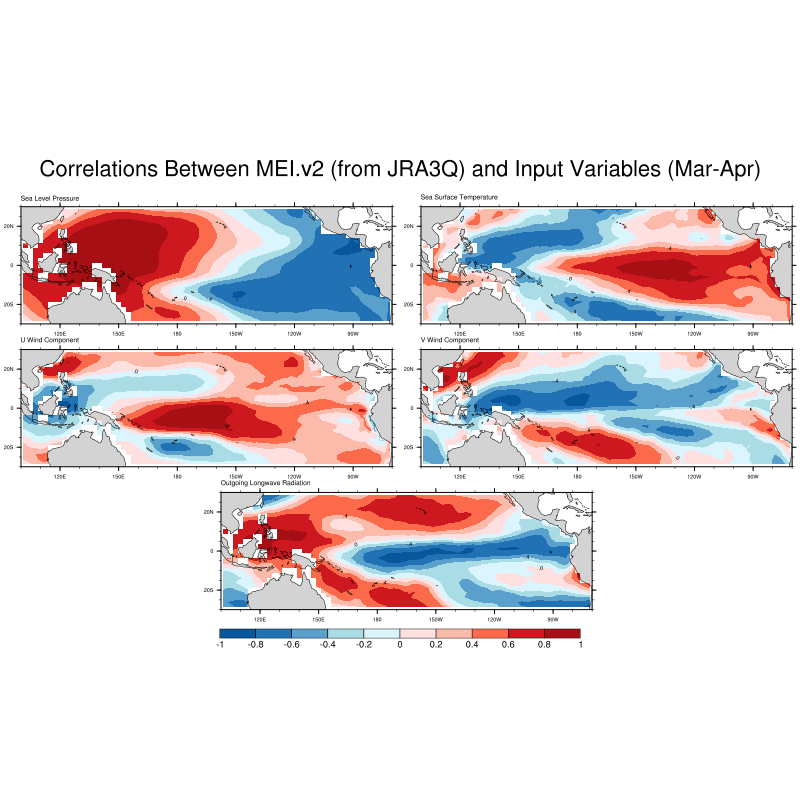
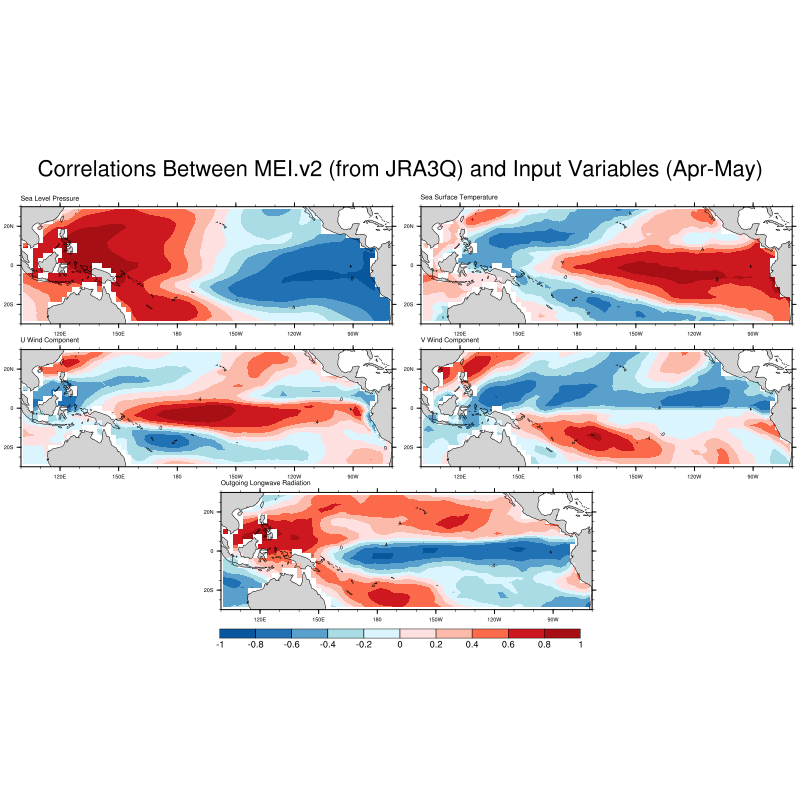
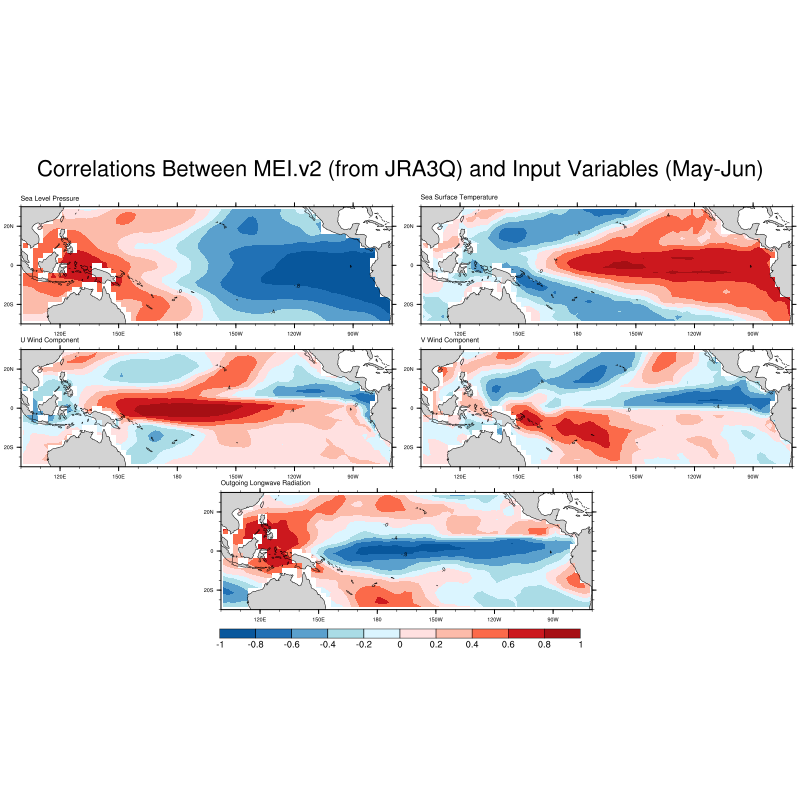
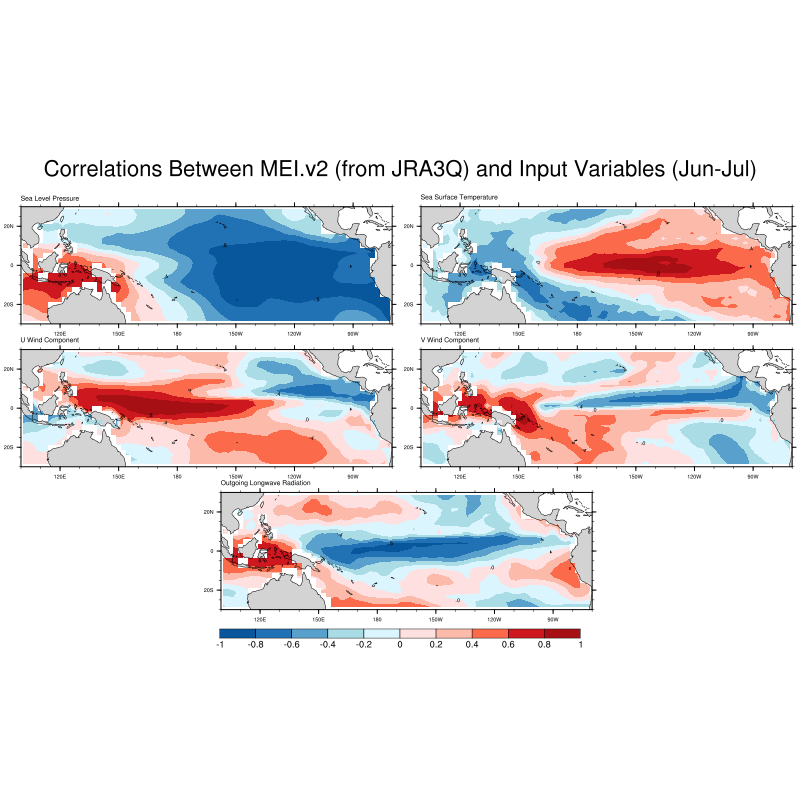
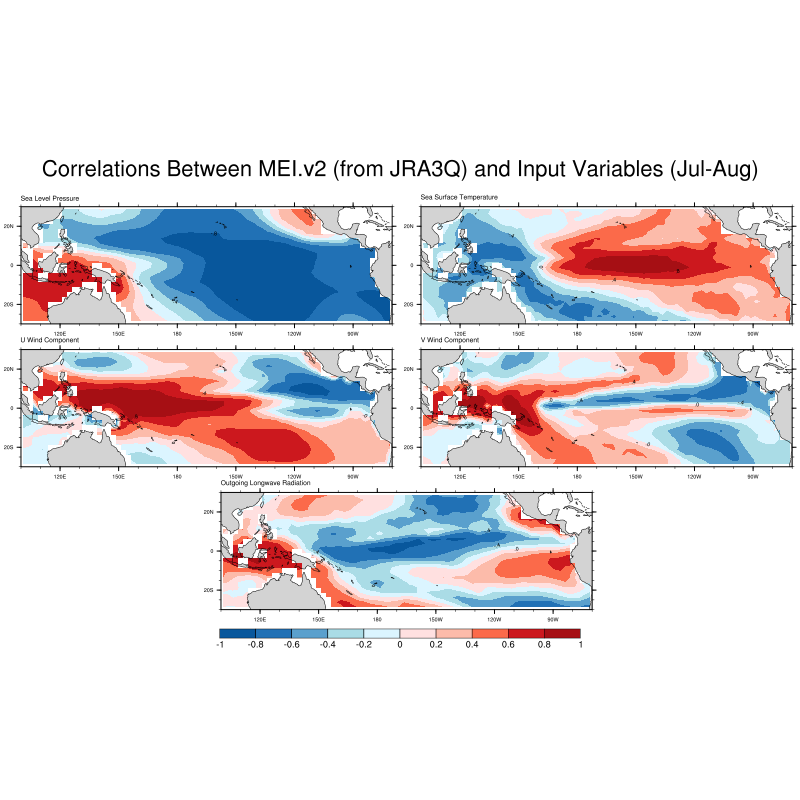
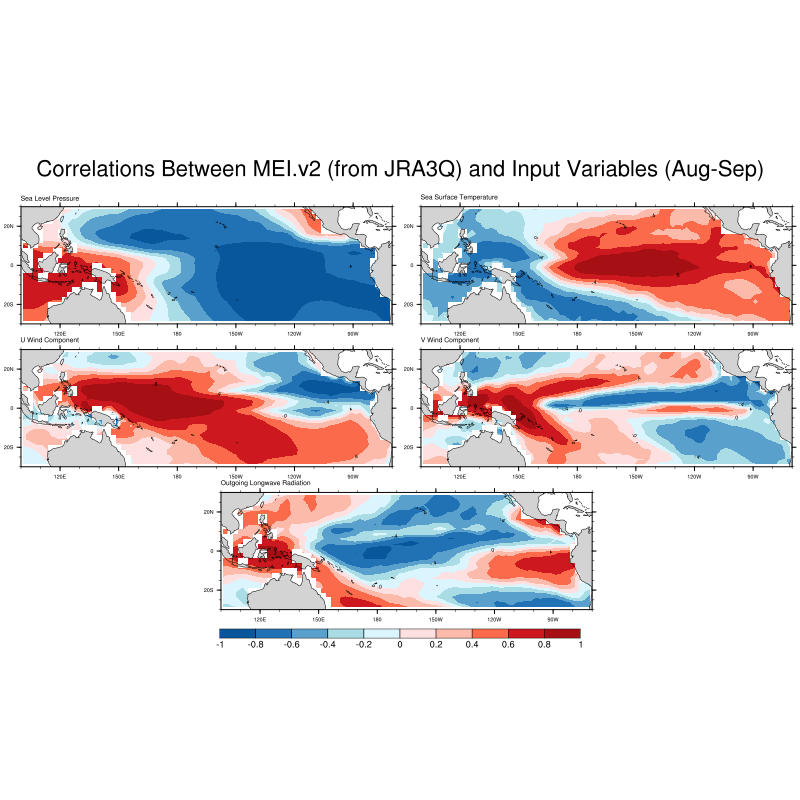
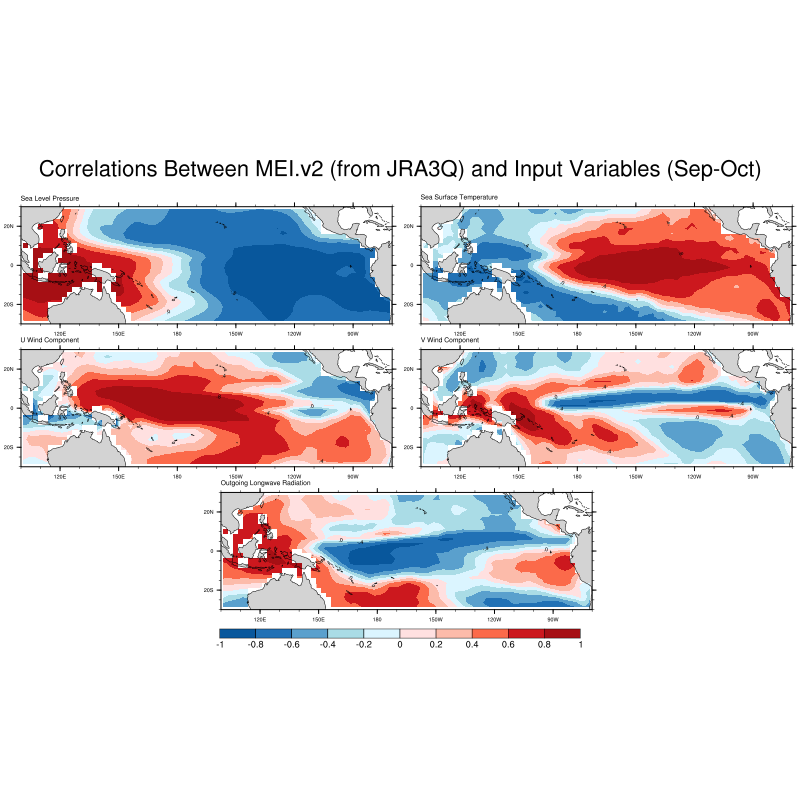
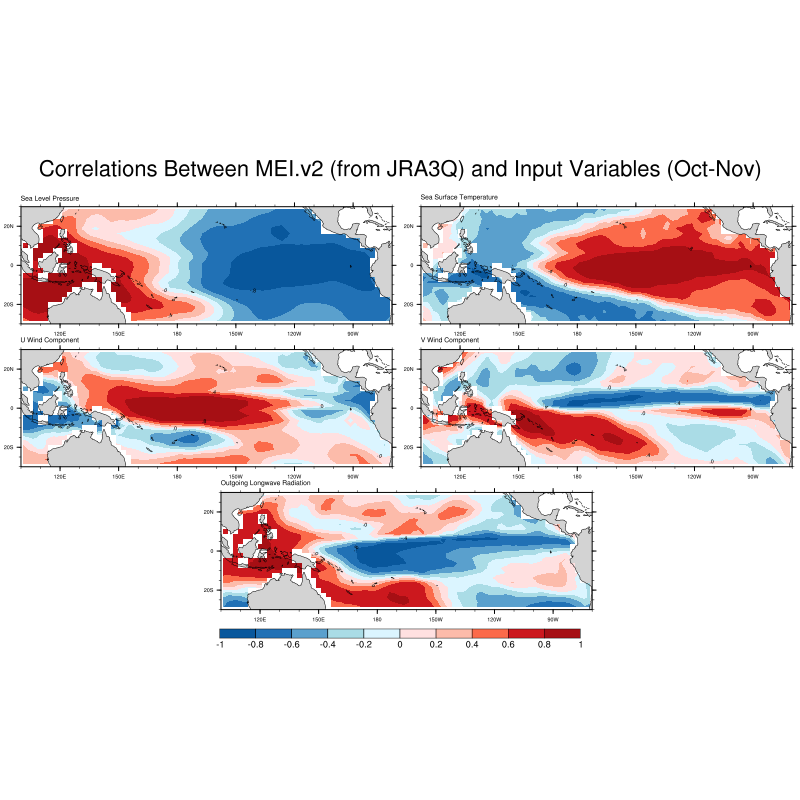
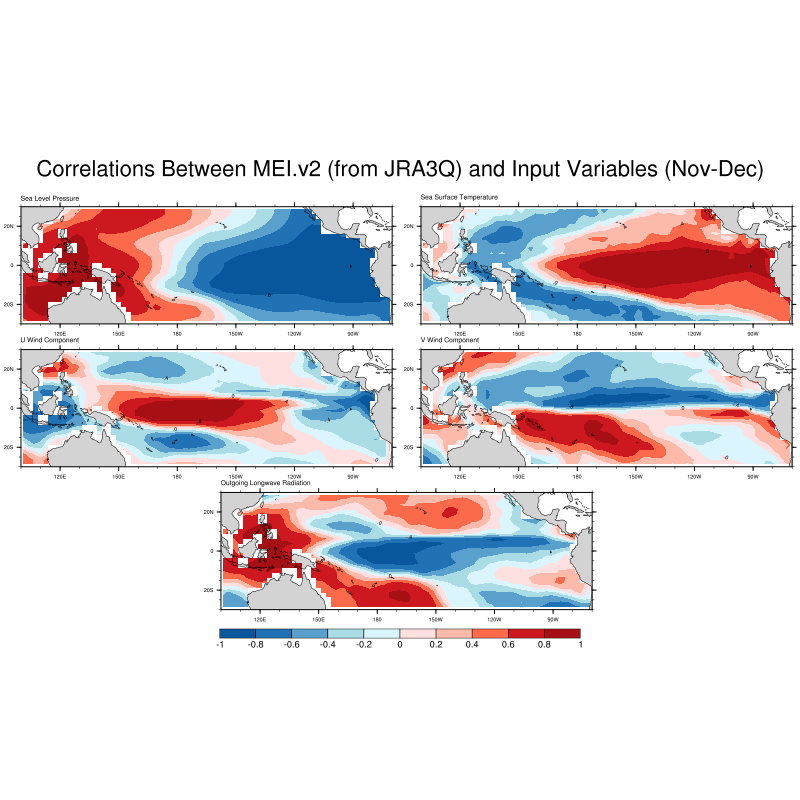
Correlation Maps
Maps of correlation coefficients between MEI.v2 and anomaly time series of the variables from which the MEI is derived for bi-montly overlapping seasons. Click on an image to enlarge.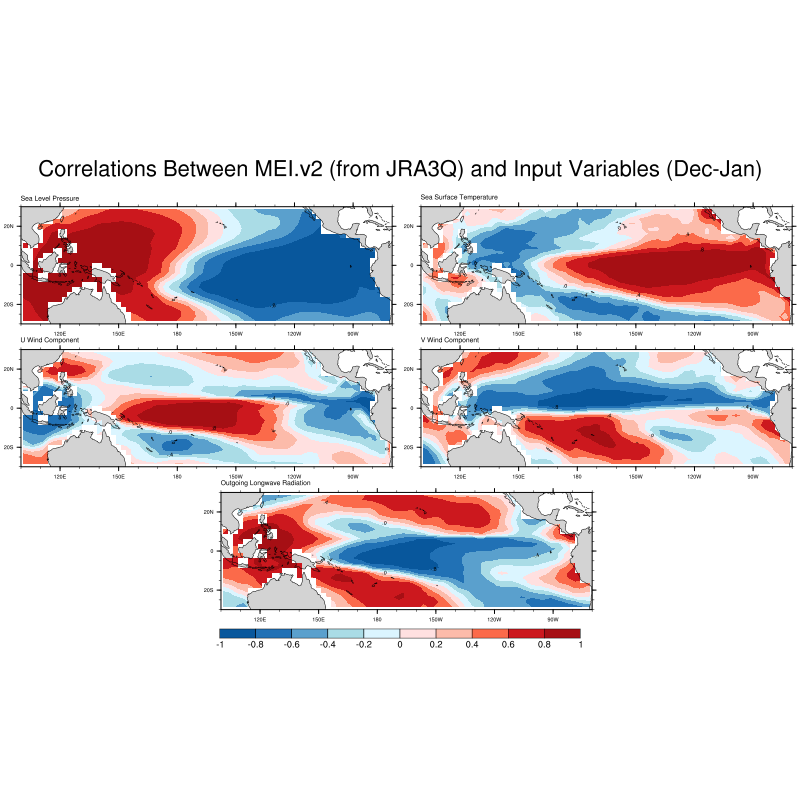
References
- Kobayashi, S., Ota, Y., Harada, Y., Ebita, A., Moriya, M., Onoda, H., Onogi, K., Kamahori, H., Kobayashi, C., Endo, H., Miyaoka, K., Takahashi, K., 2015. The JRA-55 Reanalysis: general specifications and basic characteristics. J. Meteor. Soc. Jpn. 93, 5-48. DOI: 10.2151/jmsj.2015-001
- Wolter, K., and M.S. Timlin, 1993: Monitoring ENSO in COADS with a seasonally adjusted principal component index. Proc. of the 17th Climate Diagnostics Workshop, Norman, OK, NOAA/NMC/CAC, NSSL, Oklahoma Clim. Survey, CIMMS and the School of Meteor., Univ. of Oklahoma, 52-57. Download PDF.
- Wolter, K., and M. S. Timlin, 1998: Measuring the strength of ENSO events - how does 1997/98 rank? Weather, 53, 315-324. DOI: 10.1002/j.1477-8696.1998.tb06408.x.
- Wolter, K., and M. S. Timlin, 2011: El Niño/Southern Oscillation behaviour since 1871 as diagnosed in an extended multivariate ENSO index (MEI.ext). Intl. J. Climatology, 31, 14pp., 1074-1087. DOI: 10.1002/joc.2336.
- Zhang, T, A. Hoell, J. Perlwitz, J. Eischeid, D. Murray, M. Hoerling and T. Hamill, 2019: Towards Probabilistic Multivariate ENSO Monitoring, Geophys. Res. Lett., 46, DOI: 10.1029/2019GL083946
Resources
Datasets Used in Calculating MEI.v2 using JRA3Q
- The fields of SST, SLP, and surface zonal and meridional winds for computing MEI.v2 on and after March 2024 are
obtained from the JRA-3Q reanalysis. Note data for the entire time-series is from the JRA-3Q.
- Previous source:The fields of SST, SLP, and surface zonal and meridional winds for computing the MEI.v2 prior to March 2024 were obtained from the JRA-55 reanalysis.
- Observations of OLR are obtained from NOAA Climate Data Record (CDR) of Monthly Outgoing Longwave Radiation (OLR), Version 2.7:
Other ENSO resources
This is a Research and Development Application