Realtime Verifications of Medium-Range Forecasts
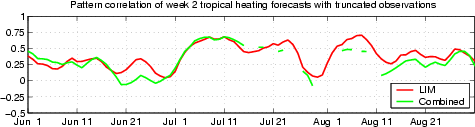

Current Verification

Select a variable and forecast time to see how the latest linear inverse model and MRF forecasts compare to observations.


Forecast Archive

Submitting a plot date below shows forecasts centered on the input date. When the verification is available it is displayed as well.

Figures updated:
Wed Nov 26 12:03:08 2003


Latest Map

click here
	    for larger image

Forecast Skill

The pattern correlation is computed in the region 0-90N, 120E-60W for week 2 250 hPa streamfunction forecasts. Comparisons with previous MRF forecasts are available for winter and summer.

Pattern correlations for week3 forecasts are online as well.
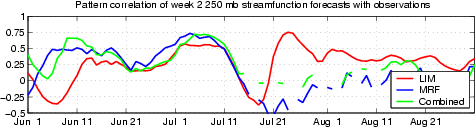
Spatial correlation of streamfunction forecasts
Spatial correlation of tropical heating forecasts

main page week 2 and 3 weeks 3/4 and 5/6 technique VERIFICATION heating data
Document maintained by: Matt Newman
Last modified: 3 Jan 2000
Credits