Meteorological March Madness 2012
Draft - Last Update: 11 December 2012
Disclaimer: This draft is an evolving research assessment and not a final report. The analyses presented have not yet been peer reviewed and do not represent official positions of ESRL, NOAA, or DOC. A more technical and detailed analysis of the heat wave has been submitted to the Bulletin of the American Meteorological Society for peer review. Comments are welcome. For more information, contact Dr. Martin Hoerling (martin.hoerling@noaa.gov)
Physical Process Understanding
In order to determine the cause(s) of an extreme event, an understanding of the physical processes is required. Here we present some preliminary analyses to better understand what factors may have contributed to the remarkable magnitude of this spring heatwave. These basic physical considerations, while providing clues on causes, also allow one to rank the likelihood of alternative explanations being true. A more detailed assessment will ultimately be required, especially in regard to a quantification of the plausible contributing factors.
2. What physical processes contributed to the heatwave's magnitude?

|
|
|
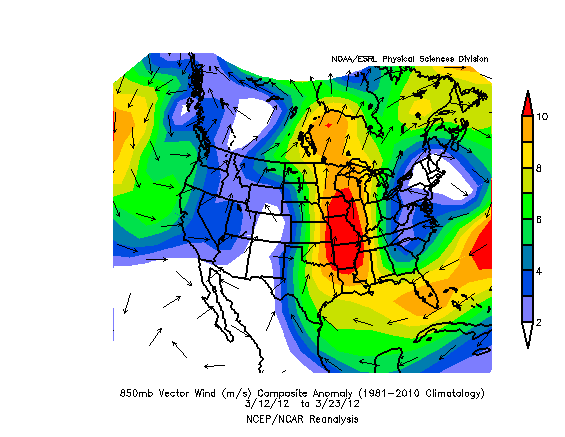
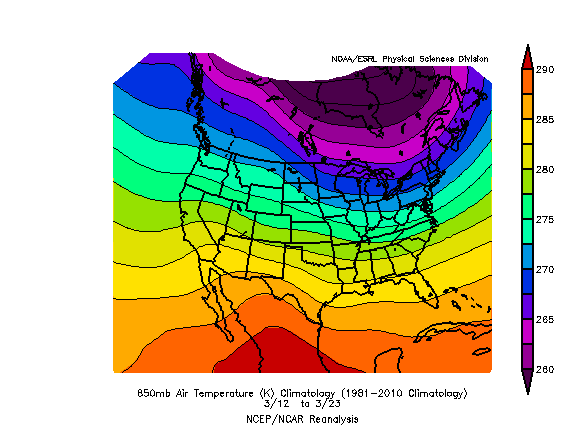
Figure 5: 850 hPa temperature anomaly (top), wind anomaly (middle top) and
temperature climatology (middle bottom), surface wind flow for March 14 (bottom - click for animation) [Data source: NCEP/NCAR reanalysis, NDFD via hint.fm]
|
It is useful to consider the heatwave as expressed in 850mb temperatures, the pattern and magnitude of which was shown to be virtually identical to that witnessed at the surface. We will return to the surface conditions in subsequent analysis, where we consider how processes of snow cover and soil moisture feedback could have affected the heat balance and surface expressions of the heatwave magnitude.
Much of the heatwave magnitude in the lower troposphere can be reconciled with the nearly horizontal transport of sensible heat, along the 850mb surface, from the Gulf Coast region to the Canadian border. Fig. 5 (top) shows that the +15°C maximum departures at 850mb were located over the northern Great Lakes region. The 850mb vector wind anomalies were strongly southerly across a corridor of the eastern Great Plains from Louisiana to the Canadian Prairie (Fig. 5, middle), with 12 m/s anomaly magnitudes. The steady nature of this pattern during the two week period of the heatwave allows one to infer the anomalous air parcel trajectories from these time-averaged wind anomalies. The anomalous streamlines, implied by the vector wind arrows in Fig. 5, are thus a reasonable approximation to trajectories. Resulting air parcel transit times from the Gulf to the Canadian border would be roughly on the order of 1-2 days. Preliminary back trajectory calculations reveal air parcel displacements strongly resembling the streamlines, as they should when the flow pattern is quasi-stationary, but further analysis will be required.
The intensity of the poleward heat transport can be inferred from the superpositioning of these anomalous winds upon the background contours of climatological temperatures. At 850mb, the climatological temperature gradient (Fig, 5, bottom) reveals a 20°C difference between 850mb temperatures on the Gulf Coast compared to the northern Great Lakes area. Undiluted, quasi-adiabatic transport would thus be able to rapidly exchange appreciable heat, and leading to much of the observed high latitude warming on the order of what occurred. Of course, one would expect some diabatic processes along the trajectory, but in the absence of precipitation (and, indeed there was little rainfall during this period), the air parcel motions would most probably approximate displacements along isentropic rather than pressure surfaces. It is also reasonable that some compressional heating from subsidence on the flank of the anomalous 500mb high would have affected parcel temperatures beyond their initial heat content from the Gulf of Mexico source regions.
An appreciable fraction of the magnitude of the warming is thus reconcilable with a simple transport of heat from Gulf Coast region northward. One can infer from Fig. 5 that the maximum in horizontal heat transport convergence (and thus, positive temperature tendency) would be realized over the Midwest north of the largest 850mb wind anomalies. While these are semi-quantitative statements, our initial diagnosis that the essential physical process of the heatwave development involved a strong anomalous poleward heat transport in the region east of the Rocky Mountains during 12-23 March 2012 is irrefutable.
The 850mb and 500mb anomalies during 12-23 March 2012 are characteristic atmospheric features of variability, ones that are effective in inducing poleward heat transport and strong temperature variability over the northern U.S. . They were, however, extreme circulation anomalies in terms of magnitude and perhaps persistence.
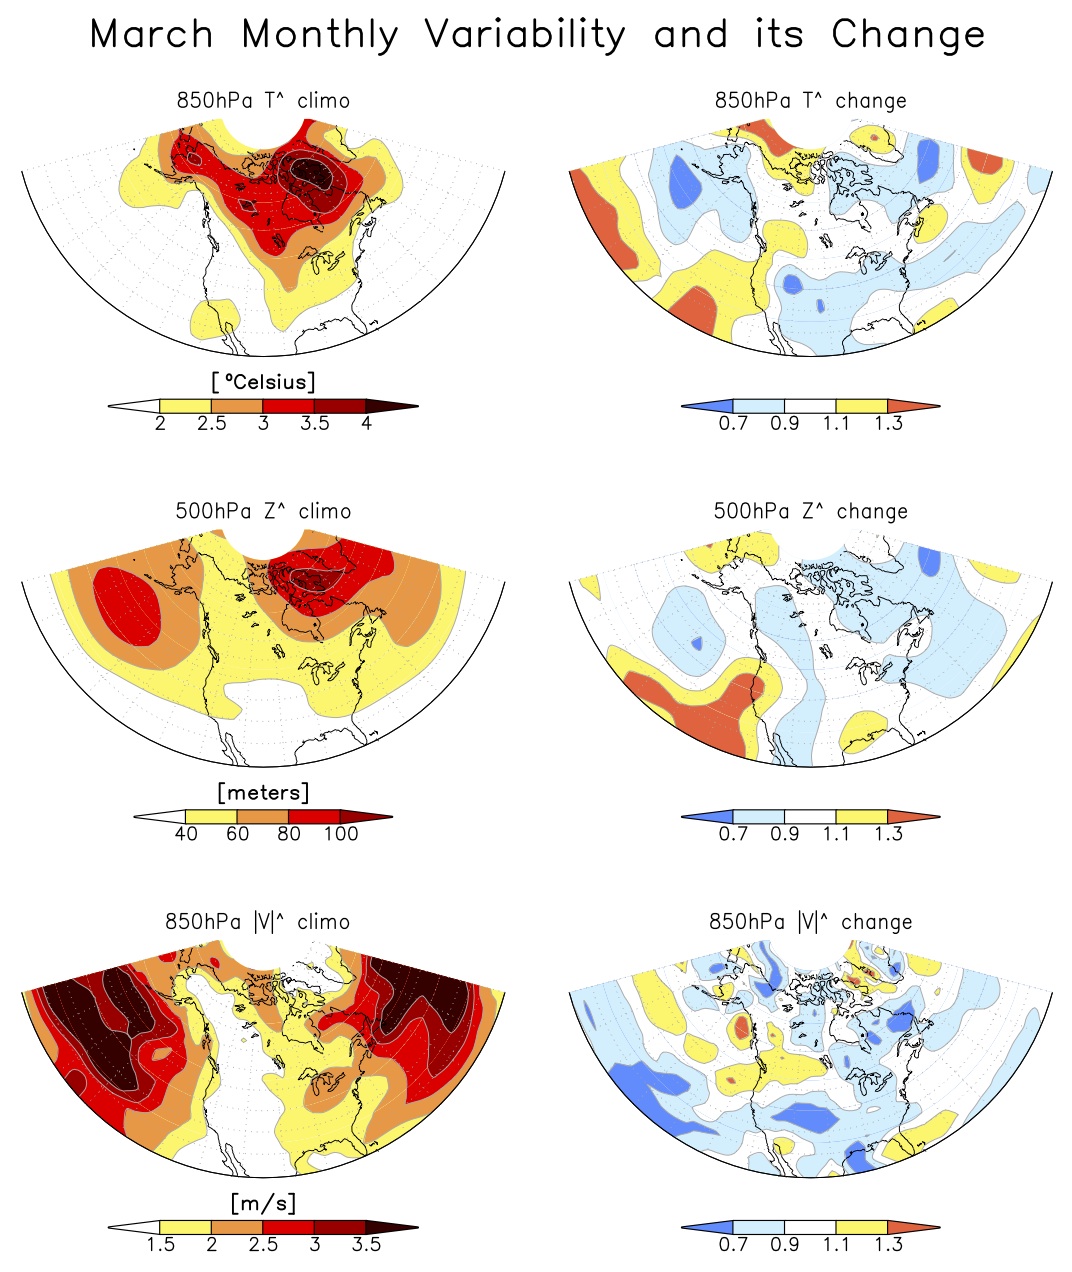
Figure 6: Standard deviation of monthly March 850mb temperature (top), 500mb heights (middle) and 850mb wind velocity (bottom) of the period 1961 to 1990 (left) and the ratio of standard deviations between period 1991 to 2011 and period 1961 to 1990 (right). [Data source: NCEP/NCAR reanalysis]
|
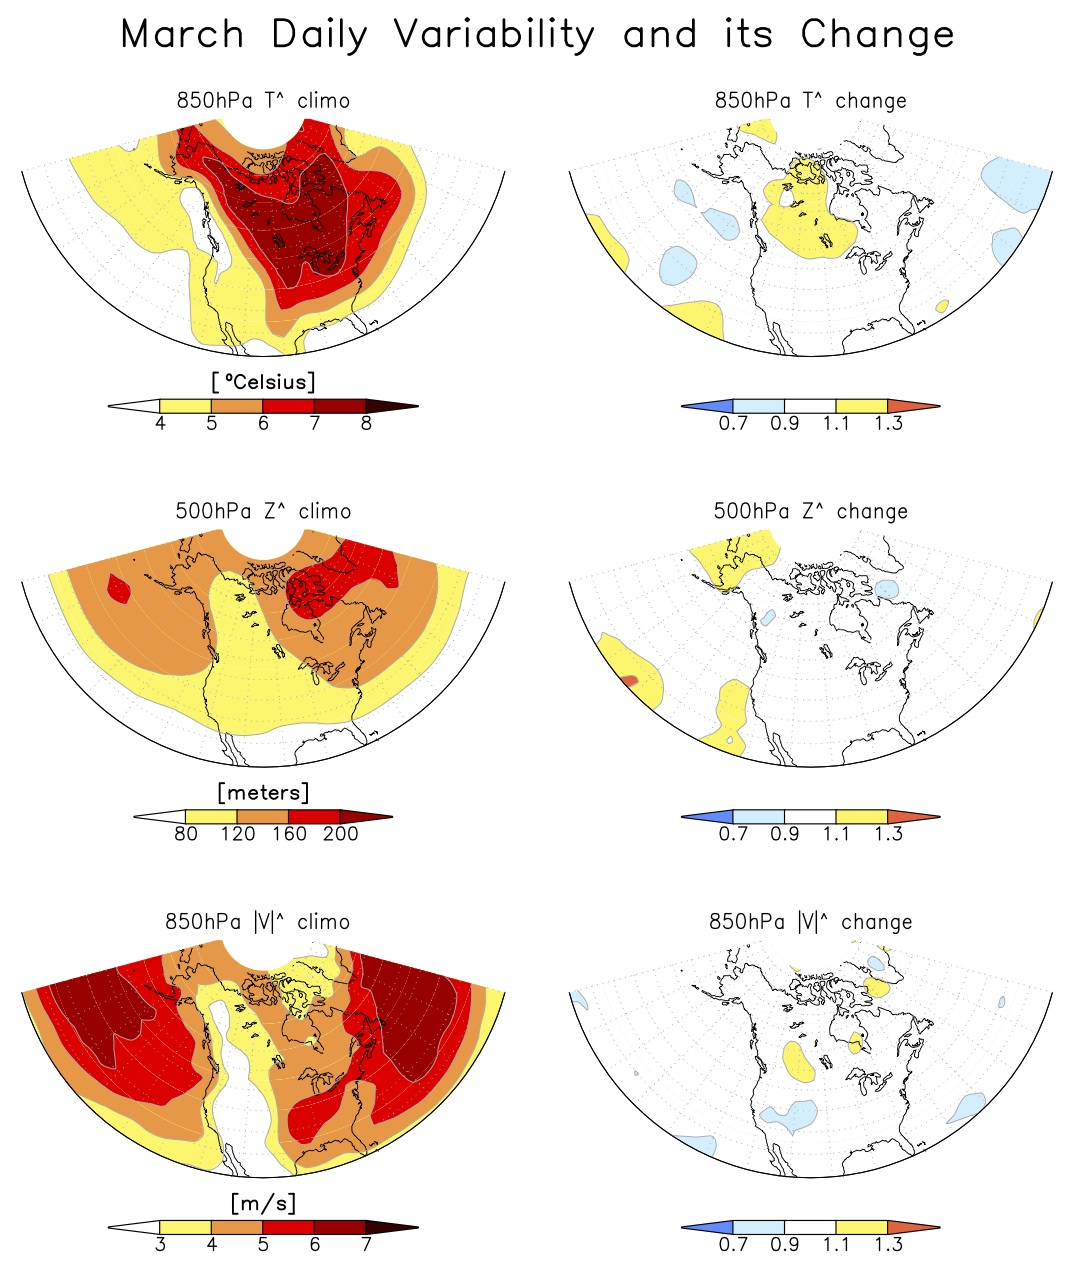
Figure 7: Same as figure 6 but for daily March values. Contour intervals for the 1961 to 1990 climatological values (left panels) are doubled relative to climatologies based on monthly values in Figure 6.
|
Have these features of the time-averaged atmospheric circulation become more "energetic" in the sense that the current 2012 unusual intensity of atmospheric dynamics might be related to an increase in variability over time? Perhaps the explanation is "weather weirding", "weather on steroids", or an extreme non-linearity to assert how the atmosphere may be responding to increases in greenhouse gases? Such explanations can be tested with data and modeling experiments. Here we present some preliminary analysis of March daily and monthly means. In summary, our diagnoses provided below show no support for the supposition that there has been enhanced variability, at least to date for the particular variables of immediate relevance for the March 2012 heatwave. Fig. 6 compares the variability of monthly averaged 850mb temperature (top), 500mb height (middle), and 850mb wind (bottom). The variability during 1961-1990 is presented in the left side panels, and the change to 1991-2011 (expressed as a ratio) is shown in the right panels. An identical analysis is provided in Fig. 7, but based on the variability and its change from daily values. Neither the monthly or the daily data reveal appreciable increase in the variability of March weather, though this does not negate the possibility that such patterns may change in the future. And, while finding no evidence for a change in variability, it is nonetheless evident that the anomalies in 850mb temperatures, 850mb winds, and 500 mb heights related to the heatwave were quite likely of historic proportions for this time of year, with departures during 12-23 March 2012 on the order of 5 times the magnitude of typical variability.
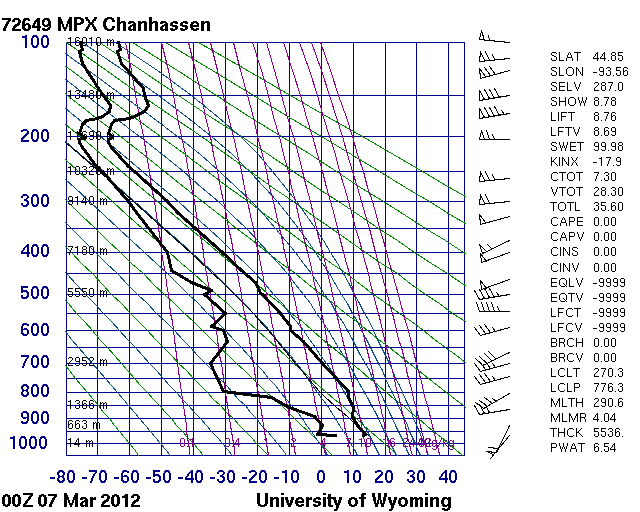
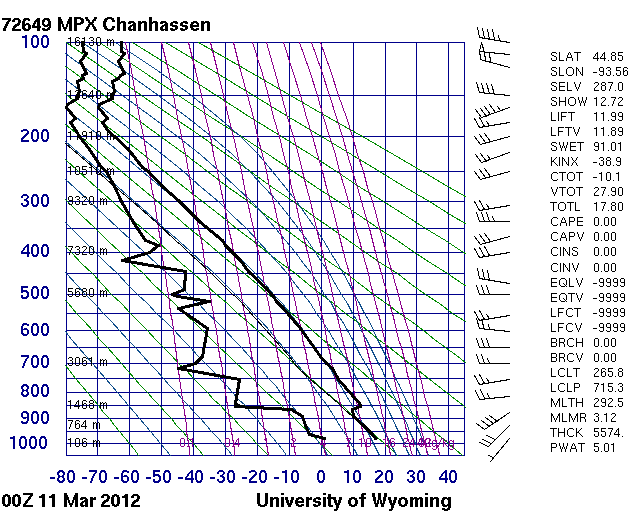
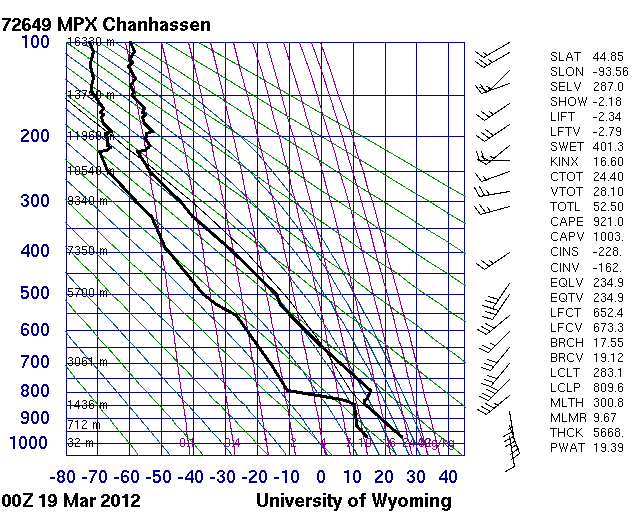
Vertical profiles of air temperature, dew point temperature, and winds using rawindsonde observations indicate the strong coupling between conditions in the lower troposphere and conditions at the surface (Fig. 8). Shown are a sequence of 00Z vertical profiles of temperature, dewpoint, and winds taken at Minneapolis, MN from 7 March thru 21 March. The strong veering of winds with height between the surface and 850mb level is a well-known signature of strong warm air advection in the low layer. Importantly, this layer was well-mixed as indicated by steep, near dry-adiabatic lapse rates, and deep planetary boundary layers as revealed by elevated lifting condensation levels. The implied strong vertical mixing of air is precisely what would be expected from the aforementioned similarity in magnitudes of the surface and 850mb temperature anomaly magnitudes. Of course, a major source of the lower tropospheric high temperatures is transport indicated in Fig. 6. One can also discern the presence of strong inversions in the soundings at or below 700mb, indicative of subsident warming.
|
|
|

|
|
|
Figure 8: Vertical profiles of air temperature, dew point temperature, and winds using rawindsonde observations from Minneapolis, MN, March 7-21. [Data source: University of Wyoming]
|
||||
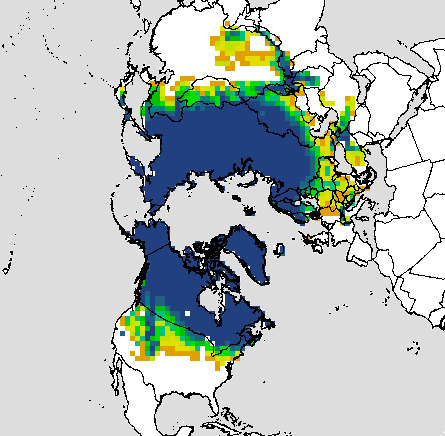
Figure 9: March snowcover climatology [Source: Rutgers University Global Snow Lab]
|
The strong coupling of surface and the lower troposphere was thus a key physical attribute of the heatwave. This fact does not negate a role for land surface feedbacks. What might have been their role? Regarding snow feedbacks, it is useful to first note that the March climatology of snowcover, as provided by the Rutgers University Global Snow Lab analysis (Fig. 9) reveals that the probability of having snow cover in March--- as far north as Chicago-- is less than 20%. In other words, most areas south of a latitude band near 42°N are snow free in March, on average. Thus, the fact that the observed temperature departures during the height of the heatwave in 2012 were uniformly above +10°F along a line from Chicago southward to Memphis cannot be explained by unique feedbacks associated with a lack of snow cover. However, snowcover is common in March north to the Canadian border. While snow did cover that region in advance of the heatwave (as shown in the animation link below), its low water equivalence led to rapid melt and sublimation.

Figure 10: Antecedent Precipitation Anomalies October 2011-March 2012 [Source: High Plains Regional Climate Center]
|
As shown by our analysis of observational data, an explanation that this heatwave was an outcome of a strong nonlinear feedback associated with a climate change induced reduction in snow cover or dry soil conditions must be rejected based on evidence and physical understanding regarding conditions associated with this particular heatwave event.
First, as noted above, much of the region which experienced record heat does not normally have snow cover in March, thus this mechanism does not apply for most of the area that experienced record March heat. Regarding possible soil moisture feedbacks, it is noteworthy that antecedent precipitation anomalies since October 1, 2011 (Fig. 10) were not particularly unusual, except over Minnesota. Even there, basic climatological knowledge indicates that the cold-season correlation between precipitation and surface variability based on historical data is negligible, on average (a very different relation than occurs during summer). This relationship is well-known in physical meteorology, namely that surface temperature variability during the cold months is more driven by horizontal advection and large-scale air-mass transports than by local land surface interactions involving soil moisture. To the extent that soil moisture is of material relevance to the surface energy balance in the northern US in March, only Minnesota exhibited appreciable antecedent dryness.
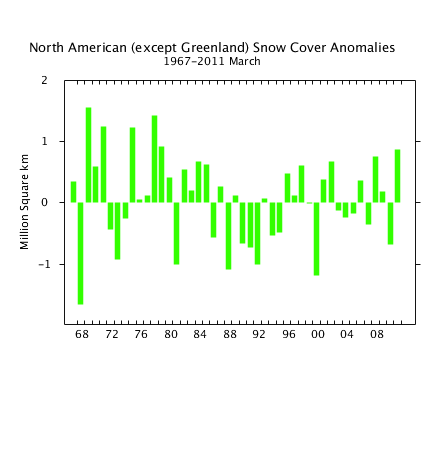
Figure 11: North American Snow Cover Anomalies for March [Source: Rutgers University Global Snow Lab]
|
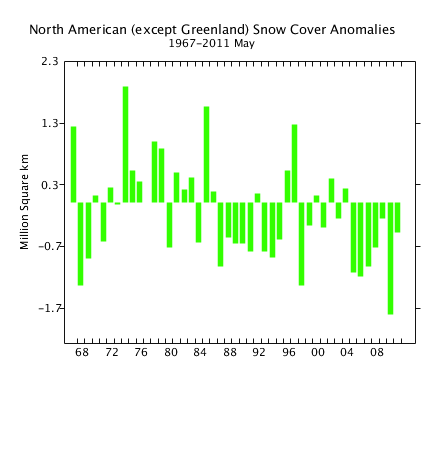
Figure 12: North American Snow Cover Anomalies for May [Source: Rutgers University Global Snow Lab]
|
Third, the vertical profile of temperature anomalies during March 2012 is physically inconsistent with the conjecture of a strong surface feedback. As already indicated, 850mb temperature anomalies were +15°C, associated with strong anomalous southerly flow that tapped southern U.S. airmasses, and transported warm air rapidly northward. Sea surface temperatures over the Gulf of Mexico were about +1°C above normal during this period, and thus would have explained only a modest portion of the magnitude of the heatwave over the Upper Midwest. The further analysis of atmospheric soundings and the vertical profile of temperatures clearly reveals the strong thermal advection occurring throughout the lower troposphere. The vertical signature of the temperature anomalies is thus inconsistent with surface-driven feedbacks. The studies by Kumar et al (2010) and Screen et al. (2012a, b) reveal that the vertical pattern of the temperature response to snow cover and sea ice loss in high latitudes exhibits the strongest warming at the surface but has virtually no signal above about 1000m above the surface.
To be sure, snow cover was intimately coupled to the unfolding heatwave of March 2012. An animation of daily snow cover during mid-March reveals a rapid retreat in snow cover evidently as a response to a northward surge of very warm air in strong low level southerly winds, rather than as an appreciable forcing factor of the warming itself. Feedback from the rapidly vanishing snow cover very likely contributed to some extent to the very strong surface warming magnitude over the far northern Plains and Upper Michigan peninsula. However, given the similar magnitudes of daily temperature departures occurring over Chicago, where snow cover is typically not present in mid-to late March (and indeed was absent during the 2012 heatwave), a substantial effect of the snow cover loss further north is unlikely.
So, while a quantification of the snow impact on the current heatwave magnitude cannot be precisely discerned without further diagnosis, it is very likely that changes in snow were a response to the heatwave, not a cause for its extreme magnitude.