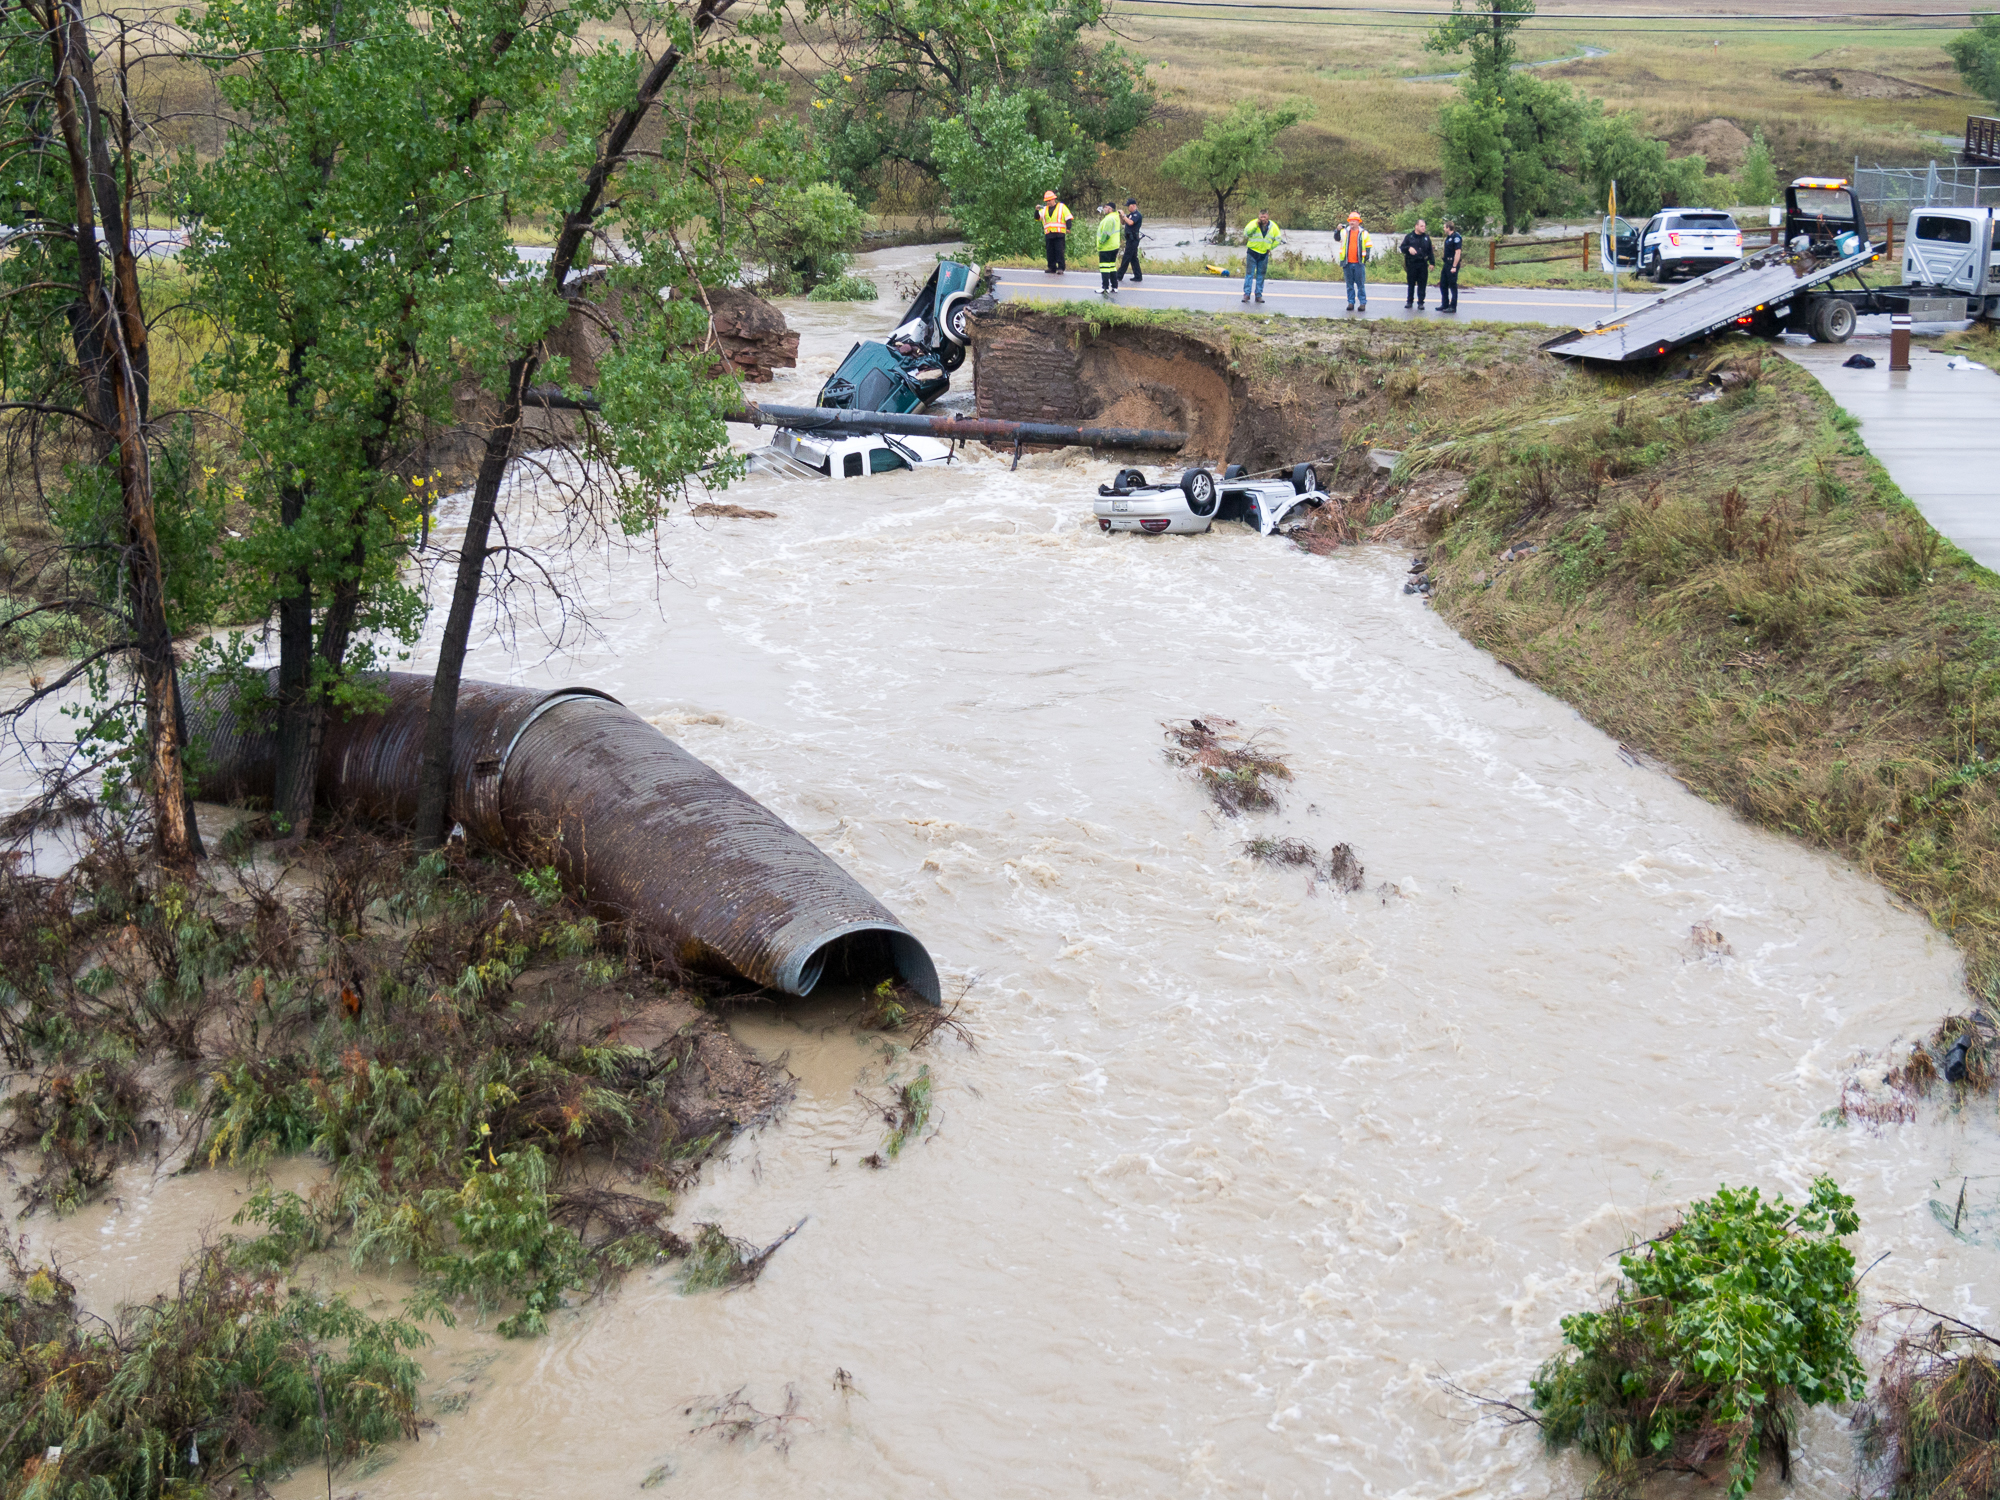
 * Near Dillon Road: image courtesy of Will von Dauster, NOAA |  * Boulder High School Grounds: image courtesy of Bruce Raup, NSIDC,CIRES/CU |
We are making available links and archiving maps and related figures for the Sep 2013 flood event. If you know of other sources of weather information, please let us know.
For information about government resources, helping victims, city road and park conditions, and similar topics, please see the City of Boulder 2013 Flood Webpage.
Articles
- How Boulder has prepared for flooding video (includes ESRL/PSL's Kelly Mahoney).
- NWS and Global Ensemble Precipitation Guidance during the Sep 2013 Front-Range Floods (Powerpoint document).
- Colorado's Destructive Floods Leave Scientists with Questions (from Scientific American).
- What Is the Climate Change Context behind the Colorado Floods? from Scientific American's Climatewire.
- CU CIRES blog on the event
- Severe Flooding on the Colorado Front Range: A preliminary assessment (from the Western Water Association (WWA))
- NWS analysis of the 2013 flood.
- Extreme Weather, Extreme Consequences In Colorado (NPR Radio Interview).
- Exceedance Probability Analysis for the Colorado Flood Event, 9-16 September 2013 (from the Hydrometeorological Design Studies Center (HDSC), National Weather Service, NOAA ).
- Causes of the Boulder area flood from NBCNews.
- "Inside the Colorado deluge: How much rain fell on the Front Range, and how historic was it?" (UCAR/NCAR)
Maps and Data
- Historic Rainfall and Floods in Colorado from climate.gov.
- Sequence of high resolution precipitation plots for CO/NM area
- Preliminary precipitation map from the NWS.
- Local Flood Weather Conditions from the NCAR Mesa and Foothills Labs.
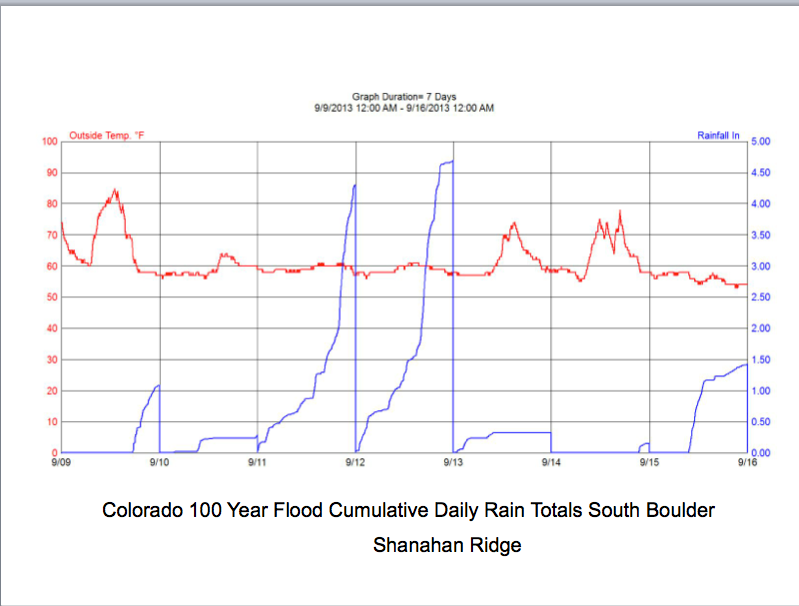
- Shanahan Ridge Precipitation. (courtesy Al Bedard)
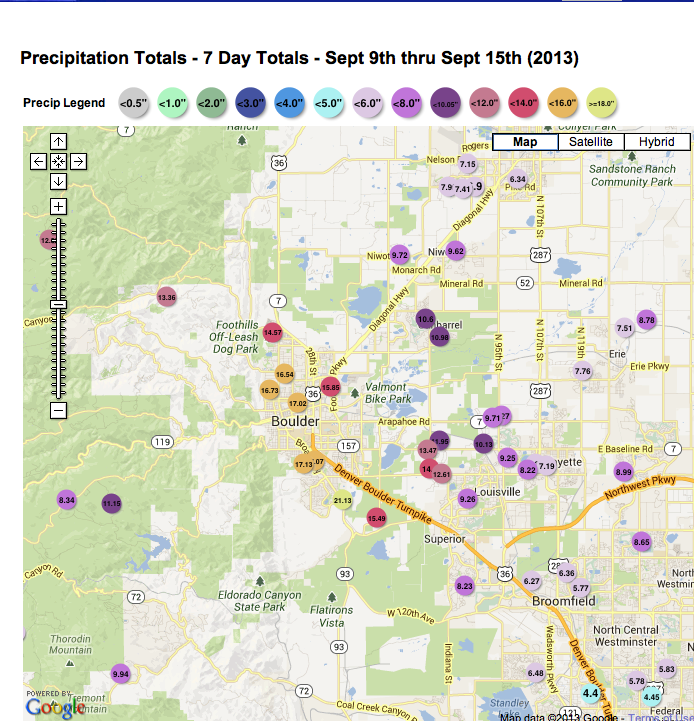
- Link to NWS interactive map of storm precipitation totals (slow to load). (Static map Boulder area).
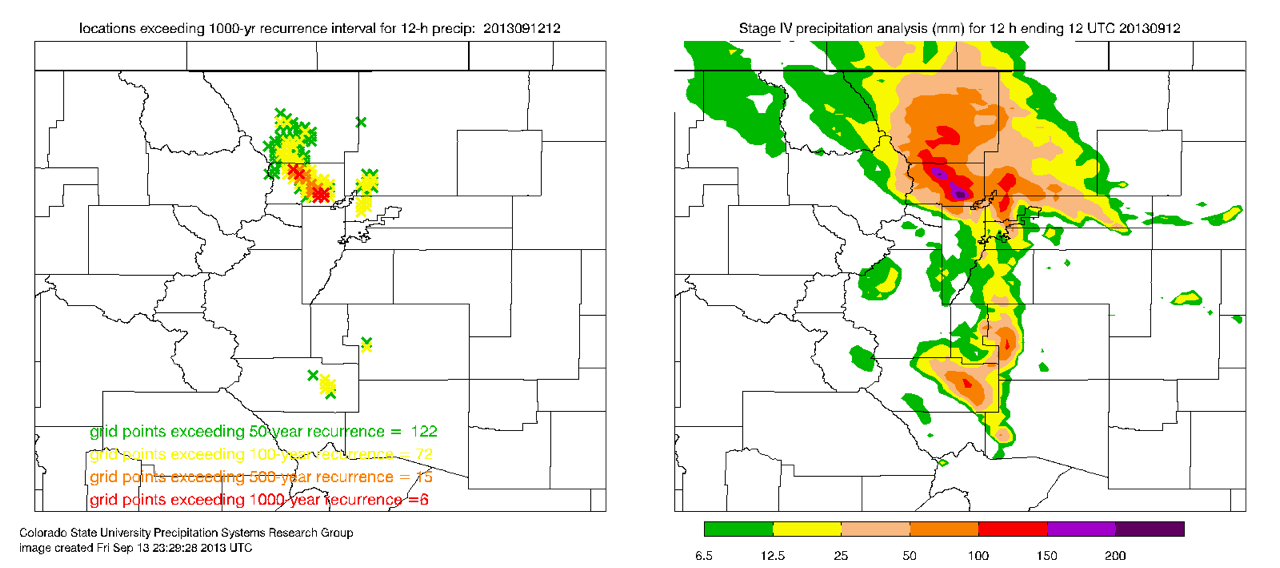
- Map of Colorado Precipitation for 9/12/2013 (also, map of regions with 50,100 and 1000 flood exceedance). Created at CSU.
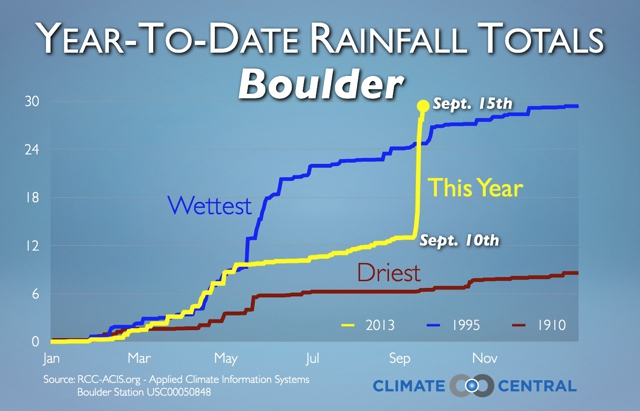
- Year to date annual precipitation Boulder, CO 2013 (source: RCC.ACIS.org).
- Time sequence of maps of selected variables from 9/11-9/15. (precipitable water, low level winds, moisture fluxes, sea level pressure, 500mb geopotential heights, trajectories, precipitation).
Historic Floods in the Colorado Frontrange
- Historical Colorado Flood Events (Colorado Office of Emergency Management)
- Colorado Front Range Historical Flood Summaries (since 1953) Significant storms in Colorado history (9news) -->
- Historic Flooding Bear Creek Drainage (SW Denver)
- Colorado Frontrange Flood history 1894-1997
- Report on 1965 foood
Putting the flood in historic perspective
The flood set a number of records. There were 5 daily precipitation records set as well as monthly total and annual total records..- Sep 10th: 1.02
- Sep 11th: 1.92
- Sep 12th: 9.08 *all time 1-day record
- Sep 13th: 2.44
- Sep 15th: 1.94
The highest daily totals (6pm-6pm) in the record are (in inches):
- 9/12/2013 9.08
- 7/31/1919 4.80
- 4/03/1986 3.56
- 5/17/1995 3.51
- 6/04/1949 3.40
- 5/07/1969 3.37
- 4/02/1957 3.31
- 4/15/1921 3.28
- 4/24/1997 3.20
- 6/09/1987 3.13
- 8/03/1951 3.06
- 9/04/1909 3.05