Reduction of Ozone Data
Procedures involved in reducing relatively clean air Dobson spectrophotometer observational data to yield total ozone amounts are straightforward. Observers are, therefore, urged to compute the total ozone amount immediately after making each observation and to examine the results for reasonableness. If the calculated ozone amount appears unrealistic, another observation following the first one should be made to improve on or verify the result first obtained.
Total ozone measurements in highly polluted atmospheres may be degraded by atmospheric trace gas constituents such as SO2 and NO2 that have absorption spectra in the region of the Dobson instrument wavelengths, or by ozone produced photochemically near ground level in polluted air (Komhyr and Evans, 1980). Observers, whose Dobson instruments are located in highly polluted air, are encouraged to conduct investigations into the amounts of interfering trace gases present and to make estimates of possible total ozone measurement errors.
7.1 Calculations of Total Ozone from Measurements on Direct Sun or Moon
The general equations used for deducing total ozone amounts from Dobson spectrophotometer observations on direct sun or moon are given in Section 2.1 of this manual. Insertion into these equations of numerical values for the ozone absorption coefficients alpha and for the molecular scattering coefficients beta yields the following equations from which total ozone amounts are computed:
        NA            m p    (delta-delta')A   sec Z
XA = -------- - 0.066----- - --------------- * -----                                       (3)
     1.748 mu        mu p0       1.748          mu


        NB            m p    (delta-delta')B   sec Z
XB = -------- - 0.099----- - --------------- * -----                                       (4)
     1.140 mu        mu p0       1.140          mu


        NC            m p    (delta-delta')C   sec Z
XC = -------- - 0.138----- - --------------- * -----                                       (5)
     0.800 mu        mu p0       0.800          mu


        ND            m p    (delta-delta')D   sec Z
XD = -------- - 0.289----- - --------------- * -----                                       (6)
     0.360 mu        mu p0       0.360          mu


      NA - ND          m p    [(delta - delta')A - (delta - delta')D = 0]   sec Z
XAD = -------- - 0.009----- - ------------------------------------------- * -----          (7)
      1.388 mu        mu p0                   1.388                          mu


      NB - ND          m p    [(delta - delta')B - (delta - delta')D = 0]   sec Z
XBD = -------- - 0.012----- - ------------------------------------------- * -----          (8)
      0.780 mu        mu p0                   0.780                          mu


      NC - ND          m p    [(delta - delta')C - (delta - delta')D = 0]   sec Z
XCD = -------- - 0.014----- - ------------------------------------------- * -----          (9)
      0.440 mu        mu p0                   0.440                          mu
AD-DSGQP observations have been recommended as standard by the International Ozone Commission. All other observations must therefore be reduced to the AD level before publication of final data. As indicated in Section 6.4.4, for example, CD-DSGQP observations may yield total ozone data slightly different from total ozone amounts determined from ADDSGQP observations. This difference should be determined by special measurements such as those described in Section 6.4.4, and the XCD values adjusted to the XAD level before publication of the data. Determinations of XA, XB, XC, and XD are not normally made since numerical values for the particle scattering coefficients associated with these observations are generally unavailable. Exceptions are moon observations on D wavelengths in polar regions where the air is very clean. When the moon is fairly low in the sky, there may not be sufficient instrument sensitivity to make observations using A and C wavelengths, but adequate response of the instrument to the longer D wavelengths. Reduction of the data then involves use of equation (6), with the assumption that (delta-delta')D = 0.
7.1.1 Ozone Absorption Coefficients
IAMAP 1968 ozone absorption coefficients used in reducing Dobson spectrophotometer data are shown in Table 5. The coefficients have been derived from Vigroux (1953) laboratory values, modified for use with Dobson spectrophotometers by Dobson (1957a), and adjusted at the recommendation of the IOC in 1968 on the basis of observational data to yield relatively consistent sets of ozone amounts from observations made on different wavelengths.
In calculating the ozone absorption coefficients, allowance was made by Dobson for the temperature of ozone in the atmosphere (assumed to be -44°C) and for the finite band-width of wavelengths passed by the monochromator. The equivalent widths of the monochromator slits are:
S1 = 9 A.U. S2 = 9 A.U. S3 = 30 A.U.
Weighting of the absorption coefficients for the different wavelengths is that shown in Figure 6.
The absorption coefficients shown in Table 5 have been adopted as standard. Recent evidence, subject to verification, suggests that these coefficients possibly yield ozone amounts too high by 5 to 10 percent (Komhyr, 1980).
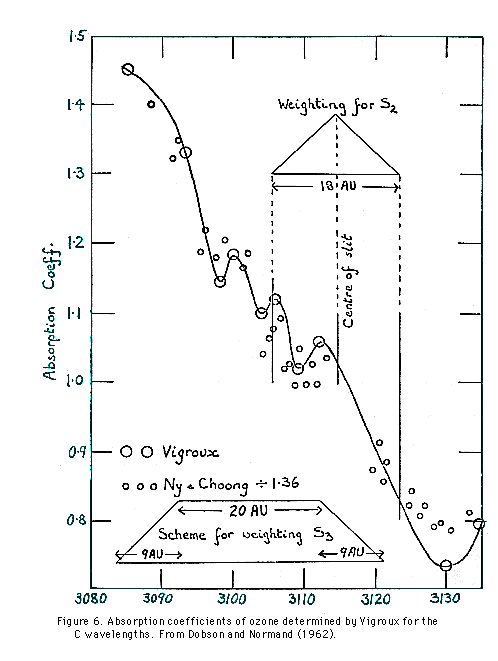
Table 5.  Ozone Absorption and Molecular Scattering Coefficients Adopted
     for use with Dobson Spectrophotometers by IAMAP in 1968.
| Designation of wavelength pair | Mean wavelength A.U. |
Ozone absorption coefficients | Atmospheric scattering coefficients | beta-beta' ----------- alpha-alpha' |
|||
| alpha alpha' |
(alpha-alpha') | beta beta' |
(beta-beta') | ||||
| A | Short Long |
3055 3254 |
1.748 | 0.491 0.375 |
0.116 | 0.066 | |
| B | Short Long |
3088 3291 |
1.140 | 0.470 0.357 |
0.113 | 0.099 | |
| C | Short Long |
3114.5 3324 |
0.800 | 0.453 0.343 |
0.110 | 0.138 | |
| D | Short Long |
3176 3398 |
0.360 | 0.416 0.312 |
0.104 | 0.289 | |
| C' | Short Long |
3324 4536 |
nil |
0.343 - |
- | - | |
7.1.2 Rayleigh Scattering Coefficients
The molecular scattering coefficients incorporated into equations (3) to (9) above are presented in Table 5.
7.1.3 Particle Scattering Coefficients
In reducing ozone data from observations on double pair wavelengths such as the AD and the CD wavelengths, the particle scattering coefficients
(delta-delta')A - (delta-delta')Dare assumed to be zero.
(delta-delta')C - (delta-delta')D
Except during very clear atmospheric conditions that may be present in polar regions, over oceans, on top of high mountains, etc., the pair wavelength coefficients (delta-delta')A, (delta-delta')C, and (delta-delta')D are not zero. Ozone measurements, therefore, should generally not be made using single pair wavelengths (see also Section 7.1).
7.1.4 Computation of mu
The quantity mu represents the ratio of the actual path length of a ray of light through the ozone layer as compared to the vertical path length. It is computed from the equation:
                 R + h
mu =  ---------------------------                                                         (10)
      sqrt((R+h)2 - (R+r)2 sin2 Z)
where
R = mean earth radius (6371.229 km);
r = height of the station above mean sea level;
h = height of the ozone layer above mean sea level at the location of the station;
Z = solar zenith angle.
No significant errors are introduced into computations of mu by using the mean earth radius for R rather than the actual earth radius at the station location. It is important, however, to incorporate into equation (10) correct values for the station height above mean sea level, r, and the height of the ozone layer, h, above mean sea level at the station location. It is well known that the height of the ozone layer above mean sea level decreases in the pole-ward directions. To solve equation (10) it is sufficient to use values for h given in the table below, which relates the height of the ozone layer above mean sea level to station latitude.
Station Latitude, theta      Height h of Ozone Layer
    in Degrees               Above Mean Sea Level in Km

      ±  0                            26
      ± 10                            25
      ± 20                            24
      ± 30                            23
      ± 40                            22
      ± 50                            21
      ± 60                            20
      ± 70                            19
      ± 80                            18
      ± 90                            17
7.1.5 Values of m and p/p0
The symbol m appearing in equations (3) to (9) represents the equivalent pathlength of sunlight or moonlight through the earth's atmosphere allowing for refraction and curvature of the earth. Values of m vs. cos Z (Bemporad, 1907) are tabulated in Appendix G. Values of m may also be determined from the following polynomial approximation to the values of Bemporad (Hiltner and Hardie, 1962):
               m = sec Z - 0.0018167(sec Z - 1)
                         - 0.002875(sec Z - 1)2                                            (11)
                         - 0.0008083(sec Z - 1)3
When computing ozone amounts from observations on the double pair wavelengths AD, BD, or CD, it is sufficient to use mean station pressure p in equations (7) to (9). However, when computing single pair A, B, C, or D wavelength ozone amounts using equations (3) to (6), significant errors result if mean rather than actual pressures are used at times when extreme pressure deviations occur at the station.
7.1.6 Computation of Cos Z for Sun and Moon
Details of manual and computer calculations of solar and lunar zenith angles Z, and hence mu, are provided in Appendix F. The importance of incorporating horizontal parallax corrections into the cos Z computations for moon observations is also treated in this Appendix. Additional useful astronomical information, concerning the celestial sphere and concept of time, is provided in Appendix H and Appendix I.
7.2 Calculation of Ozone Amounts From Measurements on the Clear Zenith Sky
Zenith sky ozone observational data are reduced by means of empirically constructed charts which relate instrument N values, mu and X. Such charts are normally drawn up using quasi-simultaneously obtained data from AD-DSGQP observations and observations on the clear or cloudy zenith. Nearly simultaneous direct sun and clear zenith sky observations are readily obtainable. However, when the sky is cloudy, it often becomes necessary to compare direct sun and cloudy zenith observations that have been taken several hours apart.
The data reduction charts shown in the following sections were derived in Canada in the late 1950's (Komhyr, 1961; Kinisky et al., 1961), and are applicable for use in middle latitudes. Copies of the charts are available from NOAA Air Resources Laboratory, Boulder, Colorado, for preliminary use at any ozone observatory. It is important to note that the charts cannot be used universally, since the shapes of the chart curves are a function of the ozone vertical distribution, the earth's albedo, atmospheric clarity, and instrumental factors. Therefore, although the charts can serve as useful starting tools for preliminary reduction of data, it is necessary at each station to obtain a sufficient number of comparison direct sun and zenith sky observations to correct the charts so that they yield optimum quality data at that location.
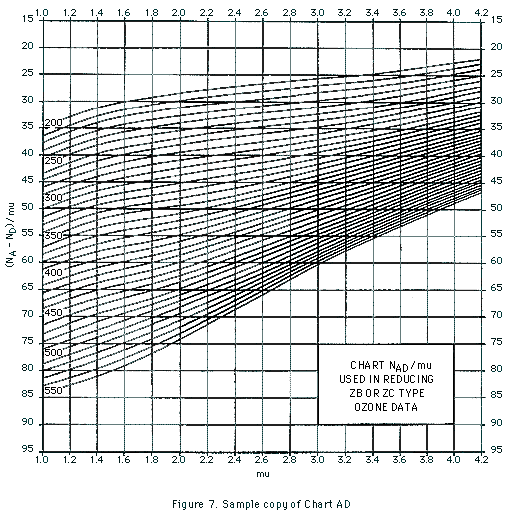
7.2.1 AD-ZB Observations
AD-ZB observational data are reduced by converting instrument R-dial readings to NA - ND values, computing cos Z and mu from knowledge of the times of observations, determining (NA - ND)/mu values, and then reading total ozone amounts directly off Chart AD, a sample copy of which is shown in Figure 7.
Some indication of the quality of data obtainable from AD wavelength observations on the clear zenith sky has been given by Komhyr (1961) who showed that when 177 nearly simultaneous ADDS and ADZB values were compared at Moosonee, Canada, during 1957 to 1959, over a wide range of mu and X, the resulting error frequencies for the zenith sky observations were the following:
    Error : <= 1% <="2%" <="3%"

Frequency :   54%     78%     95% .
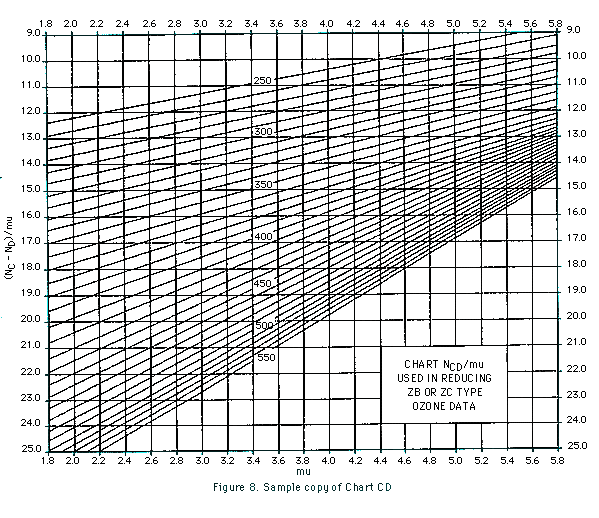
7.2.2 CD-ZB Observations
These are reduced in a manner similar to that used in reducing AD-ZB observations. The ozone values are read off Chart CD, a sample copy of which is shown in Figure 8. Chart CD should, however, be regarded as highly tentative since a definitive study has not yet been made of how well total ozone amounts can be estimated from zenith sky observations on CD wavelengths.
7.2.3 CC'-ZB Observations
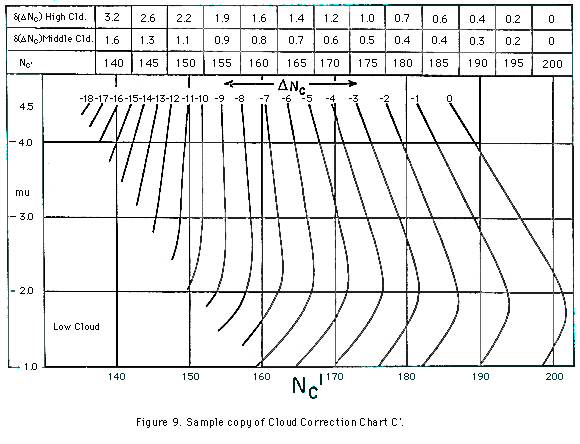
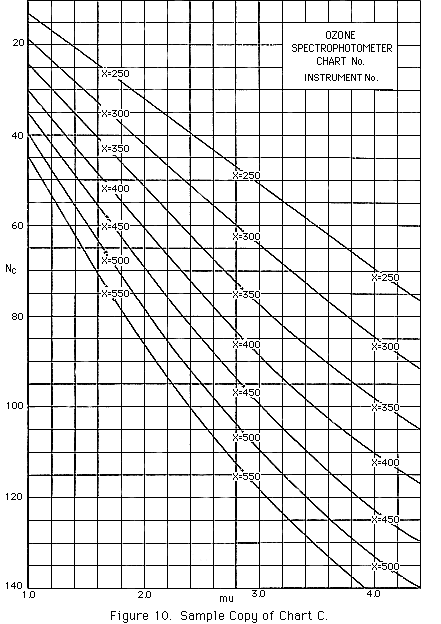
Here again, RC and RC' readings are first converted to NC and NC', mu is computed, and using the mu and NC' values a small, usually negative haze-correction factor, DeltaNC, is read for low cloud off Cloud Correction Chart C', a sample of which is shown in Figure 9. DeltaNC is then added to the observed NC and the new NC value and corresponding mu are finally used in reading the ozone amount directly off Chart C, a sample of which is shown in Figure 10.
If the sky is perfectly clear, the correction DeltaNC should equal zero. In practice, even though the sky may appear to be very clear, DeltaNC is found to be small, positive or negative. The reason for the observed scatter is unknown; it cannot be attributed entirely to instrumental error. When reducing the data, positive DeltaNC values are taken to be equivalent to zero.
The abscissa values
shown in the Cloud Correction Chart C' chart of Figure
9 apply to a specific ozone spectrophotometer. For another instrument,
these values will normally be shifted by a constant. To determine the shift
constant, it is necessary to perform many clear zenith sky observations on
C' wavelengths (for 1.015 Some indication of
the quality of data obtainable from CC' wavelength measurements on the clear
zenith sky is available from observations made at Moosonee, Canada. When 201
ADDS and CC'ZB nearly simultaneous values were compared during 1957 to 1959
over a wide range of mu and X, the resulting error frequencies for the zenith
sky observations were the following:
7.3 Calculation of Ozone Amounts from Measurements Made
on the Cloudy Zenith
7.3.1 AD-ZC Observations
The ozone data are
at first reduced in exactly the same way as the clear sky observations. Measurements
on cloud, however, tend to yield ozone values that are slightly too high,
especially at the higher mu values. The XAD
values read off Chart AD must be decreased by amounts shown in a Table
of Cloud Corrections for AD Observations, a sample copy of which is shown
in Table 6. The cloud corrections are applied
only for medium-thick or thick clouds.
An indication of the
quality of data obtainable from AD wavelength measurements on the cloudy zenith
sky is available from observations made at Moosonee, Canada. When 136 quasi-simultaneous
ADDS and ADZC values were compared during 1957 to 1959 over a wide range of
mu and X, the resulting error frequencies for the zenith sky observations
were the following:
7.3.2 CD-ZC Observations
The ozone data are
reduced in exactly the same way as the clear sky measurements. Further work
is needed to ascertain whether a table of cloud corrections (similar to that
used in reducing AD-ZC data) is needed to improve the quality of CD-ZC type
observations.
7.3.3 CC'-ZC Observations
The observations are
reduced in a manner similar to that for reduction of CC'-ZB observational
data. However, the cloud correction (deduced from Chart C') to be applied
to NC values now becomes DeltaNC
+ delta(DeltaNC) where delta(DeltaNC)
vanishes for low cloud but not for middle or high cloud.
An indication of the
quality of data obtainable from CC' wavelength measurements on the cloudy
zenith sky is available from observations made at Moosonee, Canada. When 300
quasi-simultaneous ADDS and CC'ZC values were compared during 1957 to 1959
over a wide range of mu and X, the resulting error frequencies for the zenith
sky observations were the following:
An alternate method
of applying cloud corrections to CC'-ZC type observations is presented by
Dobson (1957a). Application of this method, however, is somewhat more tedious
than that described above, and does not lead to markedly improved data.
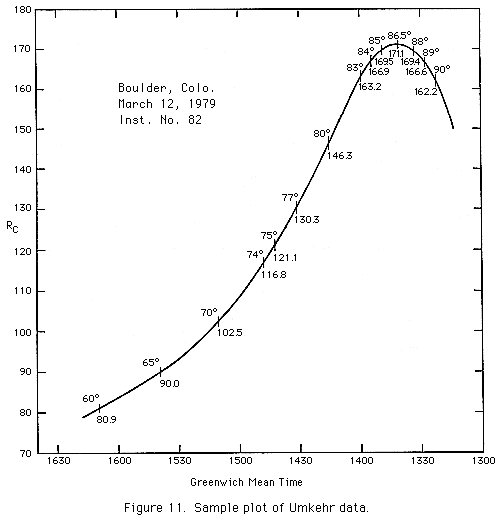
7.4 Reduction of Umkehr Data
In processing standard
Umkehr data for C wavelengths, the NC values
of interest are those corresponding to solar zenith angles Z of 60°, 65°,
70°, 74°, 75°, 77°, 80°, 83°, 84°, 85°, 86.5°, 88°, 89°, and 90°. To extract
the needed information from the entire body of observational data, the practice
is to plot instrument dial readings RC vs.
Greenwich Mean Time as shown in the sample plot of Figure
11. Then, starting with values of cos Z, the times of occurrence of the
pertinent Z values are computed by working the usual mu computations in reverse
(See Appendix F). RC
values, corresponding to the computed times, are then extracted from the plotted
data and converted to the required ND values.
Short Umkehr NA and ND
values are obtained in a similar manner from plots of RA
and RD vs. Greenwich Mean Time.
Observational Umkehr
data should be coded according to instructions given in Section
8.2, and forwarded to the World Ozone Data Center, Downsview, Ontario,
Canada for processing to obtain standard Umkehr and short Umkehr atmospheric
ozone vertical distributions.
Return to Table of Contents
Forward to Section 8. Coding and Archiving Ozone Data
Frequency : 60% 82% 92% .
Frequency : 32% 55% 76% 91% .
Decrease total ozone amounts by values given in table
for observations made on medium or thick cloud only.
X   mu   1.0     1.2     1.4     1.6     1.8     2.0     2.2     2.4

0.250     0       0       0     0.001   0.001   0.001   0.001   0.001
0.275     0       0     0.001   0.001   0.002   0.002   0.003   0.003
0.300     0     0.001   0.001   0.002   0.003   0.003   0.004   0.004
0.325   0.001   0.001   0.002   0.003   0.004   0.004   0.005   0.006
0.350   0.001   0.002   0.002   0.004   0.005   0.006   0.007   0.008
0.375   0.001   0.002   0.003   0.005   0.006   0.008   0.009   0.011
0.400   0.002   0.003   0.004   0.006   0.007   0.009   0.011   0.013
0.425   0.002   0.003   0.005   0.007   0.009   0.011   0.013   0.015
0.450   0.002   0.004   0.006   0.008   0.010   0.013   0.016   0.018
0.475   0.003   0.004   0.007   0.009   0.012   0.015   0.018   0.021
0.500   0.003   0.005   0.008   0.011   0.014   0.017   0.021   0.024
0.525   0.003   0.006   0.009   0.012   0.016   0.019   0.023   0.027
Frequency : 33% 66% 81% 89% .