|
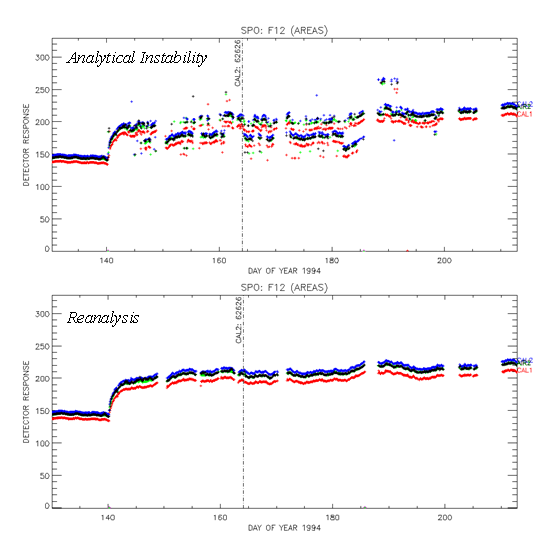
Figure 5. Time series plots of chromatographic CFC-12 peak
areas from air and calibration samples injected at the South Pole
between 05/10/94 and 08/03/94 (i.e. days 130 - 215 of the year 1994).
Air samples were injected from two seperate sample streams shown here in
green (AIR1 in the right-hand margin of the plots) and black (AIR2).
Calibration samples were injected from two seperate working standards
tanks shown here in red (CAL1) and blue (CAL2). The plot of the original
peak analysis (top frame) shows a considerable degree of instability
resulting from an insufficiently-constrained analysis method. This
allowed a chromatographic feature just ahead of the CFC-12 peak to
intermittently interfere with the software's determination of the
starting point for the peak. This type of situation occurred in several
places throughout the areas/heights database and was addressed by
reanalyzing chromatograms under tightened constraints (bottom frame).
|