|
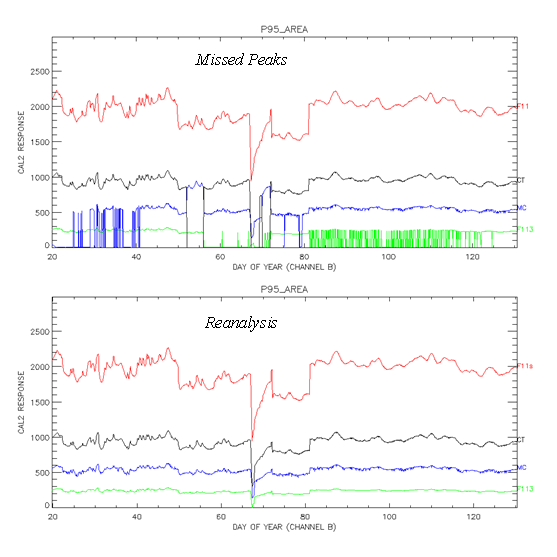
Figure 4. Times series plots of channel b chromatographic
peak areas for calibration samples injected at South Pole between
01/20/95 and 05/20/95 (i.e. days 20 - 140 of the year 1995). CFC-11 (F11
in the right-hand margin of each plot) is shown in red, CFC-113 (F113)
in green, CH3CCl3 (MC) in blue, and CCl4
(CT) in black. The plot of the original chromatogram analysis (top
frame) shows numerous intermittent occasions when
CH3CCl3 and CFC-113 were not picked up by the peak
analysis software. This often occured throughout the areas/heights
database because of an excessively-constrained analysis method. The
problem was addressed by reanalyzing chromatograms
(examples) utilizing a method with
softened constraints (bottom frame). This illustration also shows two
regions where CCl4 was mistakenly identified at
CH3CCl3 (top frame; see also
Figure 3).
|