Categories
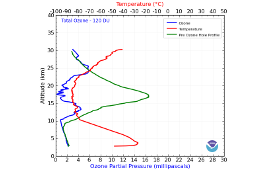
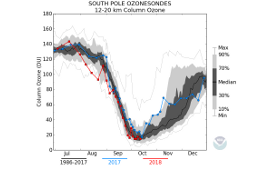
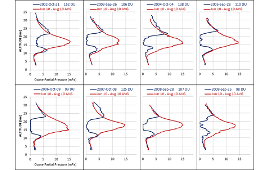
Plots of South Pole ozone profiles as measured by balloon-borne ozonesondes.
Keep Track of the Ozone Hole and temperatures compared to historical data.
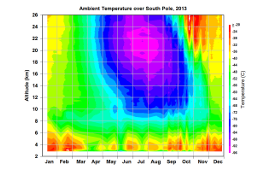
Ozone Mixing Ratio and Ambient Temperature vs. Altitude and Time
These animations show the development of stratospheric temperatures and the Antarctic ozone hole at the South Pole.
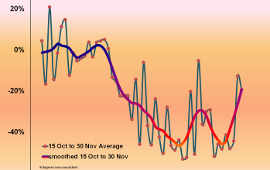
The ODGI is an index that relates changes in amounts of ozone
depleting gases and the recovery of the stratospheric ozone layer.
Compare minimum ozone profiles since 1986.
A plot of the changes in the springtime minimums of ozone measured by the Dobson spectrophotometer.
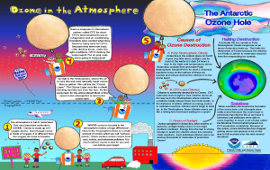
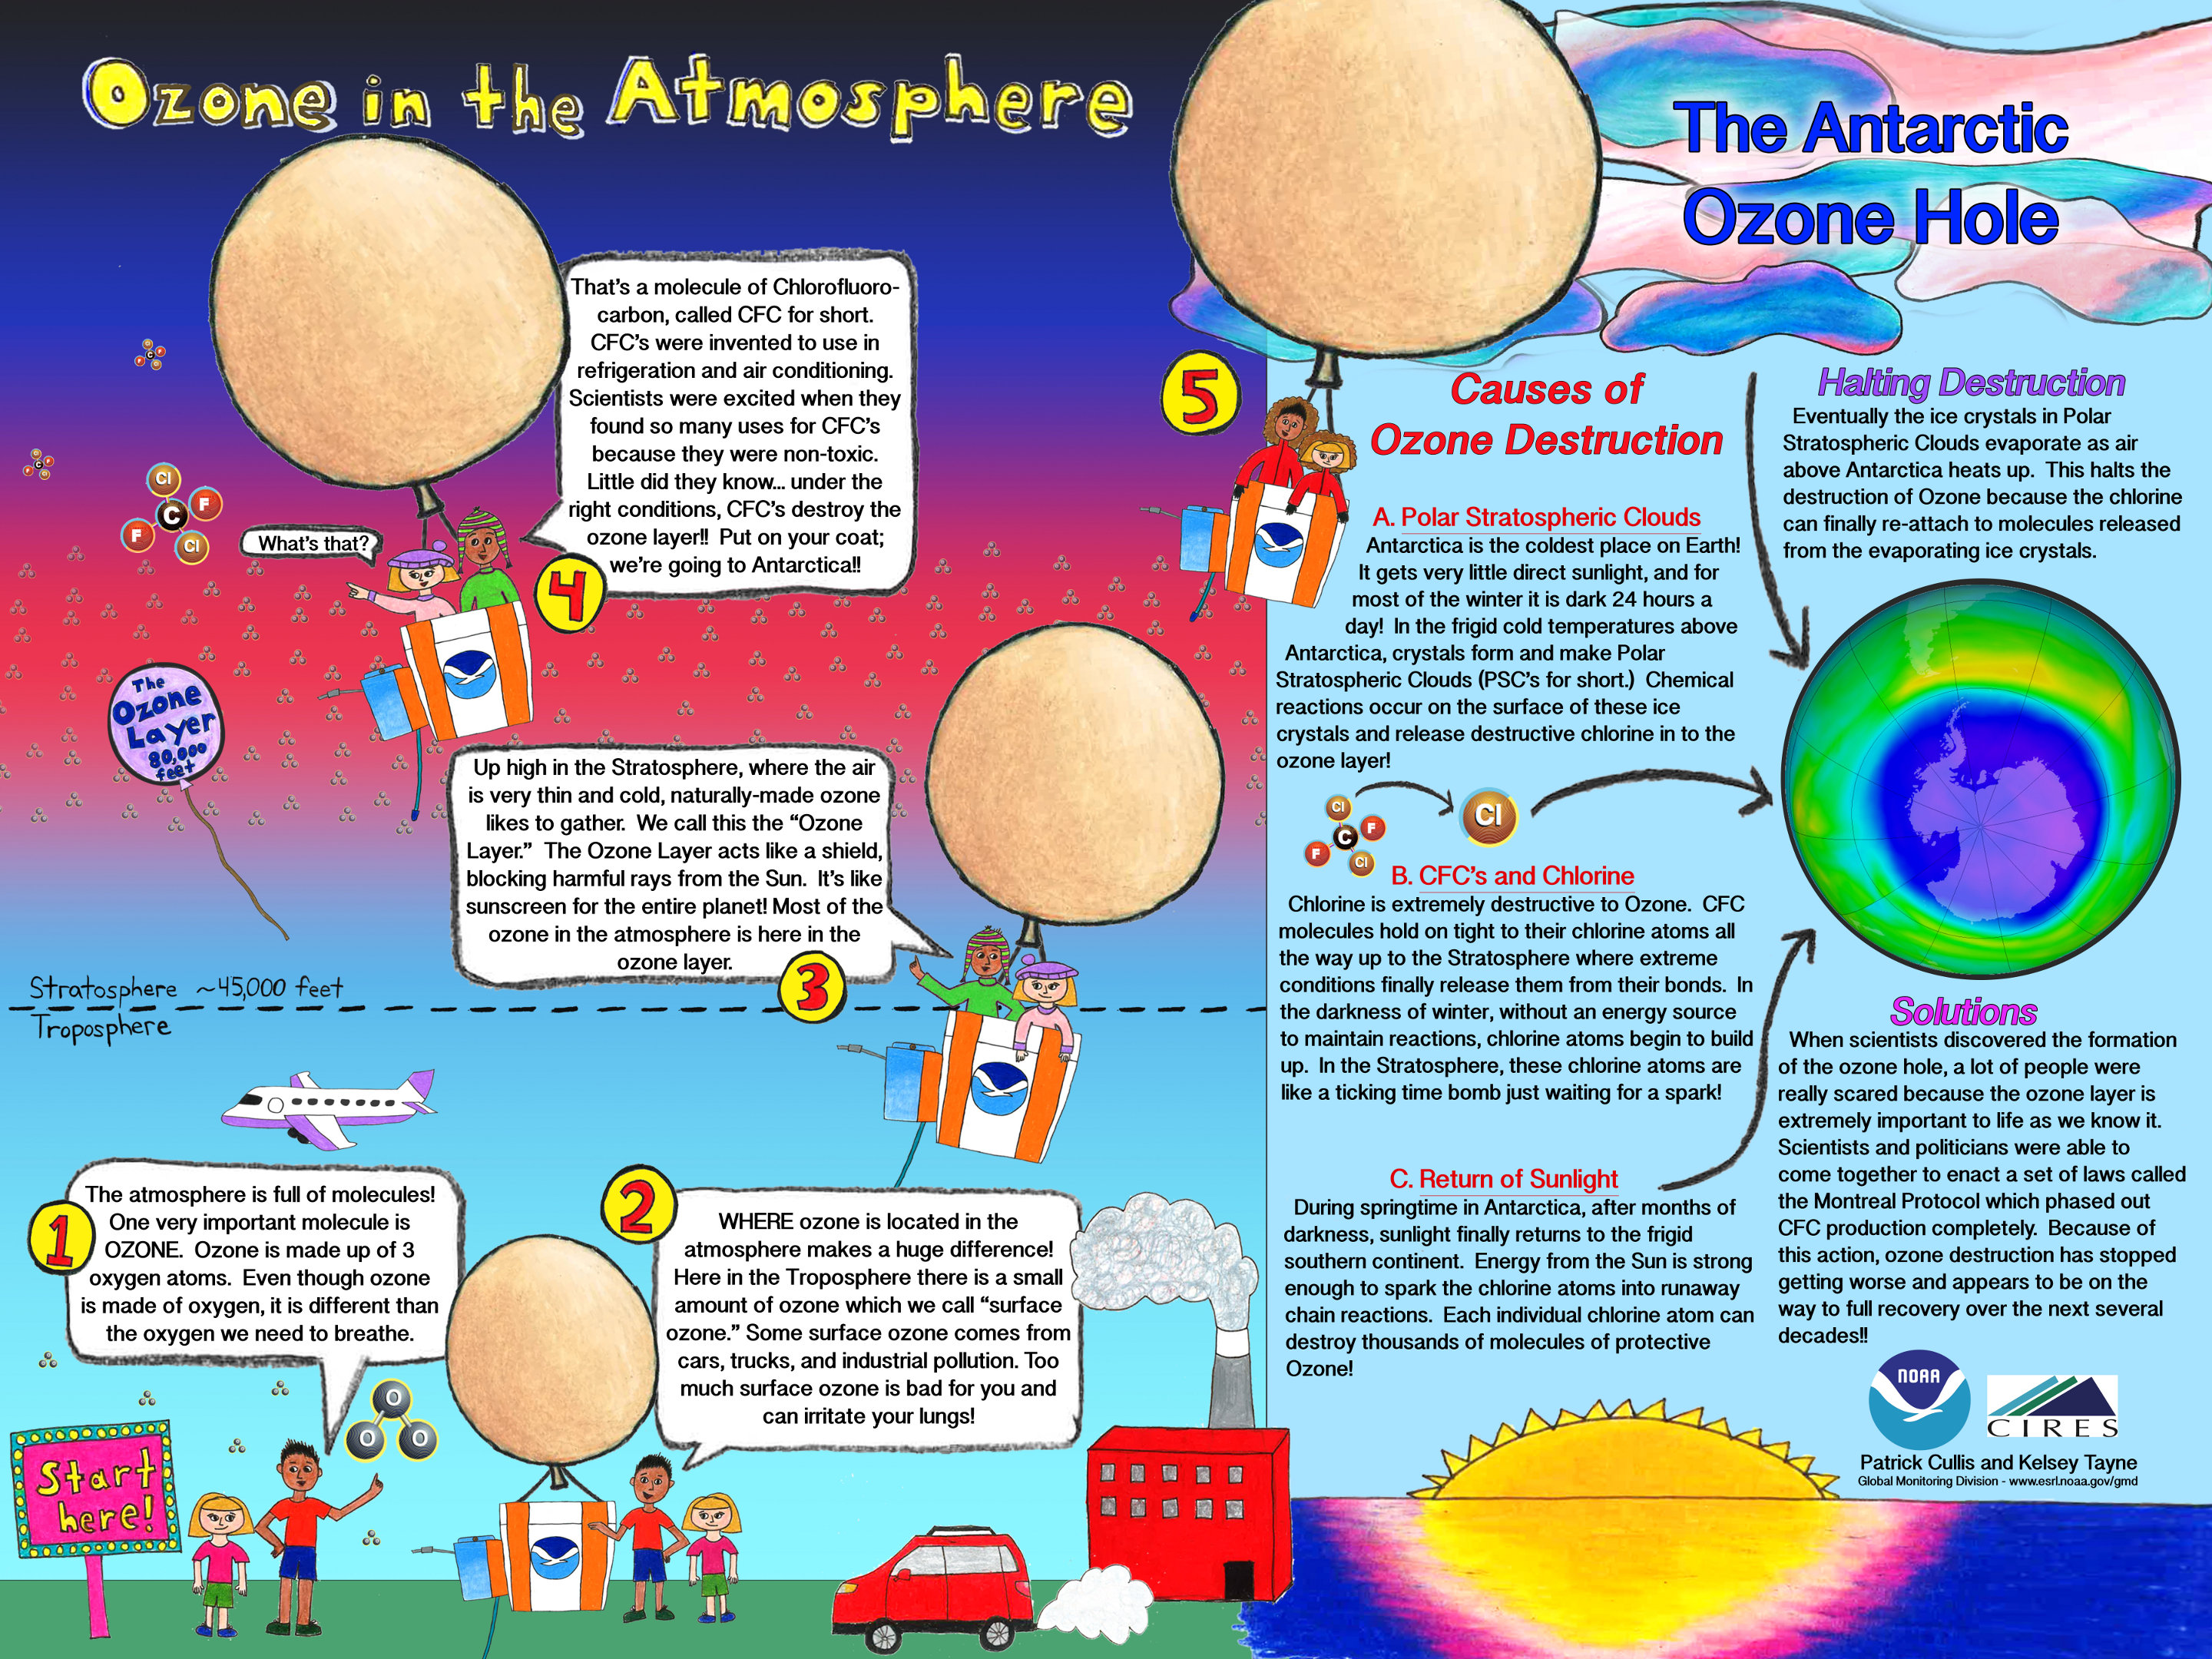
An overview handout for middle school students describing the basics of the ozone layer and ozone depletion.
PDF Version
Related Videos
The Antarctic Ozone Hole
The Antarctic Ozone Hole was discovered by the British Antarctic Survey from
data obtained with a Dobson ozone spectrophotometer at Halley Bay station in
the 1981-1983 period. They reported the October ozone loss in 1985. Satellite
measurements then confirmed that the springtime ozone loss was a continent-wide
feature. Research conducted during the National Ozone Expeditions to the U.S.
McMurdo Station in 1986 and 1987, and NASA stratospheric aircraft flights into
the Antarctic region from Chile in 1987 showed conclusively that the ozone loss
was related to halogen (chlorine)-catalyzed chemical destruction which takes
place following spring sunrise in the Antarctic polar region. The chlorine is
derived from manmade chlorofluorocarbons (CFCs) which have migrated to the stratosphere
and have been broken down by solar ultraviolet light, freeing chlorine atoms.
The cold dark Antarctic winter, with its stratospheric ice clouds mixed with
manmade chlorine, sets the stage for springtime chemical ozone destruction when
the missing ingredient in the photochemical reactions, sunlight, appears.
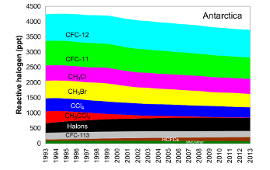
Owing to Montreal Protocal regulations on the production of certain ozone-destroying, chlorinated
compounds, which went into effect in January 1996, the atmospheric concentration
of some of these man-made substances has begun to decline (CFC-11
vs. Time Plot and other CFC info).
The recovery from the ozone hole is a slow process. In order to easily understand
this process, NOAA has developed an index, the Ozone Depleting Gas Index (ODGI),
which relates the current ozone measurements to the pre-ozone hole era (circa 1980).
The index is calculated directly from observations at Earth's surface of the most abundant long-lived, chlorine and bromine containing gases regulated by the Montreal Protocol (15 individual chemicals).
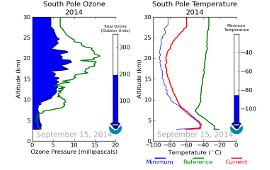
Balloonborne ozone profiles measured
at South Pole: blue is the average of several profiles
measured in September and October during 1967-1971
before the Antarctic ozone hole; red is on the day
of the maximum ozone loss in 2001; green is the lowest
total ozone recorded in 1986, the first year of GMD's
sounding program at the South Pole. Total column ozone
is given in Dobson Units (DU) for each of the profiles.
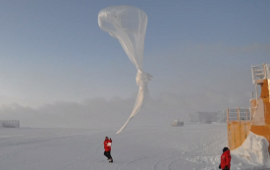
GMD's history in the South Pole ozone program
Ozone monitoring by NOAA and its predecessors at the Amundsen-Scott South Pole
Station goes back to 1961 when the first Dobson spectrophotometer measurements
were made. These measurements are still continuing. Dobson
instruments, as well as satellite instruments such as TOMS, measure ozone by
detecting the amount of solar ultraviolet radiation able to penetrate through
the stratospheric ozone layer. Reduced ozone results in increased ultraviolet
(the reason that the ozone layer is important). Since these instruments are
inoperable at the South Pole during the dark winter, the NOAA GMD
began weekly ozone balloon soundings from the South
Pole in 1986. During the austral spring (September to November), the sounding
frequency is increased to about 3 per week in an ongoing study of the Antarctic
Ozone Hole. These soundings have revealed total destruction of springtime ozone
in the 14 to 19 km altitude region of the stratosphere. The lowest springtime
total ozone measured during the 1986-1997 period at the South Pole was 89 Dobson
Units (DU) on October 12, 1993. This may be compared with values of about 300 DU
in October 1970.
Other information about the ozone hole and ozone layer:
NOAA News Items on the Ozone Hole
.jpg)