
The Measurements: How We Get the Data
Collecting Air Samples
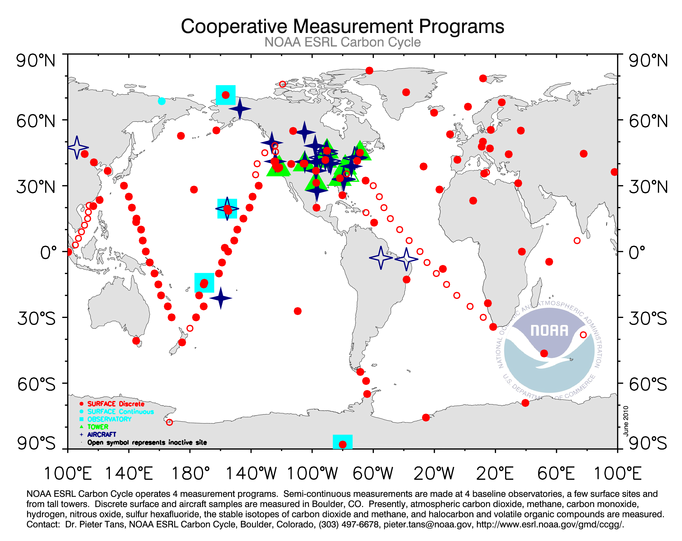
NOAA scientists, affiliates, and volunteers collect weekly air samples at over 60 sites worldwide. Every sample is measured for its δ 13C value, and a portion of them are currently analyzed for Δ14C. With this many samples and analyses each week (over 6,000 in a year for δ13C alone!), the sampling process needs to be incredibly organized. The method of collection is also required to be the same every time at every site. Only with this consistency are NOAA scientists able to compare data over time and at different locations. NOAA atmospheric scientists also compare their measurements to values from other laboratories across the world–ensuring that these measurements are consistent and accurate.
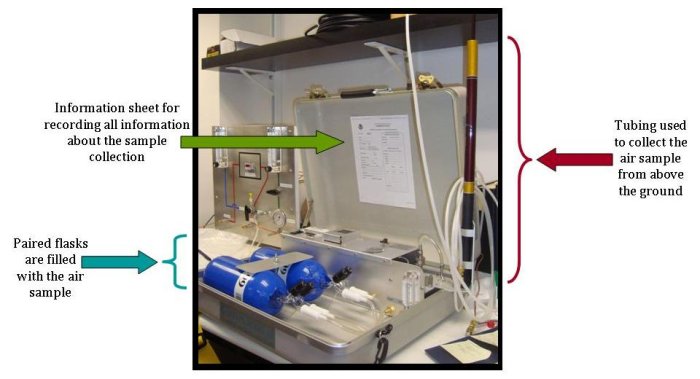
During every step of the collection and analysis process, the sample is tested to make sure that the quality of the data is as precise as possible. The first check actually begins at the collection site. Two sample flasks are filled simultaneously with air. Since this air is collected at the exact same time and exact same location, the air in each flask (a flask is just the glass container in which the air is stored) should be identical. Later, when analyzing the samples, if the two flasks disagree by even a small amount, the data point is flagged with a warning, telling scientists, the public, and anyone interested in the data, that there may have been a problem with the collection, analysis process, or the flask holding the air (perhaps it leaked during transport).
You can also watch videos with footage of the collection process and an explanation of all the data gathered from a single flask:
Finding a Δ14C and δ13C Value from a Flask of Air
Once an air flask is safely returned to the laboratory, it is time to analyze the air, first for concentrations of greenhouse gases, and then for δ13C and Δ14C. When measuring isotopes to high precision, NOAA scientists follow a series of steps:
- Extract a subsample of air from the flasks.
- Remove other gases and water vapor present in the sample so that carbon dioxide remains.
- Use a mass spectrometer to measure the relative amounts of each isotope in the remaining carbon dioxide and find the isotopic ratio.
Always with the Three C's in Mind
At every step of the collection and analysis process, scientists focus on obtaining the best data possible. Although there are some limitations in the mass spectrometers' abilities to detect very small differences among samples, the precision and quality of the isotope data is the best that is currently possible. All collection and analysis is done as carefully as possible so that the sample is not contaminated with laboratory air.
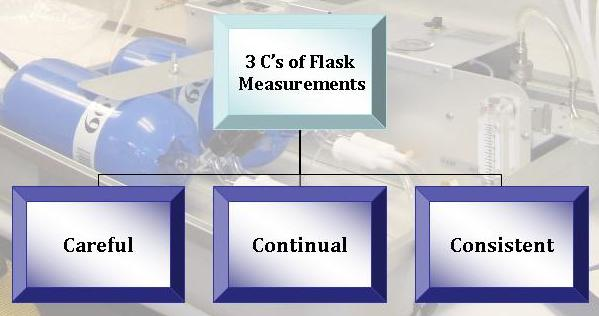
Consistency among the two flasks is also required; this increases both scientists' and the public's confidence in the values from an air flask. If, at the end of the entire process, the two flasks have very similar values, scientists can be more confident that there were no events that may have accidently affected the quality of the data. Several other tests are routinely performed to ensure the quality and consistency of the data. Standard materials with a known isotopic composition are regularly measured to ensure the instrumentation is functioning properly and at the required precision (the difference between different measurements from the same sample) and accuracy (the difference between the measured value and the true value for a single sample). At some sites, several different labs collect samples at the same time and place, and compare their results to make sure that they agree.
Only with continual monitoring can we see exactly how the isotopic ratios of air samples change over time. Continual monitoring allows scientists to see seasonal, as well as annual, trends. It also increases confidence in the patterns shown in the data–we are much more likely to believe that a trend is due to seasonal changes if we see the same trend during the same season year after year. This is only possible with continual monitoring.
 Previous
