1. What are ecoregions?
Ecoregions are the actual scale on which CarbonTracker performs its
optimization over the land. Ecoregions are meant to represent large
expanses of land within a given continent having similar ecosystem
types, and are used to divide continents into smaller pieces for
analysis. The ecosystem types use in CarbonTracker are derived from
the
Olson [1992] vegetation classification (Table 1,
Figure 1).
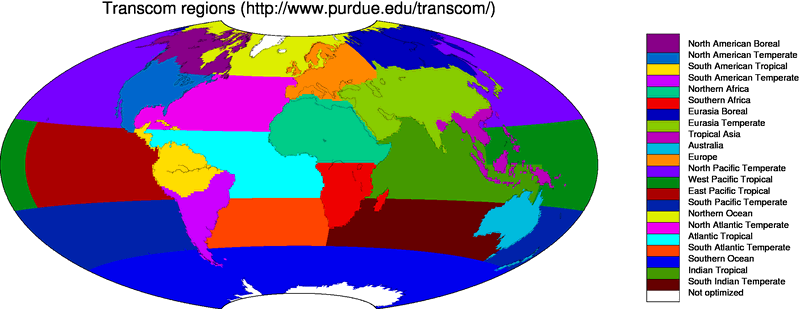
We define an ecoregion as an ecosystem type within a given
Transcom land region. There are 11 such Transcom land regions (Figure
2), so there are 11*19 = 209 possible ecoregions. However, not all
ecosystem types are present in all Transcom regions, and the actual
number of land ecoregions ends up being 126.
Note on "Semitundra": this is a potentially misleading shorthand
abbreviation for a collection of ecosystems comprising semi-desert,
shrubs, steppe, and polar+alpine tundra. The "Semitundra" zones
appearing in northern Africa where one expects to find the Sahara
desert are not, of course, tundra environments. They are instead
semi-desert zones.
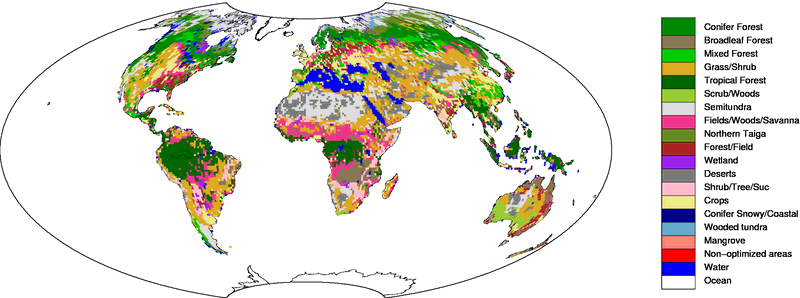
Figure 1. Global distribution of Olson ecosystem types.
Table 1. Ecosystem areas over the two Transcom regions covering North America.
| Ecosystem Type | North American Boreal | North American Temperate |
| | Area (km2) | Percentage | Area (km2) | Percentage |
Conifer Forest | 2315376 | 22.9% | 1607291 | 14.0% |
Broadleaf Forest | - | - | 269838 | 2.4% |
Mixed Forest | 592291 | 5.9% | 930813 | 8.1% |
Grass/Shrub | 53082 | 0.5% | 2515582 | 21.9% |
Tropical Forest | - | - | 58401 | 0.5% |
Scrub/Woods | - | - | 416520 | 3.6% |
Semitundra | 3396292 | 33.6% | 866468 | 7.6% |
Fields/Woods/Savanna | 29243 | 0.3% | 1020939 | 8.9% |
Northern Taiga | 1658773 | 16.4% | - | - |
Forest/Field | 61882 | 0.6% | 1243174 | 10.8% |
Wetland | 322485 | 3.2% | 66968 | 0.6% |
Deserts | - | - | 21934 | 0.2% |
Shrub/Tree/Suc | - | - | 11339 | 0.1% |
Crops | - | - | 1969912 | 17.2% |
Conifer Snowy/Coastal | 41440 | 0.4% | 73437 | 0.6% |
Wooded tundra | 360388 | 3.6% | 6643 | 0.1% |
Mangrove | - | - | - | - |
Non-optimized areas | - | - | - | - |
Water | 1269485 | 12.6% | 384728 | 3.4% |
Total | 10100736 | 100.0% | 11463986 | 100.0% |
2. Why use
ecoregions?
A fundamental challenge to atmospheric inversions like CarbonTracker
is that there are not enough observations to directly constrain fluxes
at all times and in all places. It is therefore necessary to find a
way to reduce the number of unknowns being estimated. Strategies to
reduce the number of unknowns in problems like this one generally
impose information from external sources. In CarbonTracker, we reduce
the problem size both by estimating fluxes at the ecoregion scale, and
by using a terrestrial biological model to give a first guess flux
from the ecoregion. The model is also used to give the spatial and
temporal distribution of CO2 flux within a
region and week.
2. Ecosystems within Transcom regions
Each Transcom land region (Figure 2) can contain up to 19 ecoregions.
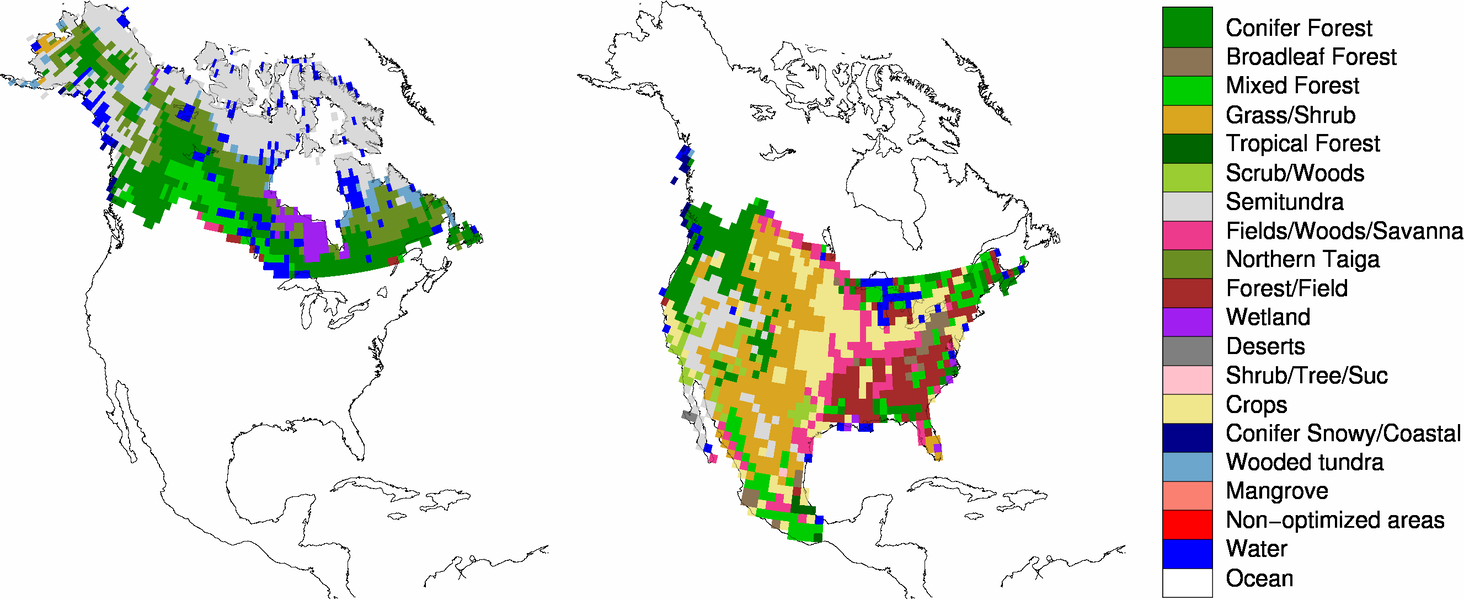
Figure 3. Ecoregions within the North American Boreal (left) and North American Temperate (right) Transcom regions.
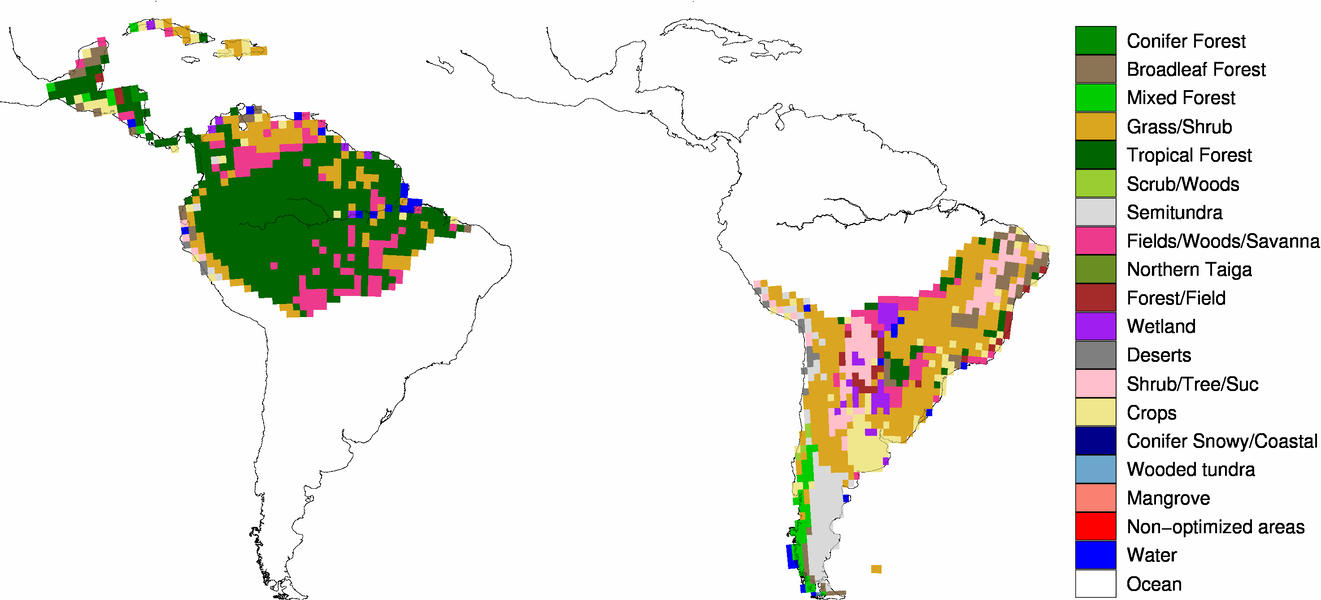
Figure 4. Ecoregions within the South American Tropical (left) and South American Temperate (right) Transcom regions.
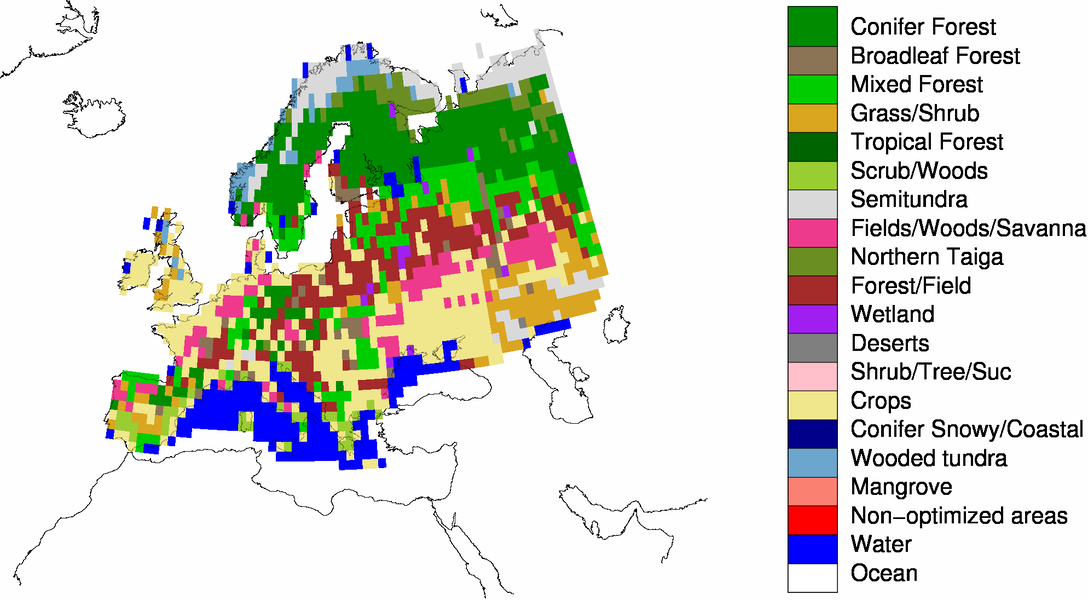
Figure 5. Ecoregions within the Europe Transcom region.
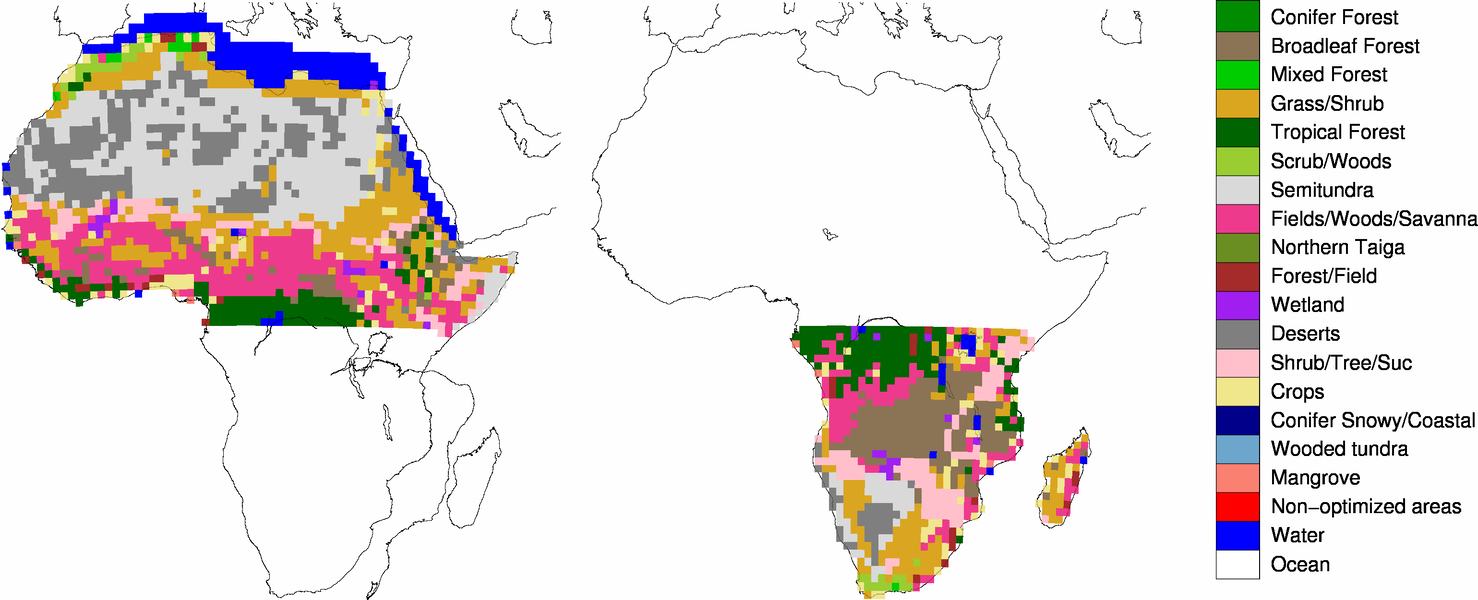
Figure 5. Ecoregions within the Northern Africa (left) and Southern Africa (right) Transcom regions.
3. Further Reading