1. Introduction
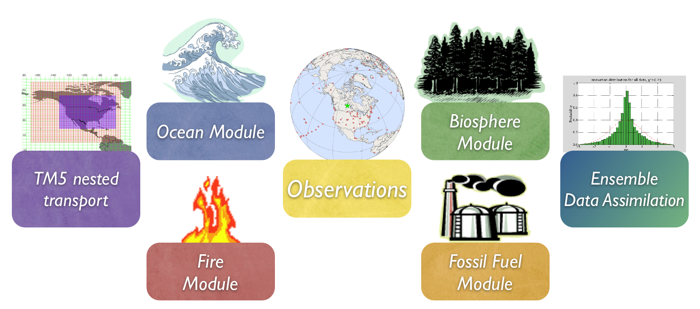
The observations of CO2 mole fraction by NOAA ESRL and partner laboratories are at the heart of CarbonTracker. They inform us on changes in the carbon cycle, whether they are regular (such as the seasonal growth and decay of leaves and trees), or irregular (such as the release of tons of carbon by a wildfire). The results in CarbonTracker depend directly on the quality and amount of observations available, and the degree of detail at which we can monitor the carbon cycle reliably increases strongly with the density of our observing network.
2. Detailed Description
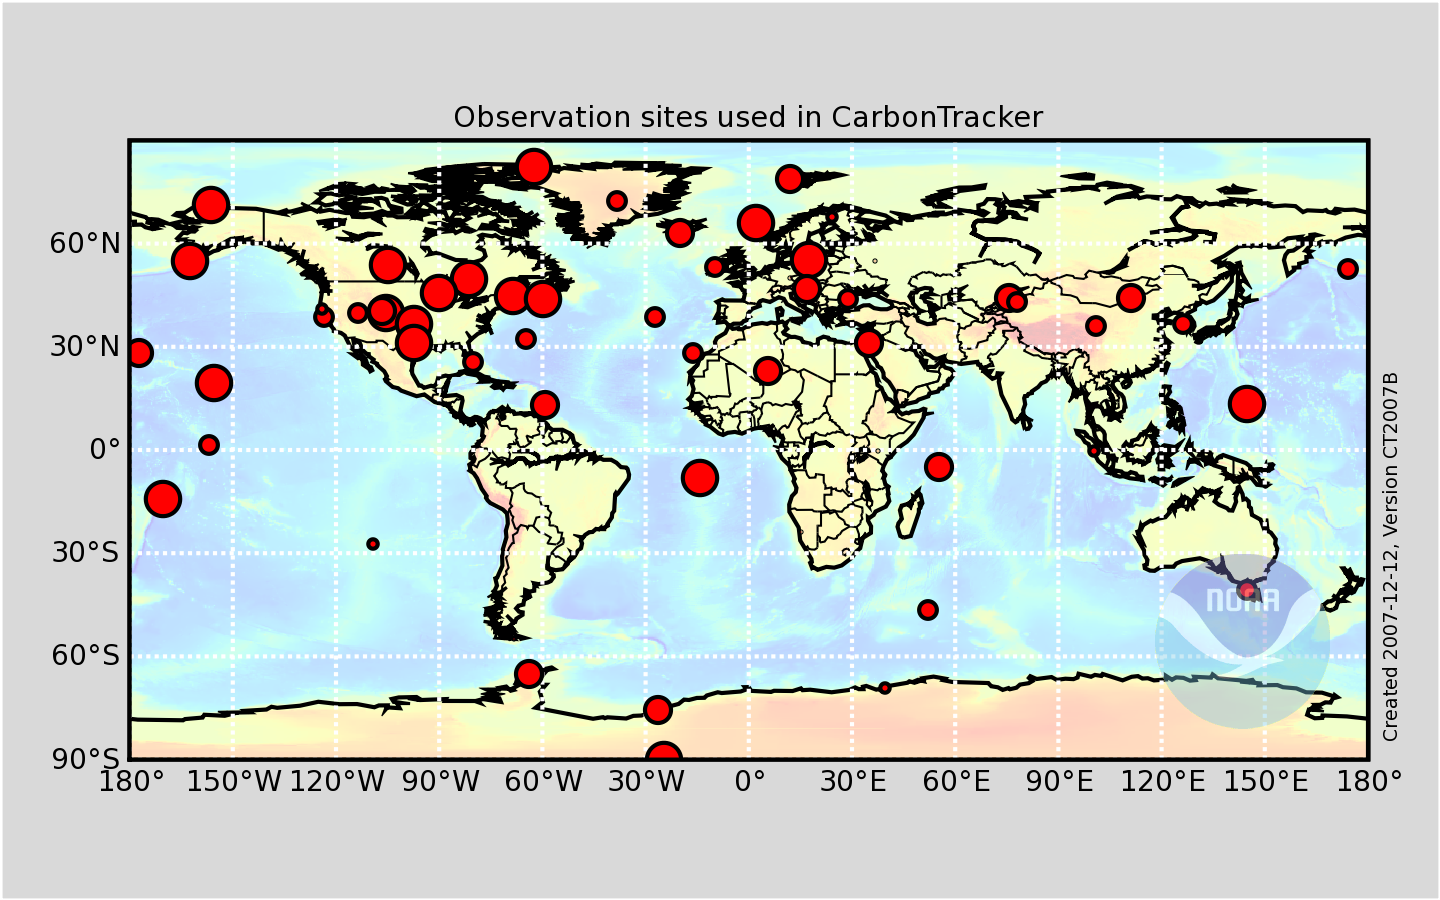
This study uses all analyzed air samples taken at the surface from the NOAA ESRL Cooperative Air Sampling Network available for each year studied, except those flagged for analysis or sampling problems, or those thought to be influenced by local sources. The composition of the network thus varies per week depending on successful sampling and analysis, and each site's sampling frequency. In addition, we use in situ quasi-continuous CO2 time series from seven towers: (1) the 396m level of the WLEF tower in Wisconsin; (2) the 107m level of the AMT tower in Argyle, Maine; (3) the 251m level of the KWKT tower in Texas; (4) the 40m level of the tower in Fraserdale, Canada operated by Environment Canada (EC); (5) the 23m level of the tower at Candle Lake (formerly Old Black Spruce), Canada operated by EC; (6) the 9m level of the tower at Storm Peak Laboratory operated by NCAR; and (7) the 5m level of the tower at Niwot Ridge operated by NCAR. Other in situ quasi-continuous CO2 time series used are from the NOAA ESRL observatories at Barrow, Mauna Loa, Samoa, and South Pole, and the EC programs at Alert, Canada and Sable Island, Canada. Note that all of these observations are calibrated against the same world CO2 standard (WMO-2005). Also, note that aircraft observations from the NOAA ESRL program were NOT assimilated, but used for independent assessment of the CarbonTracker results.
At the tower-based quasi-continuous sampling sites, we construct one daytime average (12:00-16:00 Local Standard Time) mole fraction for each day from the time series, recognizing that our atmospheric transport model does not always capture the continental nighttime stability regime while daytime well-mixed conditions are better matched. At mountain-top sites (MLO, NWR, and SPL), we use midnight-4:00 LST averages as this tends to be the most stable time period and avoids periods of upslope flows that contain local vegetative and/or anthropogenic influence. Moreover, observations at sub-daily time scales are likely to be strongly correlated and therefore add relatively little independent information to our results. Also based on Transcom continuous simulations, we decided to move a set of coastal sites by one degree into the ocean to force the model sample to be more representative of the actual site conditions. These sites are labeled for reference in the complete table of sites used in CarbonTracker.
We apply a further selection criterion during the assimilation to exclude non-Marine Boundary Layer (MBL) observations that are very poorly forecasted in our framework. We use the so-called model-data mismatch in this process, which is the random error ascribed to each observation to account for measurement errors as well as modeling errors of that observation. We interpret an observed-minus-forecasted (OmF) mole fraction that exceeds 3 times the prescribed model-data mismatch as an indicator that our modeling framework fails. This can happen for instance when an air sample is representative of local exchange not captured well by our 1x1 degree fluxes, when local meteorological conditions are not captured by our offline transport fields, but also when large-scale CO2 exchange is suddenly changed (e.g. fires, pests, droughts) to an extent that can not be accommodated by our flux modules. This last situation would imply an important change in the carbon cycle and has to be recognized by the researchers when analyzing the results. In accordance with the 3-sigma rejection criterion, ~2% of the observations are discarded through this mechanism in our assimilations. Table 1 gives a summary of the observing sites used in CarbonTracker and the assimilation performance.
| Code | Name | Lat, Lon, Elev | Lab | N used | N flagged | mismatch | Inn X2
| | alt_06c0 | Alert, Nunavut, Canada | 82 27'N, 62 31'W, 200.0m | EC | 2347 | 0 | 2.50 | 0.20 |
| amt_01c3 | Argyle, Maine, United States | 45 2'N, 68 41'W, 50.0m | ESRL | 996 | 8 | 3.00 | 0.67 |
| brw_01c0 | Barrow, Alaska, United States | 71 19'N, 156 36'W, 11.0m | ESRL | 1951 | 1 | 2.50 | 0.31 |
| cdl_06c3 | Candle Lake, Saskatchewan, Canada | 53 59'N, 105 7'W, 628.0m | EC | 1388 | 4 | 3.00 | 0.65 |
| frd_06c3 | Fraserdale, Canada | 49 53'N, 81 34'W, 210.0m | EC | 2321 | 11 | 3.00 | 0.51 |
| lef_01c3 | Park Falls, Wisconsin, United States | 45 56'N, 90 16'W, 472.0m | ESRL | 2116 | 11 | 3.00 | 0.61 |
| mlo_01c0 | Mauna Loa, Hawaii, United States | 19 32'N, 155 35'W, 3397.0m | ESRL | 1260 | 0 | 0.75 | 0.82 |
| nwr_03c3 | Niwot Ridge, Colorado, United States | 40 3'N, 105 35'W, 3523.0m | NCAR | 395 | 0 | 3.00 | 0.26 |
| sbl_06c3 | Sable Island, Nova Scotia, Canada | 43 56'N, 60 1'W, 5.0m | EC | 1180 | 11 | 3.00 | 0.47 |
| smo_01c0 | Tutuila, American Samoa | 14 14'S, 170 34'W, 42.0m | ESRL | 2206 | 0 | 0.75 | 1451.49 |
| spl_03c3 | Storm Peak Laboratory (Desert Research Institute), United States | 40 27'N, 106 44'W, 3210.0m | NCAR | 470 | 0 | 3.00 | 0.39 |
| spo_01c0 | South Pole, Antarctica, United States | 89 59'S, 24 48'W, 2810.0m | ESRL | 2440 | 0 | 0.75 | 0.27 |
| wkt_01c3 | Moody, Texas, United States | 31 19'N, 97 20'W, 251.0m | ESRL | 859 | 8 | 3.00 | 0.72 |
| alt_01d0 | Alert, Nunavut, Canada | 82 27'N, 62 31'W, 200.0m | ESRL | 334 | 0 | 1.50 | 0.46 |
| asc_01d0 | Ascension Island, United Kingdom | 7 55'S, 14 25'W, 54.0m | ESRL | 594 | 0 | 0.75 | 1.09 |
| ask_01d0 | Assekrem, Algeria | 23 11'N, 5 25'E, 2728.0m | ESRL | 306 | 0 | 1.50 | 0.40 |
| azr_01d0 | Terceira Island, Azores, Portugal | 38 46'N, 27 23'W, 40.0m | ESRL | 223 | 4 | 1.50 | 0.94 |
| bal_01d0 | Baltic Sea, Poland | 55 21'N, 17 13'E, 3.0m | ESRL | 549 | 0 | 7.50 | 0.43 |
| bkt_01d0 | Bukit Kototabang, Indonesia | 0 12'S, 100 19'E, 864.5m | ESRL | 106 | 0 | 7.50 | 0.67 |
| bme_01d0 | St. Davids Head, Bermuda, United Kingdom | 32 22'N, 64 39'W, 30.0m | ESRL | 207 | 8 | 1.50 | 1.27 |
| bmw_01d0 | Tudor Hill, Bermuda, United Kingdom | 32 16'N, 64 53'W, 30.0m | ESRL | 236 | 2 | 1.50 | 1.04 |
| brw_01d0 | Barrow, Alaska, United States | 71 19'N, 156 36'W, 11.0m | ESRL | 315 | 2 | 1.50 | 0.72 |
| bsc_01d0 | Black Sea, Constanta, Romania | 44 10'N, 28 41'E, 3.0m | ESRL | 268 | 1 | 7.50 | 0.75 |
| cba_01d0 | Cold Bay, Alaska, United States | 55 12'N, 162 43'W, 25.0m | ESRL | 530 | 23 | 1.50 | 1.26 |
| cgo_01d0 | Cape Grim, Tasmania, Australia | 40 41'S, 144 41'E, 94.0m | ESRL | 286 | 0 | 1.50 | 0.10 |
| chr_01d0 | Christmas Island, Republic of Kiribati | 1 42'N, 157 10'W, 3.0m | ESRL | 265 | 0 | 0.75 | 1.72 |
| crz_01d0 | Crozet Island, France | 46 27'S, 51 51'E, 120.0m | ESRL | 229 | 0 | 0.75 | 0.36 |
| eic_01d0 | Easter Island, Chile | 27 9'S, 109 27'W, 50.0m | ESRL | 163 | 0 | 7.50 | 0.03 |
| gmi_01d0 | Mariana Islands, Guam | 13 26'N, 144 47'E, 1.0m | ESRL | 533 | 0 | 1.50 | 0.40 |
| hba_01d0 | Halley Station, Antarctica, United Kingdom | 75 35'S, 26 30'W, 30.0m | ESRL | 327 | 0 | 0.75 | 0.31 |
| hun_01d0 | Hegyhatsal, Hungary | 46 57'N, 16 39'E, 248.0m | ESRL | 322 | 1 | 7.50 | 0.45 |
| ice_01d0 | Storhofdi, Vestmannaeyjar, Iceland | 63 20'N, 20 17'W, 118.0m | ESRL | 308 | 1 | 1.50 | 0.51 |
| izo_01d0 | Tenerife, Canary Islands, Spain | 28 18'N, 16 29'W, 2360.0m | ESRL | 247 | 2 | 1.50 | 1.07 |
| key_01d0 | Key Biscayne, Florida, United States | 25 40'N, 80 12'W, 3.0m | ESRL | 227 | 0 | 2.50 | 0.34 |
| kum_01d0 | Cape Kumukahi, Hawaii, United States | 19 31'N, 154 49'W, 3.0m | ESRL | 314 | 0 | 1.50 | 0.41 |
| kzd_01d0 | Sary Taukum, Kazakhstan | 44 27'N, 75 34'E, 412.0m | ESRL | 322 | 1 | 2.50 | 0.98 |
| kzm_01d0 | Plateau Assy, Kazakhstan | 43 15'N, 77 53'E, 2519.0m | ESRL | 283 | 1 | 2.50 | 1.22 |
| mhd_01d0 | Mace Head, County Galway, Ireland | 53 20'N, 9 54'W, 25.0m | ESRL | 265 | 0 | 2.50 | 0.22 |
| mid_01d0 | Sand Island, Midway, United States | 28 13'N, 177 23'W, 3.7m | ESRL | 311 | 0 | 1.50 | 0.65 |
| mkn_01d0 | Mt. Kenya, Kenya | 0 3'S, 37 18'E, 3897.0m | ESRL | 75 | 0 | 2.50 | 1.04 |
| mlo_01d0 | Mauna Loa, Hawaii, United States | 19 32'N, 155 35'W, 3397.0m | ESRL | 363 | 0 | 1.50 | 0.24 |
| nmb_01d0 | Gobabeb, Namibia | 23 35'S, 15 2'E, 456.0m | ESRL | 20 | 0 | 2.50 | 0.15 |
| nwr_01d0 | Niwot Ridge, Colorado, United States | 40 3'N, 105 35'W, 3523.0m | ESRL | 310 | 1 | 1.50 | 0.82 |
| obn_01d0 | Obninsk, Russia | 55 7'N, 36 36'E, 183.0m | ESRL | 88 | 0 | 7.50 | 0.38 |
| oxk_01d0 | Ochsenkopf, Germany | 50 4'N, 11 48'E, 1193.0m | ESRL | 42 | 4 | 2.50 | 1.29 |
| pal_01d0 | Pallas-Sammaltunturi, GAW Station, Finland | 67 58'N, 24 7'E, 560.0m | ESRL | 187 | 2 | 2.50 | 0.79 |
| poc_01d1 | Pacific Ocean, N/A | 99 59'S, 999 59'W, 10.0m | ESRL | 1415 | 0 | 7.50 | 0.03 |
| psa_01d0 | Palmer Station, Antarctica, United States | 64 55'S, 64 0'W, 10.0m | ESRL | 328 | 0 | 0.75 | 0.53 |
| pta_01d0 | Point Arena, California, United States | 38 57'N, 123 44'W, 17.0m | ESRL | 212 | 0 | 7.50 | 0.37 |
| rpb_01d0 | Ragged Point, Barbados | 13 10'N, 59 26'W, 45.0m | ESRL | 317 | 0 | 1.50 | 0.83 |
| sey_01d0 | Mahe Island, Seychelles | 4 40'S, 55 10'E, 3.0m | ESRL | 304 | 0 | 0.75 | 1.08 |
| sgp_01d0 | Southern Great Plains, Oklahoma, United States | 36 48'N, 97 30'W, 314.0m | ESRL | 530 | 9 | 2.50 | 0.84 |
| shm_01d0 | Shemya Island, Alaska, United States | 52 43'N, 174 6'E, 40.0m | ESRL | 253 | 2 | 2.50 | 0.78 |
| smo_01d0 | Tutuila, American Samoa | 14 14'S, 170 34'W, 42.0m | ESRL | 369 | 0 | 1.50 | 0.17 |
| spo_01d0 | South Pole, Antarctica, United States | 89 59'S, 24 48'W, 2810.0m | ESRL | 344 | 0 | 1.50 | 0.05 |
| stm_01d0 | Ocean Station M, Norway | 66 0'N, 2 0'E, 0.0m | ESRL | 597 | 1 | 1.50 | 0.76 |
| sum_01d0 | Summit, Greenland | 72 35'N, 38 29'W, 3238.0m | ESRL | 231 | 0 | 1.50 | 0.47 |
| syo_01d0 | Syowa Station, Antarctica, Japan | 69 0'S, 39 35'E, 11.0m | ESRL | 163 | 0 | 0.75 | 0.55 |
| tap_01d0 | Tae-ahn Peninsula, Republic of Korea | 36 44'N, 126 8'E, 20.0m | ESRL | 233 | 1 | 7.50 | 0.55 |
| tdf_01d0 | Tierra Del Fuego, Ushuaia, Argentina | 54 52'S, 68 29'W, 20.0m | ESRL | 90 | 0 | 0.75 | 0.44 |
| thd_01d0 | Trinidad Head, California, United States | 41 3'N, 124 9'W, 107.0m | ESRL | 184 | 19 | 2.50 | 1.55 |
| uta_01d0 | Wendover, Utah, United States | 39 54'N, 113 43'W, 1320.0m | ESRL | 293 | 1 | 2.50 | 0.31 |
| uum_01d0 | Ulaan Uul, Mongolia | 44 27'N, 111 6'E, 914.0m | ESRL | 320 | 0 | 2.50 | 0.73 |
| wis_01d0 | Sede Boker, Negev Desert, Israel | 31 8'N, 34 53'E, 400.0m | ESRL | 342 | 1 | 2.50 | 0.73 |
| wlg_01d0 | Mt. Waliguan, Peoples Republic of China | 36 17'N, 100 54'E, 3810.0m | ESRL | 215 | 5 | 1.50 | 1.10 |
| zep_01d0 | Ny-Alesund, Svalbard, Norway and Sweden | 78 54'N, 11 53'E, 475.0m | ESRL | 399 | 2 | 1.50 | 0.79 |
| all | Total | | | 36223 | 148 | 0.00 | 87.57 |
3. Further Reading
|