|
|
Estimates of CO2 sources and sinks
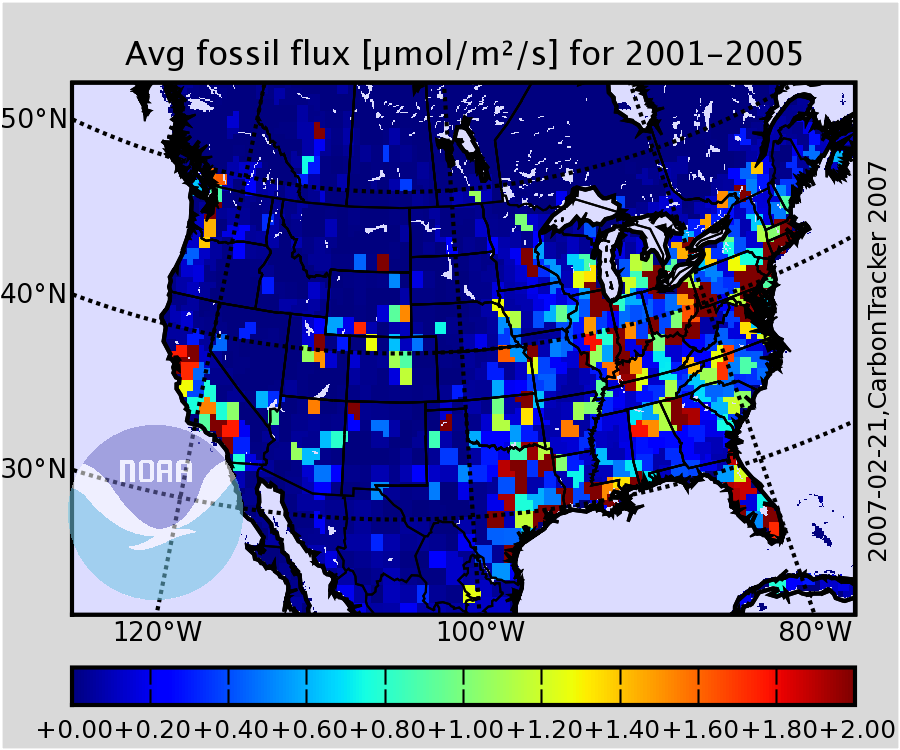
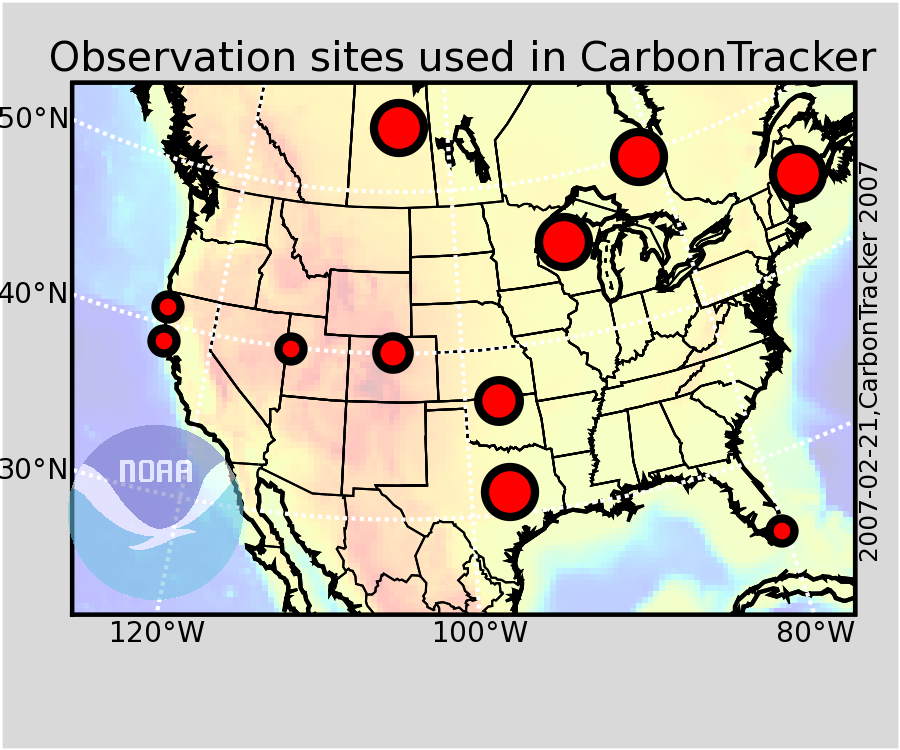
We present the inaugural version of a combined measurement and modeling system that keeps track of the emissions and removal of atmospheric CO2 globally from January 2001 to December 2005. Ecosystems in North America have been a net sink of -0.65 ± 0.75 PgC/yr (1015 gC/yr) during this period, partially offsetting emissions of 1.9 PgC/yr from the burning of fossil fuels in the U.S.A., Canada and Mexico combined. Our estimates include sub-continental patterns of sources/sinks coupled to the distribution of dominant ecosystem types across the continent (see Figures 1 and 2). The sinks are mainly located in the agricultural regions of the Midwest (30%), deciduous forests along the East Coast (32%), and boreal coniferous forests (22%). There also appears to be substantial interannual variation of the sink, correlated with temperature and moisture variations. The estimates are optimally consistent with measurements of 14,000 weekly air samples from across the world, ~5,000 daily averages of continuously measured CO2 at sites surrounding the continent and ~ 5,000 daily averages from tall towers at four locations within the continent (see Figure 3).
Calculated time-dependent CO2 fields throughout the atmosphere
A "byproduct" of the data assimilation system, once sources and sinks have been estimated, is that the mole fraction of CO2 is calculated everywhere in the model domain and over the entire 2001-2005 time period, based on the source/sink estimates. As a check on model transport properties, calculated CO2 mole fractions were compared with measurements of ~9,000 air samples taken by NOAA/ESRL on aircraft over North America, which had not been used in the estimation of sources/sinks. Column averages of the CO2 mole fraction have been calculated as well, and they can be compared to satellite measurements of the same quantity when the averaging is done in the same way as for the satellite results.
Uncertainties
It is important to note that at this time the uncertainty estimates for the sources/sinks are themselves quite uncertain. They have been derived from the mathematics of the data assimilation system, which required several "educated guesses" for initial uncertainty estimates, and did not take into account several additional factors noted below. The calculation was set up for sources/sinks to slowly revert, in the absence of observational data, to "first guesses" of close to zero net annual mean for ecosystems. This procedure may have produced a bias. Also due to the sparseness of measurements, we had to assume coherence of ecosystem processes over large distances, giving existing observations perhaps an undue amount of weight. The process model for terrestrial photosynthesis and respiration was very "basic", and will likely be greatly improved in future releases of CarbonTracker. Easily the largest single annual mean source of CO2 is emissions from fossil fuel burning, which are currently not estimated by CarbonTracker. We use estimates from emissions inventories and subtract those from the total sources derived by CarbonTracker. A small relative error in the inventories would thus translate into a larger relative error in the annual mean ecosystem sources/sinks that have smaller magnitudes. We expect to add a process model of fossil fuel combustion in future releases of CarbonTracker. Finally, additional measurement sites are expected to lead to the greatest improvements, especially to more credible and specific source/sink results at smaller spatial scales.
|