Slide 8 of 13
Notes:
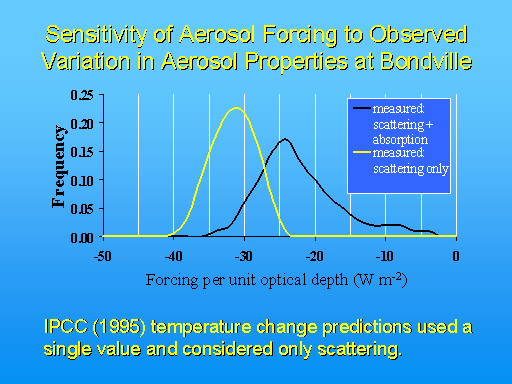
- Given the observed variation in aerosol optical properties over the past 15 months at Bondville…what would the corresponding variation in TOA forcing be?
- Forcing per unit optical depth on x-axis, frequency that value was observed on the y
- If considering scattering aerosol only (w0 = 1.0), the peak in the frequency distribution represents a net TOA forcing of ~ -32 W m-2 per unit AOD
- If observed absorption is considered, the distribution broadens considerably and the peak shifts to the right (lessens the negative TOA forcing)