Introduction
NOAA/ESRL has maintained both particle light scattering and absorption measuring instruments at the Barrow, Alaska station (BRW) since 1988 (light scattering measurements have actually been made since 1976). To obtain data representative of clean baseline conditions, measurements from the polluted sector (as determined by wind speed and direction) are automatically removed from the data set. Hence, we are looking only at uncontaminated scattering and absorption measurements. In 1997, a major upgrade to the system at BRW was done and both the original and upgrade systems were run in parallel. Here we describe a comparison between measurements for the original system and the upgrade system which are referred to as BRW and NSA respectively.
Table 1 lists the instruments and their period of operation at the site. Initially, light scattering was measured using a 4 wavelength nephelometer and light absorption was measured using an Aethalometer. This original sampling system did not include size or relative humidity control of the aerosol sample.
Table 1. Description of instrumentation at BRW and NSA
|
Instrument |
Period of operation |
Station i.d. |
Comments |
|
MRI nephelometer. |
1976- Fall, 1998 |
BRW |
4 wavelength, no size cut |
|
Magee Scientific Aethalometer |
1988 - 2003 |
BRW |
Wavelength unknown no size cut Specific absorption of 10 m2/g used to convert [BC] to absorption (m-1) |
|
TSI nephelometer (#3563) |
Fall, 1997-present |
NSA |
3 wavelength, 1 and 10 um size cut |
|
Radiance Research Particle soot absorption photometer (PSAP) |
Fall, 1997-present |
NSA |
565 nm wavelength 1 and 10 um size cut |
The new system includes a valve which switches between a 10 µm and 1 µm impactor so that scattering and absorption for the two size cuts are measured. Relative humidity is maintained at 40%. The BRW and NSA systems were operated simultaneously for approximately 1 year (Fall, 1997 - Fall, 1998). In the fall of 1998 the 4 wavelength nephelometer was removed from operation. In 2003 the aethalometer was removed from operation.
In this note, we compare the one year of simultaneous light scattering and two years of light absorption measurements from the co-located instruments at BRW and NSA. It is important to understand how the measurements from these instrument sets compare in order to understand data consistency for the entire period of measurement, i.e., how the historical data relate to the measurements made in the new system.
Methods
Data from all instruments are readily available on the ESRL aerosol website. The comparison procedure was:
- Select data for the overlap period DOY 279, 1997 to DOY 278, 1998 (1999 for sap).
- Calculate the absorption coefficient for the aethalometer using: sap = 10 m2/g * [BC]
- Apply the QC edit corrections (e.g., remove spikes and contaminated data)
- For the NSA data set, remove 1 mm size cut data.
- Correct the NSA PSAP data for: (a) scattering by particles within the filter and (b) spot size. Also, remove low transmittance data (e.g. transmittance < 0.5 as per (Bond et al.,1999)
- Calculate hourly averages of scattering and absorption coefficients for each instrument (i.e., sspB, sspG, sspR, and sapG for NSA and BRW). Calculate daily averages of absorption for the Aethalometer and PSAP
- Remove obvious outliers (there were four for the sap data).
- Plot the data against each other and do the linear regression to find the slope of the line and the correlation coefficient (do the regression for both a calculated y-intercept and with the y-intercept set to 0).
Results
Overall, the linear fits suggest that the BRW measurements were consistently lower than the NSA measurements. The sap measurements, Table 2 gives the fit parameters and correlation coefficients for absorption coefficient and Table 3 provides the same information for scattering coefficient.
Absorption coefficient
Figure 1 shows that, for the two years, on an hourly basis, there is a relatively low correlation between the PSAP and Aethalometer measurements (R2=0.70) although the instruments agree fairly well - the slope is 0.94. Looking at the data on a year-by-year basis, we see that the two instruments demonstrated better agreement with each other for the second year period than for the first year (slope = 0.99, R2=0.77). This difference is statistically significant but it's unclear what caused this difference.
For daily-averaged data (Figure 2), there is a stronger relationship between the two instruments' measurements than for hourly averaged data and, again, good agreement for the two measurements of absorption coefficient. Because particle concentration and hence, light absorption, are low at the site, often near the detection limits of the two instruments, there is considerable noise in the measurements. The improvement in fit for the daily averaged values with respect to the hourly averaged values is most likely a result of averaging noise in the data over a longer time period.

Figure 3 shows the variability in the ratio of the two instrument measurements as a function of absorption coefficient. The relationship between the two instruments appears less variable at higher absorption coefficients (sap > 1 Mm-1) but only about 10% of the data are in this range. It is unfortunate that the polluted data are not recorded so that we could compare the instrument responses at higher particle concentrations. At low absorption values (sap < 1 Mm-1) there is considerable variability due to the instrument noise. Interestingly, while the Aethalometer data are lower than PSAP for high absorption coefficients (consistent with the linear fit results) the Aethalometer measurements are lower than than the PSAP's at low sap.
Table 2
Results from linear fits of data to equations: (1) BRW = m*NSA + b (2) BRW = m*NSA for absorption coefficient (units for sap and intercept are Mm-1)
| Parameter | Slope, intercept | Coeff. of Determin. (R2) | Slope, 0 intercept | Coeff. of Determin. (R2), 0 intercept | Number of points |
|---|---|---|---|---|---|
|
sap (hourly) Year 1 |
0.78 ± 0.01, 0.17 ± 0.58 |
0.71 ± 0.01 |
0.92 ± 0.01 |
0.66 ± 0.01 |
3456 |
|
sap (hourly) Year 2 |
0.86 ± 0.01 0.09 ± 0.31 |
0.81 ± 0.01 |
0.99 ± 0.01 |
0.77 ± 0.01 |
3562 |
|
sap (hourly) both years |
0.81 ± 0.01 0.10 ± 0.46 |
0.74 ± 0.01 |
0.94 ± 0.01 |
0.70 ± 0.01 |
7018 |
|
sap (daily) Year 1 |
0.81 ± 0.02 0.11 ± 0.27 |
0.92 ± 0.01 |
0.94 ± 0.03 |
0.88 ± 0.02 |
223 |
|
sap (daily) Year 2 |
0.91 ± 0.02 0.07 ± 0.16 |
0.92 ± 0.01 |
1.03 ± 0.03 |
0.87 ± 0.02 |
226 |
|
sap (daily) both years |
0.84 ± 0.02 0.11 ± 0.23 |
0.92 ± 0.01 |
0.96 ± 0.02 |
0.89 ± 0.01 |
449 |
Other questions also arise: How much do the differences in wavelength of the two instruments influence sabs? Is some of the variability due to differences in polluted sector data removal - does NSA use same wind data as BRW? Are there corrections which should be applied to the Aethalometer: for example some sort of spot size correction? How appropriate is the arbitrarily chosen 10 m2/g?
Scattering coefficient
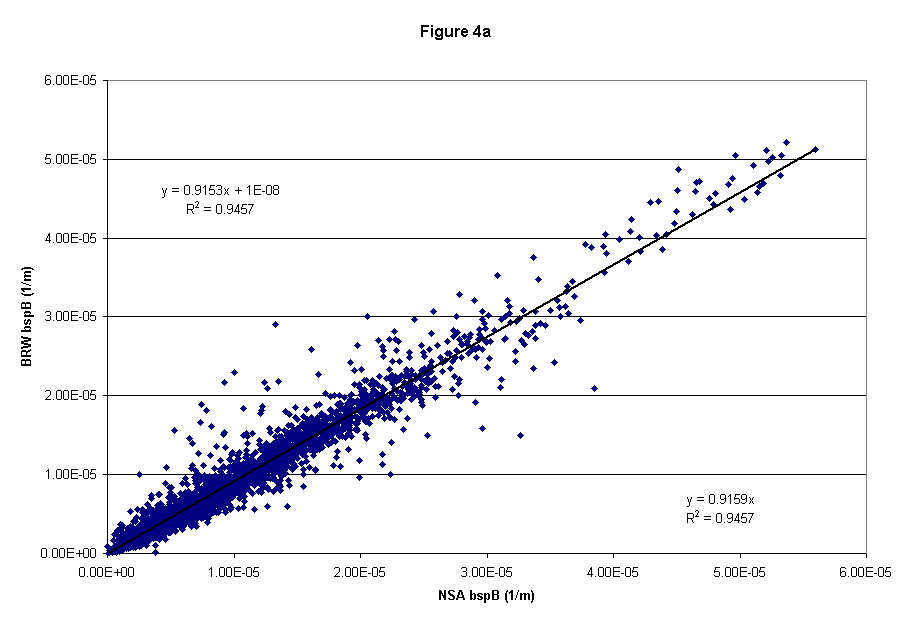
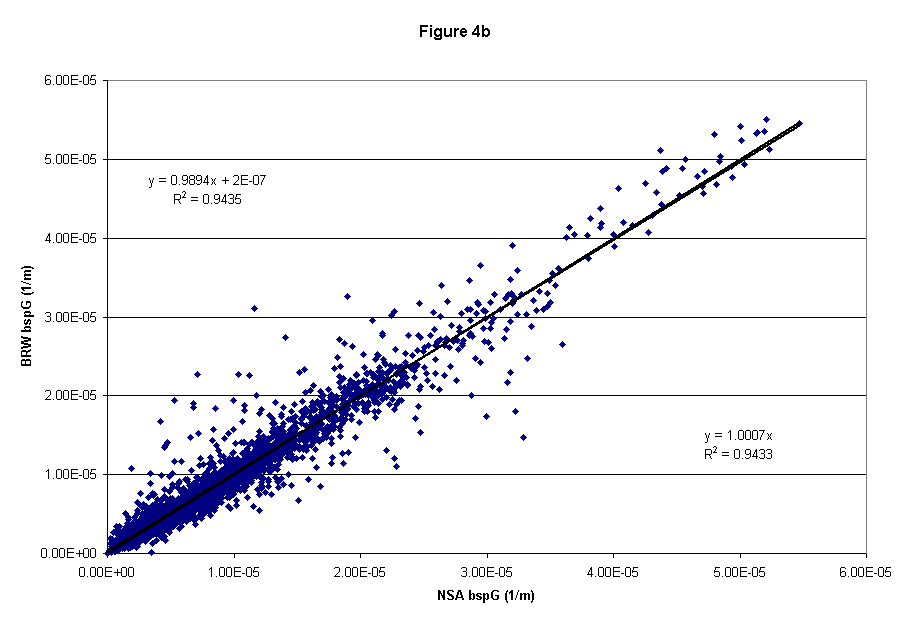
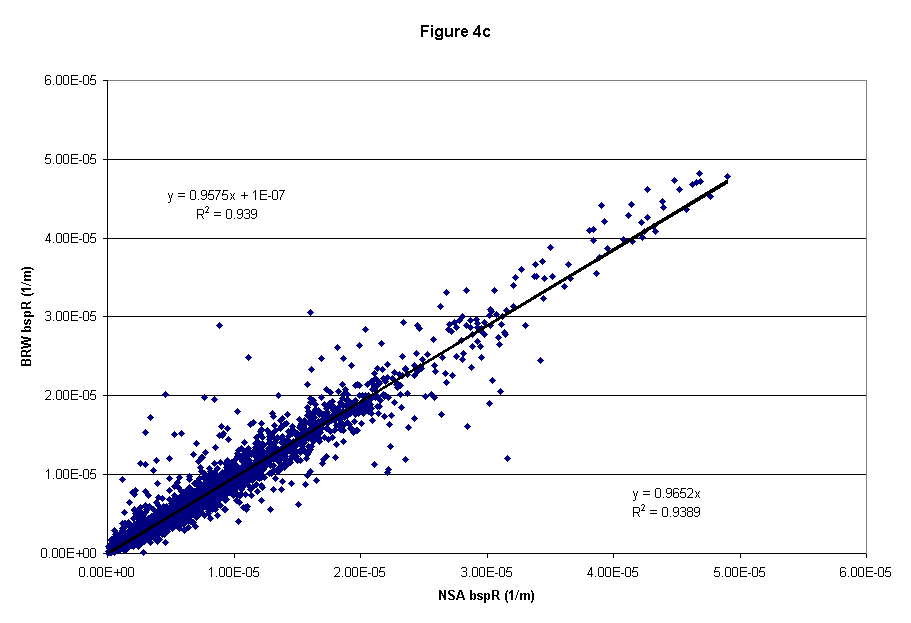
For the two nephelometers there is high correlation, despite low particle concentrations and hence low scattering measurements. The blue scattering coefficients show the largest discrepancy. This may be due to problems with the blue photo-multiplier in the BRW nephelometer. The blue scattering measurement at BRW was often similar to or even lower than the green scattering measurement, while at NSA the sspB /sspG ratio was typically greater than 1 as expected (see Figure 4a,b,c).
 Figure 4a (blue scattering)
 Figure 4b (green scattering)
 Figure 4c (red scattering)
Table 3
Results from linear fits of data to equations: (1) BRW = m*NSA + b (2) BRW = m*NSA for scattering coefficient (units for ssp and intercept are Mm-1)
| Parameter | Slope, intercept | Coeff. of Determin. (R2) | Slope, 0 intercept | Coeff. of Determin. (R2), 0 intercept | Number of points |
|---|---|---|---|---|---|
|
sspB |
0.92 ± 0.01, 0.01 ± 5.1 |
0.94 ± 0.00 |
0.92 ± 0.00 |
0.95 ± 0.01 |
3456 |
|
sspG |
0.99 ± 0.01, 0.18 ± 3.6 |
0.94 ± 0.00 |
1.00 ± 0.00 |
0.94 ± 0.01 |
3456 |
|
sspR |
0.97 ± 0.01, 0.18 ± 3.4 |
0.94 ± 0.00 |
0.97 ± 0.00 |
0.94 ± 0.01 |
3456 |
The 95% confidence interval for the y intercept is much larger than the predicted y-intercept. This is due in part to the variability in y with x. The confidence interval is bigger for ssp than sap, which is counterintuitive since sap has more variability (i.e., R2 is smaller for sap). For the sample sizes we have, the confidence interval for b is basically a linear function of syx= ((yactual - yestimated)2/N)0.5. Since the average ssp (~10 Mm-1) is bigger than the average ssp (~0.5 Mm-1), it is likely that the value of syx will be bigger even if the percent differences are smaller.
For example, if we had:
yestimated =0.95xactual+0.01 and xactual = 10, yactual = 8.56, for bspG
yestimated =0.80xactual+0.10 and xactual = 0.39, yactual = 0.37, for bap
N*syx,bspG = (8.56-9.51)2 =0.9025; but the ratio of the difference between actual and estimated is: 8.56/9.51=0.90
N*syx,bap = (0.39-0.41) 2=0.0004; but the ratio of the difference between actual and estimated is: 0.37/0.41=0.90
Differences between the two instruments may be attributable to several factors. Optically, the two nephelometers are (almost) identical, so it was assumed that correcting for truncation angle would not improve the comparison, thus for this comparison no corrections for truncation were applied to either instrument. Changes in filter bandpass and calibration error may also play a role.


