Consumer-Specific Evaluation Research
Consumer-Specific Evaluation Research is research into the connection between the forecast weather quality and the application of the weather information to specific operational decisions. The Forecast Verification Section is aggressively developing assessment techniques that provide a measure of forecast quality in the context of operation decisions. These operational measures provide the bridge between the forecast weather and the integration of the weather information into automated operational decisions. Evaluation concepts in the context of aviation strategic planning are the focus for current Forecast Impact and Quality Assessment Section efforts. These include: incorporating strategic planning decision points for accumulation of the statistical measures; introducing operational spatial domains, such as ARTCC boundaries, high level altitude sectors, and aviation flow control boundaries (e.g. AFP and ground stops) into the assessment mechanics to bring together the forecasts and observations in an operationally meaningful way; and developing metrics that link forecast quality directly to operational constraints such as air space capacity for feeding assessment information directly to automated NextGen decision tools.
Consumer-Specific Techniques
Min-cut Bottleneck and Euclidean Distance Supplemental Forecast Evaluation Sector-based Verification
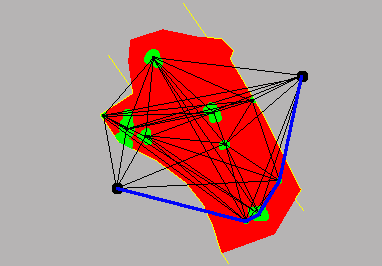
Example of Min-cut Bottleneck approach. Red area represents a sector, green areas represent convective weather, and black lines represent all configurations of distance between the weather elements.Two methods for estimating sector capacity reduction due to the presence and orientation of convection have been developed, Euclidean Distance and Mincut Bottleneck. Both methods utilize the identification of significant convection overlaid onto a sector and the estimation of the direction of traffic flow by bounding the sector to an ellipse to identify the length and orientation of the major axis.
The Euclidean Distance approach estimates capacity by calculating the distance to the nearest non-zero valued pixel of convection and the edge of the sector. A buffer is then applied as an avoidance zone from the sector's boundary and an avoidance zone from convection. The area, major axis length and orientation, as well as the maximum distance found in the buffered Euclidean distance field is then calculated and compared to that of the sector with no convection present. If the major axis of the Euclidean distance field does not approximate the length of the sector with no convection present, there are no open lanes to get air traffic to one end of the sector to the other and the sector is said to be completely closed. If the field does meet the length of the sector with no convection present, a ratio of the areas of the buffered regions and the maximum Euclidean distances are used as estimates of sector capacity.
The Mincut Bottleneck approach estimates capacity by calculating the minimum distance across the sector from a source and sink node (perpendicular to the major axis of the sector) using convective objects as nodes. The minimum distance found from the forecast and observation for the particular sector is then compared to the sector without convection to get its estimate of capacity. The convective objects may be dilated to estimate an air traffic avoidance field. The Mincut Bottleneck methodology for sector capacity reduction estimates comes from proposed air space management for NextGen applications (Krozel et al., 2004).
Reference:
Lack, S., G. Layne, M. Kay, S. Madine, J.L. Mahoney, 2009: AN OPERATIONAL PERSPECTIVE FOR EVALUATING CONVECTIVE NOWCASTS FOR AVIATION. Preprint, WMO Symposium on Nowcasting, 30 Aug-4 Sep 2009, Whistler, B.C., Canada
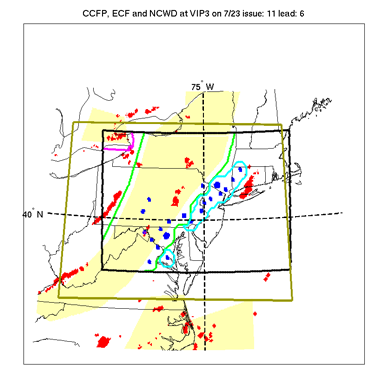
Domain decomposition on 23 July 2007 issued at 11 UTC valid at 17 UTC. Blue objects represent ECF yellow/red regions only. Red objects represent observations at VIP level 3 or greater. The yellow regions indicate CCFP (sparse coverage/ low confidence). Green outlines the YY domain. Cyan outlines the YN domain. Magenta outlines the NY domain. The remaining region is the NN domain. The black outline represents the verification domain.In order to evaluate deterministic forecast products as supplemental to other operational forecast products, joint probability distributions (JPD), which shows forecast agreement and disagreement, are utilized. The JPD, in this case, does not include the observation. The observation is only used in forecast verification after forecast agreement and disagreement is determined.
Forecast agreement is indicated when any supplemental forecast falls within an operational forecast polygon or where there is no supplemental forecast and no operational forecast polygon. Similarly, forecast disagreement occurs when operational forecast is issued without collocation of the supplemental forecast, or when supplemental forecast is issued without collocation of an operational forecast. The subdomains of disagreement and agreement are set up using rules outlined in the following section. Once these subdomains are set up and observations are added, a variety of verification metrics can be used in each decomposition region to assess the supplementary nature of the forecast products to the operational forecast standard.
Domain Decomposition
For this example, the Collaborative Convecti ve Forecast Product is referred to the operational product and the ENSCO Convective Forecast (ECF) and the WRF Rapid Refresh (WRF) represent the supplemental products. There are 4 subdomains of interest in the decomposition. The YY subdomain is where there is ECF and the WRF forecasts are present within a CCFP forecast polygon. The CCFP polygon basically becomes the bound of the YY subdomain if any ECF or WRF lies within the CCFP polygon. The YN subdomain is where there is ECF or WRF and no CCFP polygon issuance. The NY subdomain is where there is a CCFP polygon and no supplemental (ECF or WRF) forecast. The NN subdomain is simply no forecast issuance from CCFP or the supplemental products. The NCWD observation is added after the forecast domain decomposition. It is important to note that for this exercise we are thresholding the forecast and observation to the definition of convection from the CCFP baseline. That is any convection at greater than or equal to a VIP 3 intensity in the NCWD field, the ECF yellow and red field (2 and 3), and WRF simulated reflectivity at 40 dBZ or higher. The supplemental forecasts (ECF and WRF) and NCWD observations in this study are treated as objects. Objects are defined as regions of continuous pixel coverage after a threshold at the VIP 3 or equivalent level has been applied to the image. The rules for each decomposition subdomain follow.
YY Subdomain
The YY subdomain is given top priority in the decomposition. This means that all NCWD observations and supplementary forecasts are considered for this subdomain first before testing for inclusion into the other subdomain types (i.e., YN, NY, NN). First, all CCFP in the TRACON verification domain are dilated by a factor of 32 km. This factor was used because it also serves as the dilation parameter for ECF and is roughly the median diameter of an ECF polygon when no intensity threshold is applied (Fig. 4). Once all CCFP polygons are dilated, any and all ECF or WRF objects that are fully contained within the dilated CCFP are included in the YY subdomain. Additionally, ECF or WRF objects are considered within the YY subdomain if at least 50% or 30 pixels of the object are within the CCFP dilation area. If an ECF or WRF object is a boundary case and meets the 50% or 30 pixel criteria it is included in the YY subdomain and is dilated using the 32 km buffer. The YY subdomain is tested once again for boundary objects (ECF or WRF). If there are new objects that meet the 50% or 30 pixel criteria the entire object is included; however, no buffer is applied and the YY subdomain reaches its fullest extent. Once the YY subdomain is determined, observations are overlaid and included in the YY subdomain if there is intersection. Additionally, intersection of observations with the YY subdomain that meet the 50% or 30 pixel criteria are included as YY observations with no additional buffer applied.
YN Subdomain
The YN subdomain (ECF or WRF without a CCFP polygon) is given the next priority. Once the YY subdomain is established the remaining ECF and WRF objects are considered. The remaining objects are dilated using the 32-km buffer and where there are intersections between buffered objects an additional dilation is performed coupled with an erosion of the same size to smooth out the YN regions. This effectively couples neighboring ECF or WRF buffered objects to give some hint of added structure outside of the YY subdomain. Observations are coupled with the YN subdomain similarly to the YY methodology.
NY and NN Subdomains
The NY subdomain (CCFP without an ECF or WRF object) is given the last priority as the NN subdomain is simply the residual of the entire TRACON verification subdomain that is neither YY,YN, or NY. The CCFP polygons that are dilated with the 32-km buffer without a supplementary forecast are simply left as the NY subdomain. These subdomains are normally quite small as will be seen in the resulting JPDs later on. Observations are coupled with the NY subdomain similarly to the YY and YN methodology. An example of the domain decomposition is shown in Fig. 5 (ECF) and Fig. 6 (WRF).
Reference:
Madine, S , M. Kay, S., Lack, G. Layne, J.L Mahoney: 2008. FORECAST ASSESSMENT FOR THE NEW YORK 2008 CONVECTIVE WEATHER PROJECT. Report provided to FAA System Operations. Available from Jennifer.Mahoney@noaa.gov.
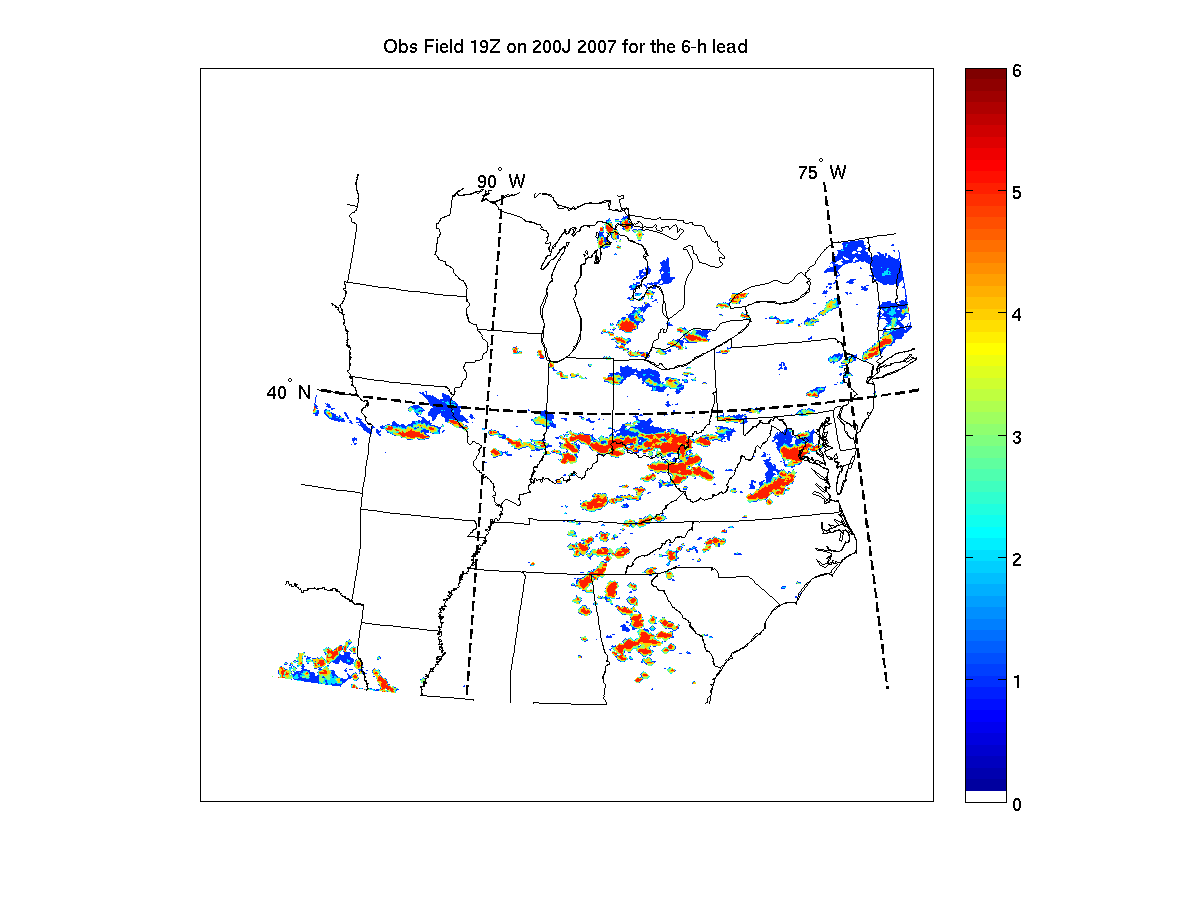
Weather observations over the northeast domain (click image for larger)
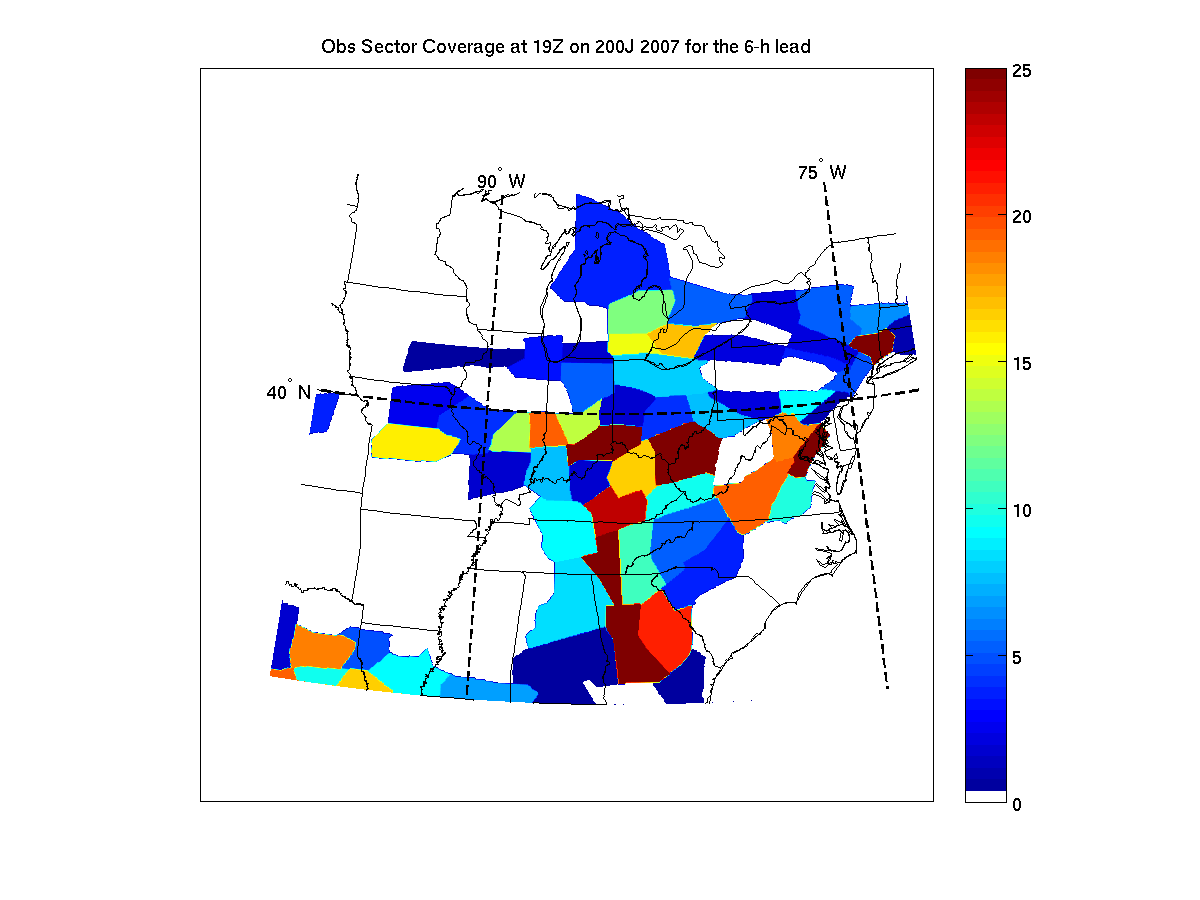
Weather observations converted to sector space. Color scale represents level of convective coverage in a sector space (click image for larger)Strategic planners require convective weather information, specifically the amount and overall pattern of the hazard, to help them determine the air traffic capacity of large-scale regions (e.g., TRACON) of the airspace. High-resolution pixel-to-pixel verification approaches seemingly fail to measure the utility of forecasts, primarily because of the strict requirement that the forecast locate convection exactly to get any positive credit. To account for the shortcomings of the pixel-to-pixel method, the sector-based approach adopts a map of air traffic sectors as common grid on which the forecasts and observations are compared. The sectors naturally represent the spatial granularity of air traffic planning, and they tend to capture traffic flow with the shape and orientation. Kay et al. (2007) used sector-based verification to study convective forecasts from the summer of 2007 and found utility in the approach for aviation-related purposes.
With this approach, the forecasts are transformed from regularly spaced grids to a grid of irregularly shaped sectors, with each assigned a percent coverage value. Based on a climatological study of sector coverage for convection in the month of June 2007 (not shown), this analysis defines a sector as having significant coverage if the areal coverage of either the forecast or observed convection exceeds 5 percent. This threshold was used in Kay et al. (2007) as well.
References:
Madine, S , M. Kay, S., Lack, G. Layne, J.L Mahoney: 2008. FORECAST ASSESSMENT FOR THE NEW YORK 2008 CONVECTIVE WEATHER PROJECT. Report provided to FAA System Operations. Available from Jennifer.Mahoney@noaa.gov. Kay, M., S. Madine, J.L. Mahoney, J. Hart: 2007. CONVECTIVE FORECAST SCIENTIFIC EVALUATION. Report provided to FAA System Operations. Available from Jennifer.Mahoney@noaa.gov