LLLJP Data Comparison: HRDL (vertical-slice scans) / sonic anemometers
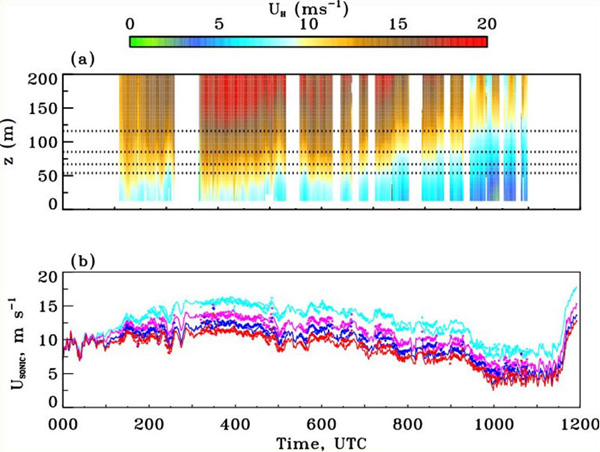
Visual analysis of HRDL-measured variances (top) and sonic anemometer measurements of TKE (bottom) shows good agreement in the evolution of both variables through the night. Dotted lines on top panel indicate levels of sonic anemometer measurement. Regression analysis also shows a high correlation between both instruments.
But comparison of these variables is very sensitive to the vertical binning technique used to obtain the variance profiles from lidar vertical-slice scans. The wind speed observed by sonic anemometers at tower levels and HRDL-measured horizontal velocity at the same levels agreed even better with R^2 of 0.96 and a maximum bias of about 1 m/s, which Kelley at al. (2007) attributed to flow distortion by the tower.
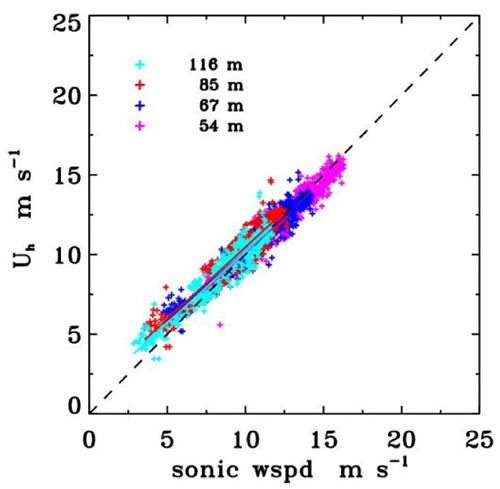
The scatter plots show good agreement between sonic anemometers velocity measurements and HRDL streamwise velocity derived at the same heights.
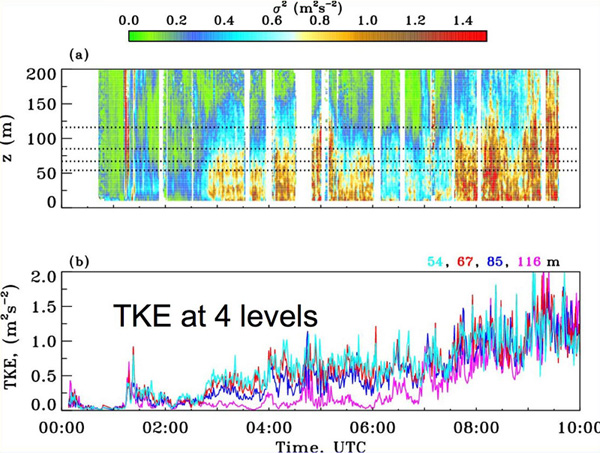
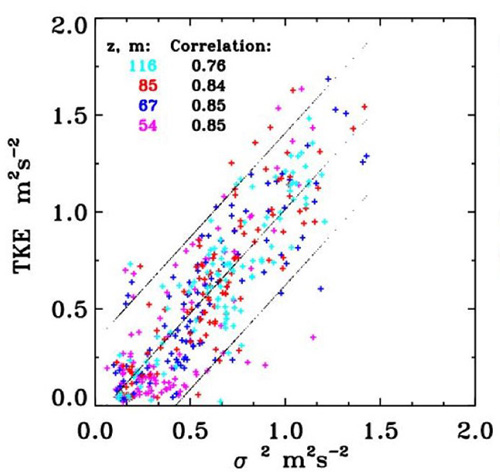
Comparison of the 5 min TKE calculated by sonic anemometers and HRDL streamwise variance, calculated at four different heights.