LLLJP Data Comparison: HRDL (staring) / sonic anemometers
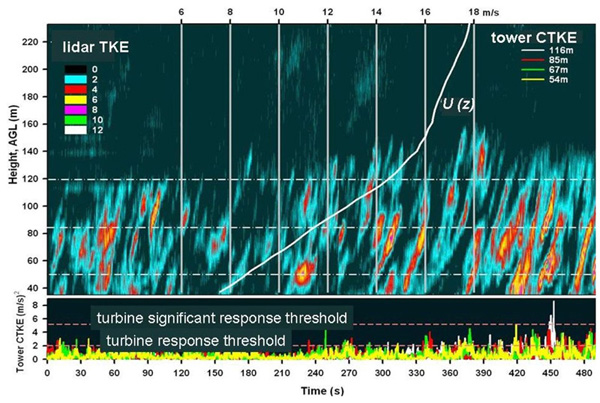
The top panel of the figure shows a sample of a time-height cross section of velocity variance (~TKE) obtained from lidar fixed-beam scans performed at an elevation angle of 10° during night of September 9 from 0729 to 0739 UTC. The HRDL TKE was calculated by removing a 5-min mean from the time series and then squaring the difference. The mean vertical wind profile is superimposed on the plot for the reference. The bottom panel shows the corresponding tower-measured coherent turbulence kinetic energy (CTKE). Abscissa for both plots is given in sec.