LLLJP Data Comparison: HRDL (conical scans) / sodar / sonic anemometers
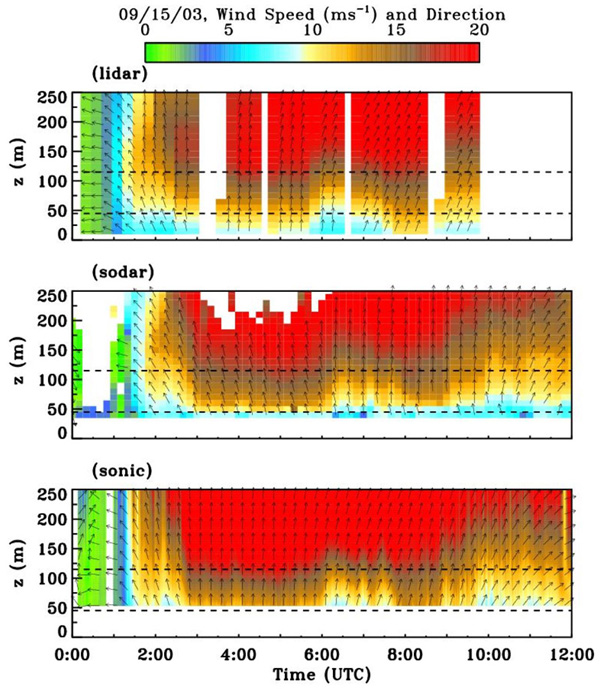
This example shows wind direction and wind speed for the night of September 15, 2003. The top panel presents mean-wind speed and direction data, obtained from lidar conical scans and the middle panel shows sodar data. The bottom panel presents mean winds and directions calculated from sonic anemometer measurements at tower levels of 54, 67, 85 and 116 m, and linearly interpolated between these levels and extrapolated up to 250 m. Dashed lines on all panels show the height of turbine rotors (45-115 m). The arrows in all panels indicate the direction of wind flow, and the color indicates wind speed magnitude from 0 (green) to 20 m s-1 (red). In all panels data averaged over 1-min time intervals.
All three instruments show approximately 6 hours (from 0300 till 0900 UTC) of very strong wind above the level of turbine top, and noticeable veering of wind direction from south to southwest, which occurred on most study nights.