2015 News & Events
Predicting bad air days in Utah's oil and gas fields
14 January 2015

To accurately forecast wintertime bad air days in Utah's Uintah Basin, researchers must use real atmospheric measurements to estimate chemical emissions from nearby oil and natural gas fields, according to the new study in Atmospheric Chemistry and Physics, "Understanding high wintertime ozone pollution events in an oil and natural gas producing region of the western US." When a team of researchers, including those from NOAA and CIRES, fed an air quality model with emissions estimated instead from national and state inventories, they couldn't reproduce those bad air days.
"We can accurately simulate these events," says CSD scientist Stuart McKeen. "The bottom line is how important it is to use air measurements to get these emissions estimates right."
At ground level, ozone is a major pollutant, affecting human health and vegetation. Typically, ozone pollution is a summertime problem in urban and suburban areas, occurring when sunlight-triggered chemical reactions cook up ozone from nitrogen oxides (NOx) and volatile organic compounds (VOCs). Federal health-based standards currently limit ozone to 75 parts per billion (ppb), averaged over 8 hours. The Environmental Protection Agency has proposed tightening that limit to 70 or 65 ppb.
But in the Uintah Basin, wintertime ozone levels spiked as high as 160 parts per billion, measured during a field campaign in 2013. By comparison, during the relatively warmer winter of 2012, ozone levels were far lower.
The researchers already knew a great deal about what causes the wintertime high-ozone episodes. They occur in low-lying geographic basins, common in the western United States, near oil and gas fields, when it's very cold and clear with widespread snow cover. Those conditions trap cold air – including gases released from oil and gas operations – at the Earth's surface. Sunlight passes through the trapped gases and reflects off bright snow back into the atmosphere, triggering ozone production. The snow cover also prevents the ozone from being destroyed by the ground, keeping levels high.

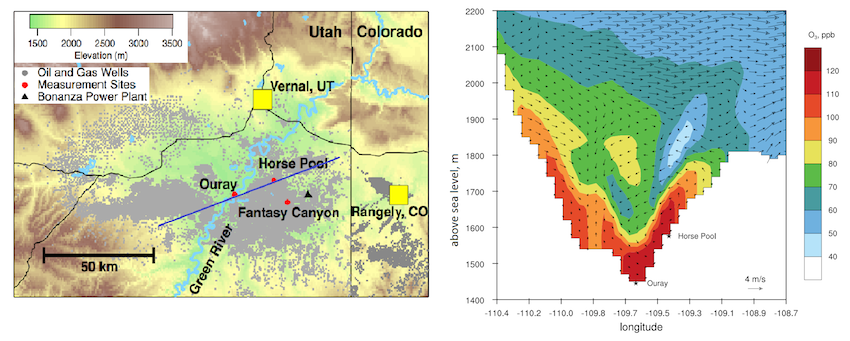
On the right, a figure shows high ozone levels (in red, orange, and yellow) in the Uintah Basin on 5 February 2013, under stagnant conditions with a weak wind. Figure: R. Ahmadov, NOAA / CIRES
The researchers tried to reproduce these high wintertime ozone pollution events using an air quality model (Weather Research and Forecasting with Chemistry, or WRF-Chem) that incorporates meteorological conditions, emissions data, and ozone chemistry. Unlike other studies, this one used the WRF-Chem model to accurately forecast the very stagnant weather conditions important in wintertime ozone formation, as well as to quantify other, more subtle meteorological and chemical processes.
The researchers used two sets of emissions data in their model runs. The first came from the latest EPA inventory for the region, released in 2013. That inventory used emissions estimates from the state of Utah and the Western Regional Air Partnership. The second data set was based on the research team's own measurements of methane, nitrogen oxides, and VOCs taken onsite during the winters of 2012 and 2013.
When the researchers plugged the EPA emissions data into the model, they couldn't reproduce the bad air days. When they used their own measurements of NOx, VOCs and methane from the Uintah Basin site, they could. The study also showed that EPA emissions inventories underestimated levels of methane, an important greenhouse gas, and levels of ozone precursors.
What this means, says the study's lead author and CSD scientist Ravan Ahmadov, is that "with a top-down approach that uses ambient measurements, we have a more accurate representation of what's going on." In addition, Ahmadov says, "we need synergy between research communities, the EPA, and states in using top-down emissions estimates to improve the emissions inventories, especially for the oil and gas sector in the United States, which is changing rapidly."
Ahmadov, Ravan, Stuart McKeen, Michael Trainer, Robert Banta, Alan Brewer, Steven Brown, Peter M. Edwards, Joost A. de Gouw, Gregory J. Frost, Jessica Gilman, Detlev Helmig, Bryan Johnson, Anna Karion, Abigail Koss, Andrew Langford, Brian Lerner, Joseph Olson, Samuel Oltmans, Jeff Peischl, Gabrielle Pétron, Yelena Pichugina, James M. Roberts, Thomas Ryerson, Russell Schnell, Christoph Senff, Colm Sweeney, Chelsea Thompson, Patrick R. Veres, Carsten Warneke, Robert Wild, Eric J. Williams, Bin Yuan, and Robert Zamora, Understanding high wintertime ozone pollution events in an oil and natural gas producing region of the western US, Atmospheric Chemistry and Physics, doi:10.5194/acp-15-411-2015, 2015.
Abstract
Recent increases in oil and natural gas (NG) production throughout the western US have come with scientific and public interest in emission rates, air quality and climate impacts related to this industry. This study uses a regional scale air quality model WRF-Chem to simulate high ozone (O3) episodes during the winter of 2013 over the Uinta Basin (UB) in northeastern Utah, which is densely populated by thousands of oil and NG wells. The high resolution meteorological simulations are able to qualitatively reproduce the wintertime cold pool conditions that occurred in 2013, allowing the model to reproduce the observed multi-day buildup of atmospheric pollutants and accompanying rapid photochemical ozone formation in the UB.
Two different emission scenarios for the oil and NG sector were employed in this study. The first emission scenario (bottom-up) was based on the US EPA National Emission Inventory (NEI) (2011, version 1) for the oil and NG sector for the UB. The second emission scenario (top-down) was based on the previously derived estimates of methane (CH4) emissions and a regression analysis for multiple species relative to CH4 concentration measurements in the UB. WRF-Chem simulations using the two emission data sets resulted in significant differences for concentrations of most gas-phase species. Evaluation of the model results shows greater underestimates of CH4 and other volatile organic compounds (VOCs) in the simulation with the NEI-2011 inventory than the case when the top-down emission scenario was used. Unlike VOCs, the NEI-2011 inventory significantly overestimates the emissions of nitrogen oxides (NOx), while the top-down emission scenario results in a moderate negative bias. Comparison of simulations using the two emission data sets reveals that the top-down case captures the high O3 episodes. In contrast, the simulation case using the bottom-up inventory is not able to reproduce any of the observed high O3 concentrations in the UB. A sensitivity analysis reveals that the major factors driving high wintertime O3 in the UB are shallow boundary layers with light winds, high emissions of VOCs from oil and NG operations compared to NOx emissions, enhancement of photolysis fluxes and reduction of O3 loss from deposition due to snow cover. Simple emission reduction scenarios show that the UB O3 production is VOC sensitive and NOx insensitive. The model results show a disproportionate contribution of aromatic VOCs to O3 formation relative to all other VOC emissions. We also present modeling results for winter of 2012, when high O3 levels were not observed in the UB. The air quality model together with the top-down emission framework presented here may help to address the emerging science and policy related questions surrounding the environmental impact of oil and NG drilling in western US.