Tropospheric Chemistry: Measurements
Datasets for Modellers
Created to improve the ability to incorporate NOAA WP-3D airborne chemistry data sets into large-scale models. Provided ICARTT-formatted data files from all the major chemically-instrumented NOAA WP-3D aircraft field projects since 1999. There are three data files for each flight day:
- First file contains one-minute averages of faster-response (typically 1Hz) meteorological, gas-phase, and particulate-phase data for a given flight.
- Second file contains these faster-response data averaged over the whole air sampler (WAS) open/close times for a given flight.
- Third file contains the WAS data on hydrocarbons, halocarbons, and other trace species.
Each project website contains more information and details of the specific measurements. As a convenience, each of the file types are put together into a single .tar file and embedded in the 'Modellers data download'. Additional data files (IGOR format, individual data files - not specifically for modellers) are available from the specific experiment websites.
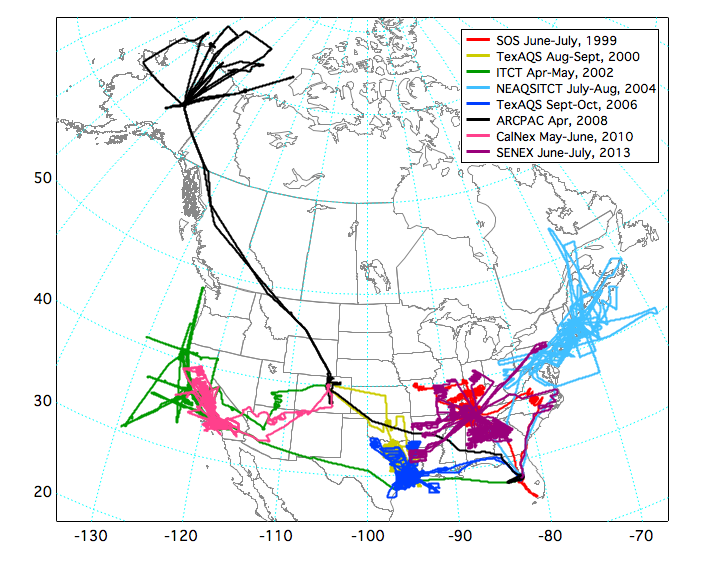
Major aircraft field campaigns
2010 CalNex (California Nexus Research at the Nexus of Air Quality and Climate Change) based in Ontario, California during May - June 2010.
- CalNex 2010 Modellers data download
- CalNex 2010 project website
- CalNex 2010 Overview paper: Ryerson et al. (2013), The 2010 California Research at the Nexus of Air Quality and Climate Change (CalNex) field study, Journal of Geophysical Research, doi:10.1002/jgrd.50331, 2013.
2008 ARCPAC (Aerosol, Radiation, and Cloud Processes affecting Arctic Climate) based in Fairbanks, Alaska during March - April 2008.
- ARCPAC 2008 Modellers data download
- ARCPAC 2008 project website
- ARCPAC 2008 Overview paper: Brock et al. (2011), Characteristics, sources, and transport of aerosols measured in spring 2008 during the aerosol, radiation, and cloud processes affecting Arctic climate (ARCPAC) project, Atmospheric Chemistry and Physics, doi:10.5194/acp-11-2423-2011.
2006 TexAQS (Texas Air Quality Study) based in Houston, Texas during Sept-Oct, 2006.
- TexAQS 2006 Modellers data download
- TexAQS 2006 project website
- TexAQS 2006 Overview paper: Parrish, D. D., et al. (2009), Overview of the Second Texas Air Quality Study (TexAQS II) and the Gulf of Mexico Atmospheric Composition and Climate Study (GoMACCS), Journal of Geophysical Research, doi:10.1029/2009JD011842.
2004 NEAQS-ITCT (New England Air Quality - International Transport and Chemical Transformation) based in Portsmouth, New Hampshire during 5 July - 15 August 2004.
- NEAQS-ITCT 2004 Modellers data download
- NEAQS-ITCT 2004 project website
- NEAQS-ITCT 2004 Overview paper: Fehsenfeld, F. C., et al. (2006), International Consortium for Atmospheric Research on Transport and Transformation (ICARTT): North America to Europe—Overview of the 2004 summer field study, Journal of Geophysical Research, doi:10.1029/2006JD007829.
2002 ITCT (Intercontinental Transport and Chemical Transformation) based in Monterey, CA during April - May 2002.
- ITCT 2002 Modellers data download
- ITCT 2002 project website
- ITCT 2002 Overview paper: Parrish, D. D., et al. (2004), Intercontinental Transport and Chemical Transformation 2002 (ITCT 2K2) and Pacific Exploration of Asian Continental Emission (PEACE) experiments: An overview of the 2002 winter and spring intensives, Journal of Geophysical Research, doi:10.1029/2004JD004980.
2000 TexAQS (Texas Air Quality Study) based in Houston, Texas during August - September 2000.
- TexAQS 2000 Modellers data download
- TexAQS 2000 project website
- TexAQS 2000 Overview paper: none.
1999 SOS (Southern Oxidants Study) based in Nashville, Tennessee during June - July 1999.
- SOS 99 Modellers data download
- SOS 99 project website
- SOS 99 Overview paper: none.
Calculation of the averages
When calculating the averages for both data sets, there is no requirement for the minimum number of valid points in that average, to be consistent with how NASA calculates their merge files. Also, after talking to different PIs, there was no optimum number of points to require since under different conditions (plumes, altitudes, etc.) there would be different numbers of points to get a representative average for different measurements.