R/V Ronald H. Brown Daily Summaries
Daily Summary August 2, 2002, DOY = 214
The ship spent the day offshore between the IOS and Cape Ann sampling E/SE flow. Higher wind speeds (10 m/s) produced seasalt aerosol again and a strong supermicron aerosol scattering signal. Sonde launches are now being coordinated with a phone call to Pease International. At 2130 ultrafine CN concentrations (and long lived anthropogenic HC?) rose abruptly. This appeared to be associated with mixing from the free troposphere as seen by a decrease in RH and a pulse of higher barometric pressure. At 2300 the wind shifted to the SSW bringing increasing concentrations of O3, SO2, and aerosol scattering.
For all plots, time is indicated in GMT. Eastern time is -5 hours.
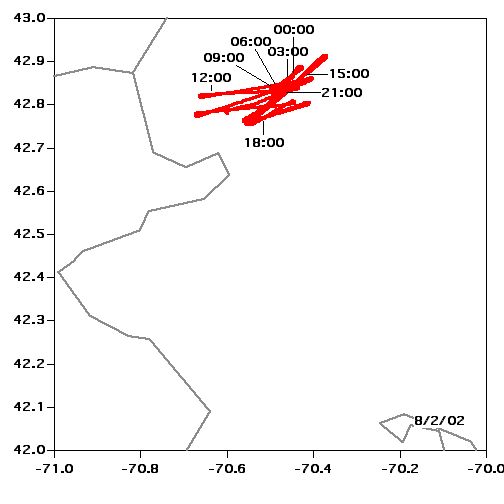 Location |
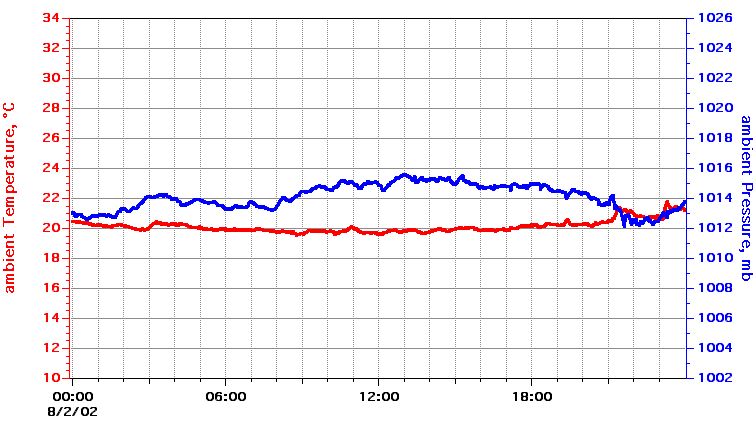 Temperature, Pressure |
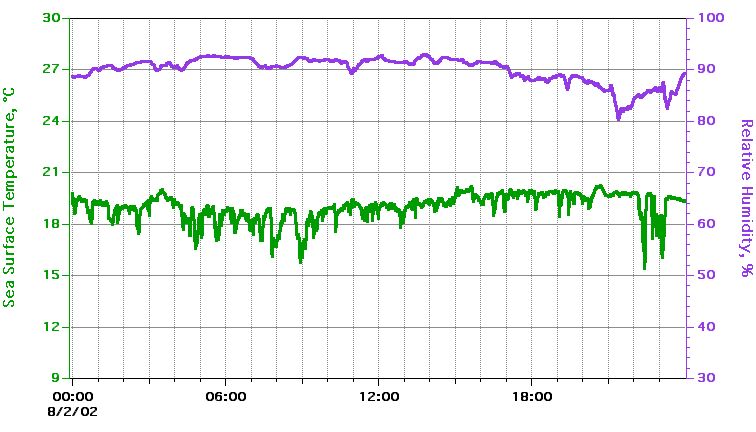 Sea Surface Temperature, Relative Humidity |
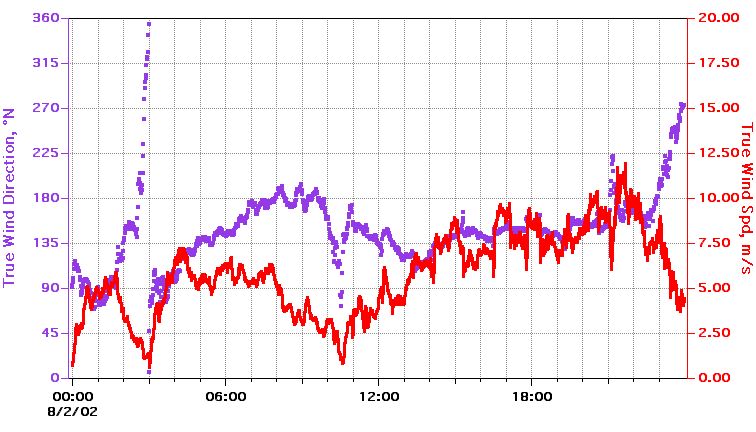 True Wind Speed, Direction |
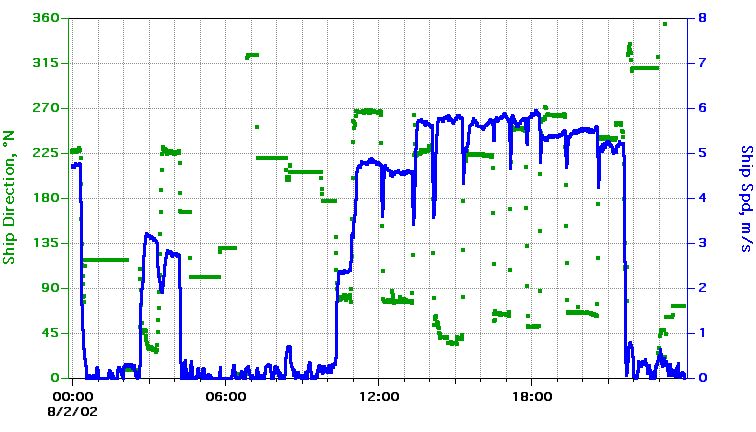 Ship Speed, Direction |
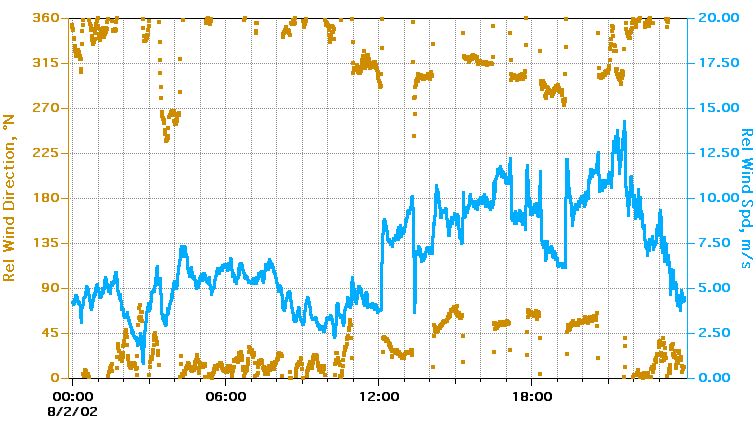 Relative Wind Speed, Direction |
Textual information and data plots are for quicklook and overview purposes only.