
RICO Mini-MOPA Lidar data
Data Summary
Following are examples of products extracted from data taken with the Mini-MOPA Lidar instrument aboard the R/V Seward Johnson during the 2005 RICO experiment. Typical data collection involved using a full-hesispherical scanner in a schedule containing four types of scans, repeated on an hourly basis. Short, full 360° PPI scans were repeated 3 times every hour (between all other scans) in order to calculate horizontal mean winds versus altitude. Sector scans at two levels and RHI scans were used to observe rain shafts, outflows, and other below-cloud wind activity. At the end of each hour, zenith stares allowed for measurement of vertical wind velocities.
Figure 1 contains a color-coded display of the actual scan schedule used during the ship-board portion of the experiment.
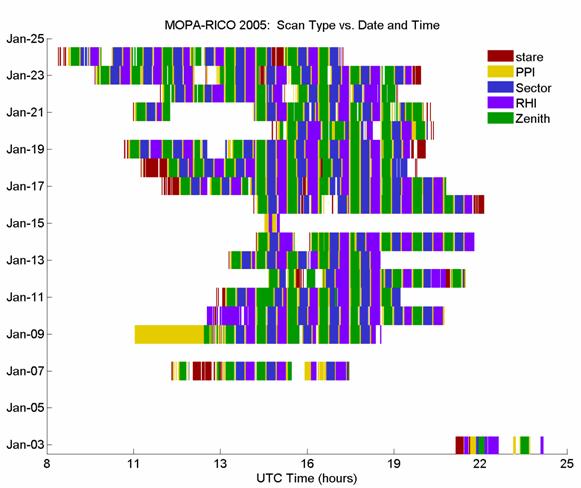
Figure 1. Lidar scan types and schedule during the RICO 2005 experiment.
The most basic data products from the mini-MOPA lidar include wideband SNR (signal to noise ratio) and line-of-sight velocity estimates. Figure 2 contains images of the wideband SNR and velocity estimates taken during a vertical stare scan. For the vertical stare scans, the laser pulse width was shortened from 1 ms to 450 ns, resulting in improved vertical resolution. Data "stripes" prevalent near the end of the data set are due to an increase in the ship's vertical velocities after the ship turned to head into the wind (and waves!). Data from this and similar vertical stare files will be analyzed to gain improved understanding of vertical wind structures, especially in below-cloud situations.
Figure 2. Examples of vertically staring lidar wideband SNR (top) and velocity (bottom) data. In this case, the return signal extends up to the top of the boundary layer at about 2.5 km altitude.
Additional products extracted from the wideband SNR and velocity data include atmospheric return intensity, high vertical resolution mean winds, and sector scan residual winds. Figure 3 contains images of intensity and residual wind fields from a 1° sector scan that captured a rain shaft (visible in the intensity image) andcorresponding outflow (visible in the residual wind image). The mean wind was calculated using data from time-adjacent PPI scans and then subtracted from the sector wind field to reveal the outflow. In this example, the mean wind for the 1° scan was approximately 10 m/s.
Figure 3. Intensity and residual wind fields from a 1 degree VAD scan that captured a rain shaft and corresponding outflow. The color scale at the bottom of the images applies to the residual wind field. X and Y axes labels represent longitude and latitude, respectively.
Other potential data products include high vertical resolution mean-wind profiles updated every 20 minutes, and RHI residual wind fields. As post-processing continues, a collection of images for the intensity and wind-fields of interest is being compiled.